Science-Watching: New Insights into Polyamorphism Could Influence How Drugs Are Formulated

[from the Royal Society of Chemistry’s Chemistry World, by Patrick de Jongh]

Results from a study combining experiments and simulations could overturn the assumption that amorphous forms of the same compound have the same molecular arrangement. The team behind the work claims to have prepared three amorphous forms of the diuretic drug hydrochlorothiazide and determined that they have distinct properties and distinct types of disorder. ‘If polyamorphism is proved in the future to be a universal—or at least not a very rare—phenomenon, then the pharmaceutical industry will need to make screens for polyamorphism and this will also be an opportunity for patenting,’ comments Inês Martins, from the University of Copenhagen in Denmark, who led the work with Thomas Rades.

Crystalline active pharmaceutical ingredients (APIs) often suffer from poor solubility. A common strategy to circumvent this problem is converting APIs into their amorphous form. This has been demonstrated for various APIs, including hydrochlorothiazide. However, the physical properties of polyamorphs are dependent on how they were prepared. Given there are no straightforward techniques to study how molecules interact and organise themselves in amorphous materials, the area is poorly understood.

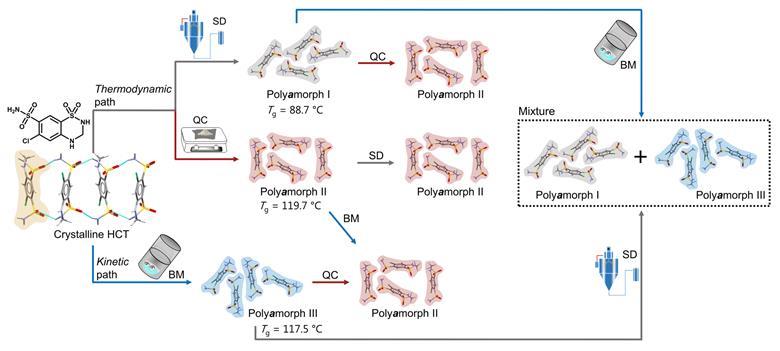
Nevertheless, a team surrounding Rades and Martins set out to identify how amorphous forms of the same API, presenting different physicochemical properties, differ from each other. They decided to study hydrochlorothiazide as it was previously shown to have polyamorphs with glass transition temperatures above room temperature, which facilitates the preparation, isolation and analysis of its different polyamorphs. Starting from crystalline hydrochlorothiazide, they produced three polyamorphs: polyamorph I via spray-drying, polyamorph II via quench-cooling and polyamorph III by ball-milling. Thermal analysis revealed a significantly lower glass-transition temperature for polyamorph I (88.7°C), whereas polyamorphs II and III had similar glass-transition temperatures (117.5°C and 119.7°C, respectively). The polyamorphs also demonstrated very different shelf-life stabilities against crystallisation.

Subsequently, they studied polyamorphic interconversions by submitting the polyamorphs to the preparation conditions used for other polyamorphs. For example, polyamorph I (obtained by spray-drying) was subjected to quench–cooling or ball-milling. Identifying temperature as a critical parameter, they observed that polyamorph II could be obtained from polyamorphs I and III, but the reverse pathway was not possible. Meanwhile, they observed polyamorph I and polyamorph III interconvert. These results demonstrate polyamorph II is the most stable amorphous form.

Source: © Thomas Rades/University of Copenhagen
Researchers used a variety of techniques to elucidate the different polyamorphs that can be produced from crystalline hydrochlorothiazide and the polyamorphic interconversions that occur when a specific amorphous form is submitted to temperature or milling treatments

‘The problem out of the gate with polyamorphism as a concept is how to tell the difference between a well-defined metastable amorphous structure and an unrelaxed one that simply results from kinetically trapped defects introduced during processing. This is hard to define since the amorphous structure is statistical in any case,’ comments Simon Billinge, who studies the structure of disordered materials at Columbia University in the US. ‘They process the samples very differently. We know—from our own work—that this results in amorphous phases with very different stabilities against recrystallisation, for example, but is this polyamorphism? On the other hand, they find that the pair distribution functions of each of their “forms” are identical. There is no experimental evidence for a distinct structure. Taken together, the results do little to advance my understanding of polyamorphism.’

Distinct dihedral angle distributions

To get further information on how the polyamorphs are different on a molecular level, Martins and Rades turned to molecular dynamics simulations, comparing the dihedral angles around the sulfonamide groups in polyamorphs I and II. ‘Polyamorph I, which has a large number of the molecules with a dihedral angle similar to the one reported for crystalline hydrochlorothiazide, has a lower physical stability and faster structural relaxation time than polyamorph II, which has a broader dihedral angle distribution. Our findings indicate that a broader dihedral angle distribution seems to contribute to a better physical stability and slower structural relaxation,’ says Martins. They therefore hypothesise that having half the molecules with a conformation closer to crystalline hydrochlorothiazide and half of the molecules with a different conformation could help in establishing specific molecular arrangements that would favour the stability of the amorphous form.

The team also says the simulations corroborated its experimental results that polyamorph I can transform into polyamorph II, while the opposite conversion did not take place.

However, Billinge does not believe the computational studies provide conclusive evidence: ‘There is a detailed molecular dynamics analysis where different annealing conditions in the simulations give some slightly different statistics on the molecular conformations, but despite their claim, the resulting computed pair distribution functions do not look like the measured ones, so we have no way of knowing if the molecular dynamics is capturing what is happening in the real material. For amorphous materials, it is very difficult to equilibrate them in a molecular dynamics simulation, so you will be looking at artefacts of how the ensemble was created. Any claims to have found polyamorphism from molecular dynamics simulations by themselves are therefore questionable.’

Rades says their results can change the field of pharmaceutics: ‘We expect that other drug molecules may exhibit polyamorphism and the question would be which structural parameters would be different. In the case of hydrochlorothiazide, the dihedral angle distribution was found to be a parameter contributing for the formation of different polyamorphs. In other drugs, maybe the dihedral angle distribution (molecular conformations) could be different as well, but also maybe the type of intermolecular interactions can play a more important role in the formation of polyamorphs.’

The team now hope the pharmaceutical industry will look at amorphous systems differently and not assume that all amorphous forms of the same compound are the same. ‘Knowing this and considering that a certain polyamorph will have better physical stability, solubility or dissolution properties than another polyamorph, this will be an opportunity for the pharmaceutical industry to prepare tablets of a drug where the dose could be lower than tablets containing the crystalline form,’ concludes Rades.

Economics-Watching: Money Transmitter Regulation: Key to Payments Modernization

[from the Federal Reserve Bank of Atlanta, by Claire Greene, payments risk expert in the Retail Payments Risk Forum]

In October, I wrote about the potential for standards to make business-to-business payments more efficient. Today, let’s talk about standards again, this time for money transfer businesses and the state regulations covering them.

We all know these businesses: Venmo, Western Union, MoneyGram, PayPal, CashApp. The roster seemingly grows by the day. Many crypto firms also are registered money transfer businesses. Money transfer businesses typically are nationwide and global in scope. Nevertheless, these multi-state and multi-national businesses are regulated under the separate licensing rules of individual states and US territories. Federal laws, including the Bank Secrecy Act and the Electronic Fund Transfer Act, also apply to money transfer businesses.

For new and established money transfer businesses and for state regulators, the hodgepodge of state regulations creates headaches. To do business everywhere in the United States, money transfer businesses must register separately in each state and US territory and meet license requirements that can vary from state to state. They can face multiple state examinations, also with different requirements, simultaneously (and annually). During examinations, regulators review operations, financial condition, management, and compliance with anti-money laundering laws.

Fortunately, many states have acted to address this confusing and inefficient situation by adopting the Model Money Transmission Modernization Act (MTMA) [archived PDF], sample legislation developed by the Conference of State Bank Supervisors to establish nationwide standards and requirements for licensed money transmitters. Fourteen states have adopted some version of the MTMA: Arizona, Arkansas, Georgia, Hawaii, Indiana, Iowa, Minnesota, Nevada, New Hampshire, North Dakota, South Dakota, Tennessee, Texas, and West Virginia. In my home state of Massachusetts, the legislature’s Joint Committee on Financial Services heard testimony on a version of this bill just last month. For traditional money transmitters and new fintech entrants, the MTMA aims to reduce the substantive and technical differences among the various state laws and regulations. This kind of change has the potential to reduce compliance burdens, encourage innovation, and remove barriers to entry for new market participants.

The MTMA is important given the prodigious growth in person-to-person, or P2P, payments via apps. Among all US consumers, half of P2P payments were sent using noncash methods in 2022, up from less than 30 percent in 2020 (see the chart). From Massachusetts alone, money transmitters sent $31 billion in 2022, according to the state’s Division of Banks.

Half of P2P payments were made electronically in 2022.

The MTMA also has the potential to create efficiencies for state supervisors. For example, the Conference of State Bank Supervisors (CSBS) has facilitated a collaborative exam program for nationwide payments and cryptocurrency firms to undergo one exam, each facilitated by one state overseeing a group of examiners sourced from across the country. According to the CSBS, transmitters in more than 40 states that have laws addressing core precepts can benefit from the streamlined exams.

The MTMA is another example showing that standards create efficiencies that are good for businesses, good for regulators and, by extension, good for consumers.

Economics-Watching: Global Data Tracks Decade-Long Decline in Check Payments

[by Claire Greene, payments risk expert in the Retail Payments Risk Forum at the Federal Reserve Bank of Atlanta]

From around the world, we have more evidence that people are shifting from checks to other means of non-cash payments. Using data from the Bank for International Settlements (BIS), my Atlanta Fed colleagues Antar Diallo and Oz Shy found that from 2012 to 2021, in all 20 countries they examined, the number of checks declined as the number of cashless payments increased. Since checks are cashless payment instruments, it’s notable that the total of cashless payments increased even as a component of this calculation declined.

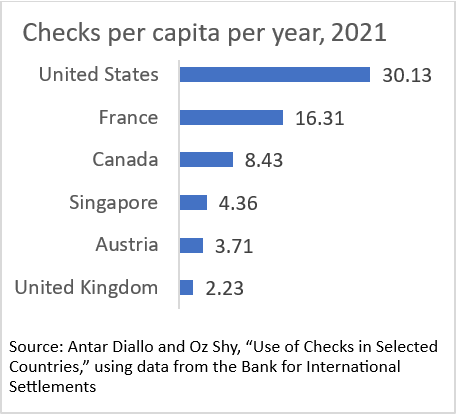
Among the 20 countries that reported the number and value of these payments to the BIS, the United States had by far the highest per capita use of checks per year in 2021: 30 checks. Only six countries reported more than two per capita (chart below), another 12 between zero and two. Belgium and South Africa reported zero.

Yikes, you say, 30 checks per person per year in 2021! How is that possible? Most checks in the United States—about two-thirds—are estimated to be written by businesses, according to the Atlanta Fed’s Check Sample Survey. That would put the average number of checks that U.S. consumers write at about 10 per year on average, which is in line with the findings of the 2021 Survey and Diary of Consumer Payment Choice.

Given the high per capita use in the United States, it makes sense that our year-over-year decline from 2012 has been slower than that for other countries. The per-year decline in the number of U.S. checks from 2012 to 2021 was slower than the decline for all the other high-use countries listed in the chart. The United States was down 6.7 percent per year from 2012 to 2021, compared to down 8.8 percent per year for Canada at the slow end and down 17.4 percent per year for Austria at the quick end.

No way around it: we love our checks, and our response to innovation has been tepid compared to that of other countries.

Movies and Chemistry: Keeping the Enchantment of Education

Several movies give you an “enchanting” back door or window into chemistry so that you can “beat” the tediousness of regular education and come into the field and its topics via these movies:

I.

The Man in the White Suit is a 1951 British comedy classic with Alec Guinness as a genius research chemist. He fiddles with his flasks and polymer and textile chemistry experiments until he invents a fabric that shows no wear and tear “forever.” This would seem like a great boon to humanity in its clothing needs but the chemist (“Sidney Stratton”) finds that both labor and management reject his discovery violently as it threatens jobs and profits. Textile or fabric polymer chemistry is at the heart of the plot.

Cry Terror! is a taut 1958 crime thriller movie with James Mason and Rod Steiger. The plot involves the terrorist threat of exploding a domestic airliner with a hidden RDX cache (a TNT successor) unless the demanded payment is made.

RDX was used by both sides in World War II. The U.S. produced about 15,000 long tons per month during WWII and Germany about 7,000 long tons per month. RDX had the major advantages of possessing greater explosive force than TNT, used in World War I and requiring no additional raw materials for its manufacture.

Semtex is a general-purpose plastic explosive containing RDX and PETN. It is used in commercial blasting, demolition, and in certain military applications.

A Semtex bomb was used in the Pan Am Flight 103 (known also as the Lockerbie) bombing in 1988. A belt laden with 700 g (1.5 lb) of RDX explosives tucked under the dress of the assassin was used in the assassination of former Indian prime minister Rajiv Gandhi in 1991.

The 1993 Bombay bombings used RDX placed into several vehicles as bombs. RDX was the main component used for the 2006 Mumbai train bombings and the Jaipur bombings in 2008. It also is believed to be the explosive used in the 2010 Moscow Metro bombings.

Traces of RDX were found on pieces of wreckage from 1999 Russian apartment bombings and 2004 Russian aircraft bombings. Further reports on the bombs used in the 1999 apartment bombings indicated that while RDX was not a part of the main charge, each bomb contained plastic explosive used as a booster charge.

Ahmed Ressam, the al-Qaeda Millennium Bomber, used a small quantity of RDX as one of the components in the bomb that he prepared to detonate in Los Angeles International Airport on New Year’s Eve 1999-2000; the bomb could have produced a blast forty times greater than that of a devastating car bomb.

In July 2012, the Kenyan government arrested two Iranian nationals and charged them with illegal possession of 15 kilograms (33 pounds) of RDX. According to the Kenyan Police, the Iranians planned to use the RDX for “attacks on Israeli, U.S., UK and Saudi Arabian targets.”

RDX was used in the assassination of Lebanese Prime Minister Rafic Hariri on February 14, 2005.

In the 2019 Pulwama attack in India, 250 kg of high-grade RDX was used by Jaish-e-Mohammed. The attack resulted in the deaths of 44 Central Reserve Police Force personnel as well as the attacker.

Semtex was developed and manufactured in Czechoslovakia, originally under the name B 1 and then under the “Semtex” designation since 1964, labeled as SEMTEX 1A, since 1967 as SEMTEX H, and since 1987 as SEMTEX 10. Originally developed for Czechoslovak military use and export, Semtex eventually became popular with paramilitary groups and rebels or terrorists because prior to 2000 it was extremely difficult to detect, as in the case of Pan Am Flight 103.

The Russian apartment bombings were a series of explosions that hit four apartment blocks in the Russian cities of Buynaksk, Moscow and Volgodonsk in September 1999, killing more than 300, injuring more than 1,000, and spreading fear across the country. The bombings, together with the Invasion of Dagestan, triggered the Second Chechen War. The handling of the crisis by Vladimir Putin, who was prime minister at the time, boosted his popularity greatly and helped him attain the presidency within a few months.

The blasts hit Buynaksk on 4 September and in Moscow on 9 and 13 September. On 13 September, Russian Duma speaker Gennadiy Seleznyov made an announcement in the Duma about receiving a report that another bombing had just happened in the city of Volgodonsk. A bombing did indeed happen in Volgodonsk, but only three days later, on 16 September. Chechen militants were blamed for the bombings, but denied responsibility, along with Chechen president Aslan Maskhadov.

A suspicious device resembling those used in the bombings was found and defused in an apartment block in the Russian city of Ryazan on 22 September. On 23 September, Vladimir Putin praised the vigilance of the inhabitants of Ryazan and ordered the air bombing of Grozny, which marked the beginning of the Second Chechen War. Three FSB agents who had planted the devices at Ryazan were arrested by the local police, with the devices containing a sugar-like substance resembling RDX.

II.

The movie Khartoum (1966) has General Charles Gordon traveling to Sudan in 1884 to quell the “mad mullah” the Mahdi. (Osama bin Laden of his day).
At the train station where General Gordon starts his trip, there’s a railway ad sign that promotes the use of “Wright’s Coal Tar Soap.”

This gives us a sign of the rise of the modern chemical industry.

III.

Think of “Sherlock Holmes” in terms of all the movies and TV series or the original stories and books:

Holmes has to explain to Watson how he survived the assassination attempt on him by Moriarty, “the Napoleon of Crime” who threw him off the Reichenbach Falls. Holmes explains that he faked Moriarty out and clung to a bush or something and was (obviously) not killed.

Holmes tells Watson what he does when he returns to civilization and travels and studies for some three years:

“I then passed through Persia, looking in at Mecca, and paid a short but interesting visit to the Khalifa at Khartoum, the results of which I communicated to the Foreign Office. Returning to France, I spent some months in a research into the coal-tar derivatives, which I conducted in a laboratory at Montpellier, in the south of France.”

The context implies the year 1894.

There is clear evidence that Mr. Holmes was deeply involved in the research of coal-tar derivatives as early as 1889 when the events of the Copper Beeches matter were transpiring.

We are told that on an evening in 1889, Mr. Holmes was seated in 221B Baker Street at the deal table loaded with retorts and test tubes. He was settling down to one of those all-night chemical researches in which he frequently indulged.

The research work was interrupted by a message of distress from Violet Hunter. Watson found that there was a train the next morning, and Holmes tells Watson:

“That will do very nicely. Then perhaps I had better postpone my analysis of the acetones as we may need to be at our best in the morning.”

It is clear that Holmes was engaged in coal-tar research long before his visit to Montpellier in the south of France.

The quotation from the Copper Beeches story refers to acetones, not to coal-tar derivatives.

“In the fractional distillation of coal-tar, the distillate separates into five distinct groups or layers, depending upon the stage of the process and the amount of heat applied. Category-one of the five includes benzene, toluene, xylenes and cumenes.

Acetones [dimethelketone-CH3COCH3] may be derived from the oxidation of cumene. And cumene [isopropylbenzene-C6H5C(CH3)2] is derived by distillation from the coal-tar naphtha fractions.”

Cumenes are derived from coal-tar, and acetones are derived from cumenes. Thus, a study of the acetones is, necessarily, research into coal-tar derivatives.

The rise of chemical engineering and organic chemistry are at the heart of the Sherlock Holmes stories.

Thus we can “climb” into chemistry via these books and movies and keep a feeling of enchantment as a kind of educational “shoehorn.”

Zheng Yongnian (郑永年) on How to Address Western Public Opinion on China: Facts, Science and Reason

[from Pekingology at the Center for China and Globalization (CCG)]

“Be open, open, and more open,” especially to businesses, investors, media, universities, and research institutions. And tit-for-tat doesn’t work, the professor says.

by Zichen Wang, Shuyuan Han, and Li Huiyan

Professor Zheng Yongnian (郑永年), the Founding Director of the Institute for International Affairs at the Chinese University of Hong Kong, Shenzhen, on January 28 published an article on how China should address Western public opinion on China. His advice is in the last part of the article, and below is a translation.

(Emphasis by Pekingnology.)

First, we need to understand how such narratives are formed. Historically, China held a bias due to its self-isolation and limited knowledge of the West. Despite losing the two Opium Wars, Chinese intellectuals at that time still saw Westerners as uncivilized. It was not until China was defeated by Japan, a neighboring country once considered as China’s student, that they realized their ignorance and a need for reform. Before China’s Reform and Opening up, Chinese people barely knew anything about the West. They always assumed Westerners were in deep distress, repeating the same lack of understanding of the West.

Similarly, the West’s uncertainty and fear towards China’s rise stem from a lack of understanding and even fear of the country, and their ingrained ideology would lead to misconceptions.

China is the world’s second-largest economy. The externalities and influence of its economy on the West are obvious. Upon joining the WTO, some Chinese people also felt unsettled by the externalities of the West. Some said, “the wolf is coming.” Now it is the West that is experiencing such worries.

It is crucial to recognize the significant impact of the Western hypocritical narratives against China, even if they are based on ideology rather than facts. We must also acknowledge that ideology-based public opinion from the West can exert a powerful influence on their policies toward China.

Historically, the West tended to demonize others while presenting themselves as morally superior, which enabled them to apply Social Darwinism to international politics easily and thus legitimizing conflicts and even wars with other nations. Given the Soviet Union’s failure in the ideological arena during the Cold War, we should by no means ignore any ideology-based public opinion toward China from the West.

Second, to make rational responses to the Western ideology-based criticisms, we should draw lessons from the history of the world economy, such as the lessons of the Soviet Union, as well as our practices, such as the rhetorical battle with the West in the past few years. Coming up with an externally-facing public opinion based on a different ideology is not the most effective in addressing public opinion attacks based on an ideology. Empirically, tit-for-tat is ineffective and can worsen the situation. Again, the failure of the Soviet Union is a prime example, as its battle with a Western ideology failed. When faced with China-demonizing based on ideology from the West, we need to do the simplest thing, namely resorting to facts, science, and reason.

Third, and most importantly, China needs to prioritize its sustainable development, which ultimately benefits the country itself. It is important to recognize that the foundation of the government’s governance lies in its citizens, not Western praise. The support from its people is crucial for both the nation’s longevity and stability., China’s sustainable development also benefits the world economy by boosting its growth. As mentioned above, China has been the largest contributor to the growth of the world economy since it joined the WTO.

It is crucial to prioritize the building of a knowledge system based on China’s practical experiences. Regarding global soft power, we need a knowledge system based on our experiences rather than a certain ideology. While there has been a proposal for an autonomous knowledge system, continuous effort is still required.

Fourth, given the substantial externalities of our economy, we must further communicate and coordinate with other countries on economic policies, regardless of their respective sizes. Our duty is to fulfill the responsibility as a major player in the international community, which also benefits China.

After the 1997-1998 Asian financial crisis, China promised not to devalue its currency, and that commitment became an international public good in Asia. Similarly, after the global financial crisis from 2007 to 2008, China made similar contributions. As China re-opens its economy after the pandemic, it is important not only to take note of the hypocritical comments from certain quarters in the Western world but also to recognize the positive evaluations and high expectations from many international organizations.

Fifth, we must be open, open, and more open. Despite China’s efforts, there remains a persistent ideological camp in the West that views China through an ideological lens, a situation made worse by the past three years of the pandemic. The pandemic was so severe that it hindered travel across borders; as a result, some Western media and scholars tend to assess China through ideology since they couldn’t come here to see the facts with their own eyes.

The assessment of China through a uniform ideological lens appears to have strengthened the original Western ideological camp. However, the United States and the West have more than one ideology, and not all people believe in the prevailing ideology in the public opinion sphere. China’s openness provides a “seeing is believing” opportunity for different groups in the West. China should increase its openness to Western groups, including businesses, investors, media, universities, and research institutions. The changes in their understanding could render those ideological-based public opinions less effective.

Facing the Global South: Building a New International System by Yang Ping

“If you raise [the development of the BRI] to the strategic level, there are countries where … you will have to lose money and there are countries where you will be free to make money.”

by Thomas des Garets Geddes, Sinification

Dear Everyone,

How to respond to the growing political divide between China and the West marked by partial decoupling, security alliances, and the risk of sanctions, amongst other things, continues to be a major topic of discussion among China’s intellectual elite. As already evidenced in previous editions of this newsletter, opinions vary considerably. Those presented here so far have ranged from Da Wei (达巍) stressing the importance of preserving if not strengthening ties with the West and Shen Wei (沈伟) arguing in favor of reforming the WTO and building up a network of free trade agreements to Ye Hailin (叶海林) emphasizing the need for China to demonstrate its military might to demobilize U.S. allies and Lu Feng (路风) calling for self-reliance and greater assertiveness in the field of tech. A certain amount of overlap certainly exists among these perspectives but the differences are nonetheless striking.

Today’s edition of Sinification looks at a speech made last month by Yang Ping (杨平), head and editor-in-chief of the highly regarded Beijing Cultural Review (文化纵横, hereafter BCR). Yang is also director of the Longway Foundation (修远基金会) which publishes BCR. The foundation describes its publication as “the most influential magazine of intellectual thought and commentary in China” and sees itself as having a key role in helping shape the direction of intellectual debates in China (“议题的设置就是意识形态斗争成功的一半”). Indeed, BCR often republishes old articles at key junctures as so often highlighted by David Ownby’s wonderful Reading the China Dream.

The following are excerpts from an edited transcript of a speech by Yang made at an event hosted by Renmin University’s Chongyang Institute for Financial Studies, which was attended by China’s Vice-minister of foreign affairs Xie Feng (谢锋). In his speech, Yang advocates building a new international system led by countries in the Global South (which, of course, includes China) rather than the West. His ideas are not particularly novel but are nevertheless noteworthy in that they represent yet another viewpoint in the ongoing debate over how China should respond to the increasing tensions that characterize its relations with the U.S. and other Western countries. Next week, I will be sharing a somewhat longer piece that proposes a way of protecting China from the growing threat of Western sanctions.

Yang’s speech in a nutshell:

  • Capitalist politics” are no longer in line with “capitalist economics.” The former now undermines globalization, while the latter supports it.
  • Sanctions, export controls, friend-shoring and alliance-building are damaging the world economy and further alienating China from the current U.S.-led international order.
  • China must respond to this growing trend by building a “new type of international system” with other countries in the Global South.
  • BRI projects should be increasingly focused on achieving this goal and thus allow more room for loss-making endeavors.

Capitalist politics ≠ Capitalist economics

“Since 2022 and the Russo-Ukrainian conflict, our main focus and topic of discussion has been China’s construction of a new type of international system.

“The most important feature of today’s world is the beginning of a separation between capitalist politics and capitalist economics. The capitalist political order and the capitalist economic order do not support each other [any longer].

“We have witnessed two typical manifestations of the separation of politics and the economy and the impact of politics on the economy:

  1. The first is the conflict between Russia and Ukraine. The sanctions imposed on Russia by the United States and the West have reached unthinkable, abominable [令人发指] and unimaginable proportions. Under established international rules, it was understood that such sanctions could not possibly occur, but now they have. These include the fracturing of the financial system, the expropriation and seizure of Russian private assets and the freezing of Russian foreign exchange reserves. These are all abominable and unimaginable forms of confrontation. At the same time, the Russo-Ukrainian conflict has led to serious disruptions in global food and energy systems and supply chains, with massive food ‘shortages’ and soaring food prices, particularly in developing countries. Sanctions and political repression [政治打压] have severely disrupted the [world’s] economic order.
  2. The second is the conflict between the U.S. and China. Since the Trump era, the U.S. has been engaged in a trade war against China, mainly by raising tariffs. Basically, this was simply about balancing trade [with China] and used mainly economic means. But under Biden, it [has become] a war that mixes politics with economics. Biden’s strategy towards China can basically be summed up in just a few words: one, friend-shoring, [i.e.] only allowing friendly countries into [parts of] its supply chains; two, alliance politics, [i.e.] continuously forging an alliance system involving NATO, the European Union, Japan, AUKUS and the four Asia-Pacific countries [I assume he is referring to South Korea, Japan, New Zealand and Australia taking part for the first time in a NATO summit last year] and constantly opposing China [不断应对中国]; three, its so-called ‘precision strikes’, [i.e.] its radical crackdown on China’s high tech [industry], especially our chip industry.”

China is being pushed out of the U.S.-led international system

“The information I have seen so far is that the number of Chinese companies included in the U.S.’s ‘entity list’ has risen from 132 under Trump to over 530 now. The scope of such point-to-point [点对点] precision strikes is constantly expanding. With such a political impact on the economy, we can feel the [world’s] economic order being disrupted across the board. The world is moving inexorably in the direction of decoupling. The phenomenon of politics affecting the economy and the capitalist political order no longer upholding the capitalist economic order are extremely striking.

“In such a context, the challenges now facing China are extremely serious and varied. We have the pressures of dealing both with containment in the Indo-Pacific and with the U.S.-led politics of alliances across the world. More importantly and fundamentally China faces the strategic task of building a new type of international system [新型国际体系] … The existing Western-dominated international system used to be one in which we tried hard to blend [so as] to become one with it. During this process, we [sought to] absorb the West’s advanced technologies and management [practices] and thus complete our mission of industrialisation and modernization.

“But once you enter the existing international system, he [who is already inside] does not want to play with you, and even wants to drive you back out. He wants to divide both supply chains and the economic system into two parts [搞成两套] and desperately wants to contain and suppress you. This is not something that can be determined by your own subjective preferences. He has made up his mind: you have already become his ‘fated opponent’ [命定的对手]. He has to suppress you and drive you out of the existing system.”

Building a new international system with the Global South

“It is at this point that China is faced with the task of constructing a new type of international system that is not dominated by the West. In today’s so-called strategic quadrangle consisting of the U.S., Europe, Russia and China, how to construct such an international system appears particularly difficult [逼庂 literally means ‘narrow’ or ‘cramped’ rather than ‘difficult’].

“But if we look a little further south, we will find a vast number of developing countries, the Third World and the countries of the global South. They should be our strategy’s depth [我们的战略纵深]. That is to say, [we should] build a new type of international relations and a new type of international system that has strategic depth and in which China and the countries of the global South are jointly integrated. [This] is, in my view, an important strategic task for China’s international relations in the coming decades.”

BRI projects: Strategy trumps profitability

“For China today, especially for businesses and governments at all levels [within China] that are currently working hard to develop BRI trade, there is a very important point to which they should be alerted or reminded about: the development of the BRI has to go beyond mere business, beyond the general export of [China’s excess] production capacity, beyond the partial thinking of industry and the partial thinking at the regional level, or the simple economic way of thinking of business. The development of the BRI should be considered at the strategic level. That is, it should be included into China’s strategy when thinking about Africa, South America, Southeast Asia and Central Asia.

“If you raise [the development of the BRI] to the strategic level, there are countries where you won’t be able to make money and will have to lose money, and there are countries where you will be free to make money. You have to unite the two within your organic strategy.

“The strategic task of building a new type of international system is, in my view, a strategic proposition that Chinese think tanks and research institutes should pay very close attention to with regards to international relations.

“Time is limited today. I just wanted to make a start here. I hope to receive your corrections and criticisms. Thank you!”

[Subscribe to Sinification]

The recessive importance of the Global South was previously explored by Richard and his partner Larry, with input from Supratik Bose, many decades ago as shown here.

FRBSF Economic Letter: Can Monetary Policy Tame Rent Inflation?

[from the Federal Reserve Bank of San Francisco Economic Letter]

by Zheng Liu and Mollie Pepper

Rent inflation has surged since early 2021. Because the cost of housing is an important component of total U.S. consumer spending, high rent inflation has contributed to elevated levels of overall inflation. Evidence suggests that, as monetary policy tightening cools housing markets, it can also reduce rent inflation, although this tends to adjust relatively slowly. A policy tightening equivalent to a 1 percentage point increase in the federal funds rate could reduce rent inflation as much as 3.2 percentage points over 2½ years.

“We’ve had a time of red-hot housing market all over the country… Shelter inflation is going to remain high for some time. We’re looking for it to come down, but it’s not exactly clear when that will happen. Hope for the best, plan for the worst.”

Federal Reserve Chair Jerome Powell (2022)

The rapid run-up of shelter costs—both house prices and rents—during the recovery from the pandemic has raised questions about how inflation pressures might affect housing affordability. Since March 2022, the Federal Reserve has rapidly lifted its federal funds rate target from near zero to over 4%, and policymakers have signaled that they are open to keeping the monetary policy stance sufficiently restrictive to return inflation to the longer-run goal of 2% on average. The tightened financial conditions following those policy changes, especially the surge in mortgage interest rates, have helped cool house price growth. However, rent inflation remains elevated.

This Economic Letter examines the effectiveness of monetary policy tightening for reducing rent inflation. We estimate that, during the period from 1988 to 2019, a policy tightening equivalent to a 1 percentage point increase in the federal funds rate can reduce rent inflation—measured by 12-month percentage changes in the personal consumption expenditures (PCE) housing price index—by about 3.2 percentage points, but the full impact takes about 2½ years to materialize. Based on housing costs’ share in total PCE, this translates to a reduction in headline PCE inflation of about 0.5 percentage point over the same time horizon.

Rising housing costs

Following the COVID-19 recession, house prices and rents both surged in the United States. For example, the 12-month growth rate of Standard & Poor’s CoreLogic Case-Shiller Home Price Index accelerated from about 10% in December 2020 to over 20% in March 2022. After the Federal Reserve started raising the target for the federal funds rate in March, house price growth has slowed significantly, to about 9% in October 2022.

Rent inflation also accelerated during the pandemic period. Figure 1 shows that rent inflation—measured using 12-month changes in the PCE housing price index and including rents for tenant-occupied housing and imputed rents for owner-occupied housing—rose from a low point of about 2% in early 2021 to 7.7% by December 2022, the highest level since 1986. During the same period, rent inflation measured by 12-month changes in the shelter component of the consumer price index (CPI) experienced a similar increase. Thus, following the tightening of monetary policy, house price growth has slowed but rent inflation continues to rise.

Figure 1: PCE and CPI measures of rent inflation
Source: Bureau of Economic Analysis, Bureau of Labor Statistics, and Haver Analytics.
Note: Twelve-month percentage changes. Gray shading indicates NBER recession dates.

Economic theory suggests that some common forces such as changes in housing demand can drive both rents and house prices. For example, the expansion of remote work since the COVID-19 pandemic has increased demand for housing, raising both house prices and rents (Kmetz, Mondragon, and Wieland 2022). To the extent that the stream of current and future rents reflects the fundamental value of a house, house prices can be a leading indicator of future rent inflation (Lansing, Oliveira, and Shapiro 2022). Thus, monetary policy can affect both house prices and rents by cooling housing demand.

Housing demand responds to changes in financial conditions, such as increases in mortgage interest rates. However, theory suggests that house prices are more sensitive than rental prices to changes in financial conditions, because home purchases typically require longer-term mortgage financing. In addition, unlike rents, house prices can be partly driven by investor sentiments or beliefs, which explains the observed larger swings in house prices than in rents over business cycles (Dong et al. 2022). Long-term rental contracts can also contribute to slow adjustments in rent inflation.

Rent inflation is an important contributor to overall inflation because housing costs are an important component of total consumption expenditures. On average, housing expenditures represent about 15% of total PCE and 25% of the services component of PCE. In CPI, shelter costs represent an even larger share, accounting for about 30% of total consumption of all urban consumers and about 40% of core consumption expenditures excluding volatile food and energy components.

The contribution of rent inflation to overall PCE inflation has increased since early 2021. As Figure 2 shows, in the first quarter of 2021, rent inflation accounted for about 22% of the four-quarter change in the PCE services price index, excluding energy: 0.5 of the 2.3 percentage points increase in service prices was attributable to rent inflation. By the third quarter of 2022, the contribution of rent inflation had climbed to about one-third, or 1.5 of the 4.7 percentage point increase in service prices.

Figure 2: Rising contribution of rent inflation to services inflation
Source: Bureau of Economic Analysis, Haver Analytics, and authors’ calculations.
Note: Four-quarter changes in PCE services price index excluding energy.

Measuring policy effects

Given the rising contribution of rent inflation to overall inflation, it is important to assess the quantitative effects of monetary policy tightening on rent inflation.

For our analysis, we use a measure of monetary policy surprises constructed by Bauer and Swanson (2022). Their measure focuses on high-frequency changes in financial market indicators within a short period surrounding the Federal Open Market Committee (FOMC) policy announcements. If the public fully anticipates a policy change, then the financial market would not react to new policy announcements. However, if the market does react to an announcement, then the policy change must contain a surprise element. Thus, changes in financial market indicators, such as the price of Eurodollar futures, in a narrow window around an FOMC announcement can capture policy surprises. In practice, however, the data constructed this way are not complete surprises because they can be predicted by some macro and financial variables shortly before FOMC announcements. We follow the approach of Bauer and Swanson (2022) to purge the influences of those macro and financial variables from the measure of policy surprises. We use the resulting quarterly time series to measure monetary policy shocks, with a sample period from 1988 to 2019.

We then use a local projections model—a statistical tool proposed by Jordà (2005)—to project how rent inflation responds over time to a tightening of monetary policy equivalent to a 1 percentage point unanticipated increase in the federal funds rate in a given quarter. The model takes into account how monetary policy shocks interact with other macroeconomic variables, including lags of rent inflation, real GDP growth, and core PCE inflation.

In the final step, we compute the responses of rent inflation relative to its preshock level over a period up to 20 quarters after the initial increase in the federal funds rate.

Gradual impact of policy tightening on rent inflation

Figure 3 shows the response of rent inflation during the first 20 quarters after an unanticipated tightening of monetary policy (solid blue line). The shaded area shows the confidence band, indicating the statistical uncertainty in estimating the responses. Under the assumption that the model is correct, the shaded area contains the actual value of the rent inflation responses to the monetary policy shock roughly two-thirds of the time. The policy shock is normalized such that it is equivalent to a 1 percentage point unanticipated increase in the federal funds rate.

Figure 3: Response of rent inflation to monetary policy tightening
Source: Bureau of Economic Analysis, Bauer and Swanson (2022), and authors’ calculations.
Note: Response of rent inflation to a monetary policy shock equivalent to a 1 percentage point surprise increase in the federal funds rate. Shaded region shows 68% confidence band around the estimate.

The figure shows that monetary policy tightening has significant and gradual effects on rent inflation. On impact, a 1 percentage point increase in the federal funds rate reduces rent inflation about 0.6 percentage point relative to its preshock level. Over time, rent inflation declines gradually, falling about 3.2 percentage points in the 10 quarters following the impact. The slow adjustment in rent inflation partly reflects the stickiness in nominal rents due to long-term rental contracts. Since housing expenditures account for about 15% of total PCE, this estimate translates to a reduction in headline PCE inflation of about 0.5 percentage point, stemming from the decline in rent inflation over a period of 2½ years.

The rent component of PCE is measured based on average rents, including those locked in long-term rental contracts, which are slow to adjust to changes in economic and financial conditions. Rents on new leases, however, are more flexible. For example, the 12-month growth in Zillow’s observed rent index, which measures changes in asking rents on new leases, has slowed significantly since March 2022 (see Figure 4). Asking rents are typically a leading indicator of future average rents. Thus, the slowdown in asking rent growth could portend lower future rent inflation.

Figure 4: Year-over-year observed rent growth starting to slow
Source: Zillow and Haver Analytics.
Note: Twelve-month percentage changes in Zillow’s observed rent index. Gray shading indicates NBER recession dates.

Conclusion

Rents are an important component of consumer expenditures. Recent surges in rent inflation have led to concerns that overall inflation might stay persistently high despite tightening of monetary policy. We present evidence that monetary policy tightening is effective for reducing rent inflation, although the full impact takes time to materialize. A policy tightening equivalent to a 1 percentage point increase in the federal funds rate can reduce rent inflation up to 3.2 percentage points over the course of 2½ years. This translates to a maximum reduction in headline PCE inflation of about 0.5 percentage point over the same time horizon. Although average rents are slow to respond to policy changes, growth of asking rents on new leases has started to slow following recent monetary policy tightening. Our finding suggests that this tightening will gradually bring rent inflation down over time, thereby helping to reduce overall inflation.

Zheng Liu — Vice President and Director of the Center for Pacific Basin Studies, Economic Research Department, Federal Reserve Bank of San Francisco

Mollie Pepper — Research Associate, Economic Research Department, Federal Reserve Bank of San Francisco

[Archived PDF]

Economics-Watching: FRBSF Economic Letter

[from the Federal Reserve Bank of San Francisco]

Are Inflation Expectations Well Anchored in Mexico?

by Remy Beauregard, Jens H.E. Christensen, Eric Fischer and Simon Zhu

Price inflation has increased sharply since early 2021 in many countries, including Mexico. If sustained, high inflation in Mexico could raise questions about the ability of its central bank to bring inflation down to its 3% inflation target. However, analyzing the difference between market prices of nominal and inflation-indexed government bonds suggests investors’ long-term inflation expectations in Mexico are close to the central bank’s inflation target and are projected to remain so in coming years.


Inflation has risen substantially in many countries, including Mexico, since early 2021, driven in part by unique factors related to the COVID-19 pandemic. Sustained elevated inflation could be particularly challenging for inflation-targeting central banks in emerging economies given their higher macroeconomic uncertainty and greater sensitivity to external shocks compared with more developed economies. To examine this risk for a representative emerging economy affected by COVID-era disruptions in much the same way as the United States, we focus on Mexico, which has conducted monetary policy since 2002 according to an inflation targeting regime with a target rate for consumer price inflation of 3% per year.

In this Economic Letter, we assess whether recent higher inflation is leading businesses and households in Mexico to expect inflation to remain high over the long run. Specifically, we focus on what rising market-based measures of inflation compensation may imply about bond investors’ outlook for inflation. The rise in inflation compensation since spring 2021 could reflect three factors: an increase in investorsinflation expectations, an uptick in the premium investors demand for assuming inflation risk, or changes in other risk and liquidity premiums. We explore the relative importance of each of these factors using a novel dynamic term structure model of nominal and inflation-adjusted yields described in Beauregard et al. (2021, henceforth BCFZ). Overall, our results for five-year inflation expectations five years from now suggest Mexican bond investors’ long-term inflation expectations have been little affected by the recent rise in inflation. Instead, the rise in inflation compensation reflects a notable uptick in the inflation risk premium to the high end of its historical range. This suggests that, despite inflation expectations being little changed on average, some investors are particularly concerned about the risk that inflation will remain above expected levels.

The recent rise in Mexican inflation

Figure 1 shows the year-over-year change in the Mexican consumer price index (CPI) measured both by the headline CPI (green line) and the more stable core CPI (blue line) that strips out volatile food and energy prices. Also shown with a horizontal gray line is the 3% inflation target of the nation’s central bank, the Bank of Mexico.

Figure 1: Mexican consumer price index inflation
Mexican consumer price index inflation
Source: Instituto Nacional de Estadística y Geografía.

We note that Mexican CPI inflation has averaged somewhat above the Bank of Mexico’s target since its adoption in 2002. More importantly, CPI inflation in Mexico appears to have become more volatile and somewhat higher over the past five years. Although previous research by De Pooter et al. (2014) found inflation expectations in Mexico to be well anchored, the significant global economic dislocations caused by the coronavirus pandemic and related inflationary pressures could impact inflation expectations of businesses and households.

To assess the persistence of the recent rise in Mexican inflation, we turn to financial market data, which reflect forward-looking expectations among a large and diverse group of investors and financial market participants. Specifically, we consider prices of conventional fixed-coupon bonds that pay a nominal interest rate and inflation-indexed bonds that pay a real interest rate because their cash flows are adjusted with the change in the CPI and therefore maintain their purchasing power. Both types of securities are issued and guaranteed by the Mexican government.

The difference between nominal and real yields for bonds of the same maturity is known as breakeven inflation (BEI). This represents a market-based measure of inflation compensation used to assess financial market participants’ inflation expectations. Figure 2 shows BEI rates at different maturities, meaning annual average rates of inflation compensation between now and maturity, from 1 to 10 years at the end of March 2021 (green line) and at the end of November 2022 (blue line). The slightly upward-sloping BEI curve of close to 3% in 2021 contrasts with the higher downward-sloping BEI curve in 2022.

Figure 2: BEI curves for 1-year to 10-year Mexican bond maturities
BEI curves for 1-year to 10-year Mexican bond maturities
Source: Authors’ calculations using bond prices from Bloomberg.

The increase for shorter maturities, the left end of the 2022 BEI curve, is closely tied to the current high level of inflation and suggests inflation may remain elevated for some time. In contrast, the increase at longer maturities, the right end of the 2022 BEI curve, suggests that investors’ longer-term inflation expectations may be drifting above the Bank of Mexico’s inflation target. To better understand the shape and sources of variation of the BEI curve we use a yield curve model.

A yield curve model of nominal and real yields

Market-based measures of inflation compensation such as BEI rates contain three components. First, they include the average CPI inflation rate expected by bond investors, which is the focus here. Second is an inflation risk premium to compensate investors for the uncertainty of future inflation. This premium is embedded in nominal yields that provide no inflation protection. Third is the difference in relative market liquidity between standard fixed-coupon and inflation-indexed bonds. As discussed in BCFZ, both of these types of Mexican bonds are less liquid than U.S. Treasuries, and their prices therefore contain a discount to compensate investors for their liquidity risk. Neither the inflation risk premium nor the liquidity premiums are directly observable and must therefore be estimated.

To adjust for these challenges, we first use the nominal and real yields model developed in BCFZ to identify liquidity premiums in standard fixed-coupon and inflation-indexed bond prices as a function of the time since issuance and the remaining time to maturity. The time since issuance serves as a proxy for declining liquidity as, over time, a larger fraction of bonds gets locked into buy-and-hold strategies. We refer to the observed BEI net of estimated liquidity premiums as the adjusted BEI. In a second step, we then separate adjusted BEI into components representing investorsinflation expectations using a formula based on the absence of bond market arbitrage opportunities and the residual inflation risk premium.

Results

To assess whether investorsinflation outlook has fundamentally changed, we follow De Pooter et al. (2014) and examine the five-year forward BEI rate that starts five years ahead, denoted 5yr5yr BEI. This is a horizon sufficiently long into the future that most transitory shocks to the economy can be expected to have vanished. Hence, the embedded inflation expectations are presumably less affected by current high inflation and pandemic-related transitory conditions and can therefore speak to the question about the anchoring of inflation expectations in Mexico.

Figure 3 shows the breakdown of 5yr5yr BEI into its various components according to our model. The dark blue line is the observed BEI, and the red line is the estimated adjusted BEI without liquidity risk premiums or other residual disturbances. The difference between these two measures of BEI—the yellow shaded area—represents the model’s estimate of the net liquidity premium or distortion of the observed BEI series due to risk premiums in both nominal and inflation-indexed bond prices. The adjusted BEI is entirely above the observed BEI, suggesting the liquidity risk distortions are systematically larger in the inflation-indexed bond prices, consistent with similar evidence from the U.S. Treasury market (Andreasen and Christensen 2016). Note that the net BEI liquidity premium widened around the financial turmoil in spring 2020 at the start of the pandemic and remains elevated.

Figure 3: Components of 5yr5yr breakeven inflation for Mexico
Components of 5yr5yr breakeven inflation for Mexico
Source: Survey forecasts from Consensus Economics and authors’ calculations using bond prices from Bloomberg.

The model also allows us to break down the adjusted BEI into an expected inflation component (light blue line) and the residual inflation risk premium (green line). Also shown is the Bank of Mexico’s 3% inflation target (gray horizontal line). For comparison, the figure also shows the 5yr5yr expected CPI inflation in Mexico reported semiannually in the Consensus Forecasts surveys (dark blue squares). We note that both observed and adjusted BEI have trended higher since the start of the pandemic in early 2020. Importantly, the breakdown indicates that long-term expected inflation in Mexico has remained stable, slightly above the 3% inflation target. As a result, the increase in BEI can be attributed to the inflation risk premium, which is at the high end of its historical range towards the end of our sample. Given the elevated levels of current inflation, this suggests some investors are concerned that inflation could remain elevated for longer than currently anticipated.

This raises the question of whether long-term inflation expectations in Mexico are likely to remain anchored near their current level going forward. To assess this risk, we simulate 10,000-factor paths over a three-year horizon using the estimated factors and factor dynamics as of November 2022—that is, the simulations are conditioned on the shapes of the nominal and real yield curves and investors’ embedded forward-looking expectations as of November 2022. These simulated factor paths are then converted into forecasts of 5yr5yr expected inflation. Figure 4 shows the median projection (solid green line) and the 5th and 95th percentile values (dashed green lines) for the simulated 5yr5yr expected inflation over a three-year horizon.

Figure 4: Three-year projections of 5yr5yr expected inflation, Mexico
Three-year projections of 5yr5yr expected inflation, Mexico
Source: Authors’ calculations.

Our model projections indicate that long-term inflation expectations are likely to deviate only modestly from their current level, consistent with the variation of the historical estimates back to 2009. Overall, our findings represent tangible evidence that long-term inflation expectations remain well-anchored in Mexico despite the recent rise in inflation.

Conclusion

Global inflation pressures in the aftermath of the pandemic have raised fears about a sustained increase in the level of inflation around the world, which could be particularly challenging for developing economies with monetary policy guided by an inflation target. In this Letter, to assess this risk for a major emerging economy with an established inflation target, we examine the variation in Mexico’s nominal and inflation-indexed bond prices, while accounting for their respective liquidity risk premiums. This allows us to estimate Mexican bond investors’ inflation expectations and associated risk premiums. The results reveal that the inflation risk premium has pushed up Mexican BEI rates in recent years, while investors’ long-term inflation expectations have remained stable near the Bank of Mexico’s inflation target despite the rise in inflation.

The policy path needed to keep inflation expectations anchored in a situation with highly elevated inflation may involve tradeoffs. The Bank of Mexico responded early and forcefully to inflation pressures starting in June 2021 and has indicated further tightening of the policy rate would likely be appropriate to bring inflation back down to target over the medium term. This could lower economic growth in Mexico in both 2022 and 2023. On the other hand, history shows that it may be difficult and costly to reverse extended departures from announced inflation targets. Thus, it will be important for central banks with inflation-targeting frameworks to monitor measures of long-term inflation expectations in the current situation.

Remy Beauregard
Economics Ph.D. student, University of California at Davis

Jens H.E. Christensen
Research Advisor, Economic Research Department, Federal Reserve Bank of San Francisco

Eric Fischer
Financial modeling and quantitative analytics principal, Markets Group, Federal Reserve Bank of New York

Simon Zhu
Economics Ph.D. student, University of Texas at Austin

References

Andreasen, Martin M. and Jens H.E. Christensen. 2016. “TIPS Liquidity and the Outlook for Inflation.” [PDFFRBSF Economic Letter 2016-35 (November 21).

Beauregard, Remy, Jens H.E. Christensen, Eric Fischer, and Simon Zhu. 2021. “Inflation Expectations and Risk Premia in Emerging Bond Markets: Evidence from Mexico.” [PDF] FRB San Francisco Working Paper 2021-08.

De Pooter, Michiel, Patrice Robitaille, Ian Walker, and Michael Zdinak. 2014. “Are Long-Term Inflation Expectations Well Anchored in Brazil, Chile, and Mexico?” [PDFInternational Journal of Central Banking 10(2), pp. 337–400.

[Archived PDF]

Economics-Watching: FedViews for January 2023

[from the Federal Reserve Bank of San Francisco]

Adam Shapiro, vice president at the Federal Reserve Bank of San Francisco, stated his views on the current economy and the outlook as of January 12, 2023.

  • While continuing to cool over the last several months, 12-month inflation remains at historically high levels. The headline personal consumption expenditures (PCE) price index rose 5.5% in November 2022 from a year earlier. This marks a decline in inflation to a level last observed in October 2021, but still well above the Fed’s longer-run goal of 2%. A portion of the inflation moderation is attributable to recent declines in energy prices. Core PCE inflation, which removes food and energy prices, has shown less easing.
  • Owing to fiscal relief efforts and lower household spending over the course of the pandemic, consumers accumulated over $2 trillion dollars in excess savings, based on pre-pandemic trends. Since then, consumers have drawn down over half of this excess savings which has helped support recent growth in personal consumption expenditures. A considerable amount of accumulated savings remains for some consumers to support spending in 2023.
  • In the wake of the pandemic, consumer spending patterns shifted away from services towards goods. While there appears to be some normalization of spending behavior, this shift has generally persisted. Real goods spending remains significantly above its pre-pandemic trend, driven by strong demand for durables such as furniture, electronics, and recreational goods. Spending on services has shown a resurgence but remains below its pre-pandemic trend.
  • Supply chain bottlenecks for materials and labor remain a constraint on production, although there are some recent signs of easing. The fraction of manufacturers who reported operating below capacity due to insufficient materials peaked in late 2021 and has moderately declined over the past year. However, the fraction of manufacturers reporting insufficient labor has persisted at high levels.
  • The labor market remains tight, despite some signs of cooling. The number of available jobs remains well above the number of available workers, although vacancy postings have been trending down in recent months. The tight labor market has put continued upward pressure on wages and labor market turnover.
  • A decomposition of headline PCE inflation into supply– and demand-driven components shows that both supply and demand factors are responsible for the recent rise in inflation. The surge in inflation in early 2021 was mainly due to an increase in demand-driven factors. Subsequently, supply factors became more prevalent for the remainder of 2021. Supply-driven inflation has moderated significantly over recent months, while demand-driven inflation remains elevated.
  • The Federal Open Market Committee (FOMC) raised the federal funds rate by 50 basis points at the December meeting to a range of 4.25 to 4.5%. This cycle of continued rate increases since March of last year represents the fastest pace of monetary policy tightening in 40 years. The increase in the federal funds rate has been accompanied by a gradual reduction in the size of the Federal Reserve’s balance sheet.
  • Economic activity in sectors such as housing, which is sensitive to rising interest rates, has slowed considerably in recent months. Housing starts have fallen steadily over the past year, as have other housing market indicators, such as existing home sales and house prices.
  • Although the labor market is currently very strong, financial markets are pointing to some downside risks. Namely, the difference between longer- and shorter-term interest rates has turned negative, which historically tends to occur immediately preceding recessions. It remains unclear whether lower longer-term yields are indicative of anticipated slower growth or lower inflation.
  • Short-term inflation expectations remain elevated relative to their pre-pandemic levels in December 2019. Consumers are expecting prices to rise 5% this year, while professional forecasters are expecting prices to rise 3.5%. Longer-term inflation expectations remain more subdued, indicating that both consumers and professionals believe inflation pressures will eventually dissipate.
  • Rent inflation is expected to remain high over the next year. The prices for asking rents have grown quite substantially over the last two years. As new leases begin and existing leases are renewed, these higher asking rents will flow into the stock of rental units, putting upward pressure on rent inflation.
  • We are expecting inflation to moderate over the next few years as monetary policy continues to restrain demand and supply bottlenecks continue to ease. We anticipate that it will take some time for inflation to reach the Fed’s longer-run goal of 2%.
Inflation is cooling, but remains very high
Savings are boosting consumer demand
Goods consumption remains elevated
Supply shortages are prevalent, but easing
Labor market remains tight, but is cooling
Both supply and demand drive inflation
Monetary policy tightening is having real effects
Yield curve is inverted, signaling recession risk
Short-term inflation expectations remain elevated
High rent inflation is in the pipeline
Inflation likely to remain above 2% for some time

[Archived PDF]

Read other issues from FedViews.

First Clean Energy Cybersecurity Accelerator Participants Begin Technical Assessment

[From the National Renewable Energy Laboratory (NREL) News]

Program Selected Three Participants for Cohort 1

The Clean Energy Cybersecurity Accelerator™ (CECA)’s first cohort of solution providers—Blue Ridge Networks, Sierra Nevada Corporation, and Xage—recently began a technical assessment of their technologies that offer strong authentication solutions for distributed energy resources.

The selected solution providers will take part in a six-month acceleration period, where solutions will be evaluated in the Advanced Research on Integrated Energy Systems (ARIES) cyber range.

Working with its partners, CECA identified urgent security gaps, supporting emerging technologies as they build security into new technologies at the earliest stage—when security is most effective and efficient. The initiative is managed by the U.S. Department of Energy’s (DOE’s) National Renewable Energy Laboratory (NREL) and sponsored by DOE’s Office of Cybersecurity, Energy Security, and Emergency Response (CESER) and utility industry partners in collaboration with DOE’s Office of Energy Efficiency and Renewable Energy (EERE).

“We are thrilled to welcome and work with the first participants to the secure energy transformation,” said Jon White, director of NREL’s Cybersecurity Program Office. “These cyber-solution providers will work with NREL, using its world-class capabilities, to develop their ideas into real-world solutions. We are ready to build security into technologies at the early development stages when most effective and efficient.”

The selected innovators:

Blue Ridge Networks’ LinkGuard system “cloaks” critical information technology network operations from destructive and costly cyberattacks. The system overlays onto existing network infrastructure to secure network segments from external discovery or data exfiltration. Through a partnership with Schneider Electric, Blue Ridge Networks helped deploy a solution to protect supervisory control and data acquisition (SCADA) systems for the utility industry.

Sierra Nevada Corporation (SNC)’s Binary Armor® is used by the U.S. Department of Defense and utilities to protect critical assets, with the help of subject matter experts to deliver cyber solutions. SNC plans to integrate as a software solution into a communication gateway or other available edge processing to provide a scalable solution to enforce safe operation in an unauthenticated ecosystem. SNC currently helps secure heating, ventilation, and air conditioning systems; programmable logical controllers; and wildfire detection, with remote monitoring for two different utilities.

Xage uses identity-based access control to protect users, machines, apps, and data, at the edge and in the cloud, enforcing zero-trust access to secure operations and data universally. To test technology in energy sector environments, Xage provides zero-trust remote access, has demonstrated proofs of concept, and deploys local and remote access at various organizations.

Three major U.S. utilities, with more expected to join, are partners with CECA: Berkshire Hathaway Energy, Duke Energy and Xcel Energy. At the end of each cohort cycle, cyber innovators will present their solutions to the utilities with the goal to make an immediate impact.

Additionally, CECA participants benefit from access to NREL’s unique testing and evaluation capabilities, including its ARIES cyber range, developed with support from EERE. The ARIES cyber range provides one of the most advanced simulation environments with unparalleled real-time situational awareness and visualization to evaluate renewable energy system defenses.

Applications for the second CECA cohort will open in early January 2023 for providers offering solutions that uncover hidden risks due to incomplete system visibility and device security and configuration.

NREL is the U.S. Department of Energy’s primary national laboratory for renewable energy and energy efficiency research and development. NREL is operated for DOE by the Alliance for Sustainable Energy LLC.