World-Watching: Small Business and Food Waste: Not a Small Problem

[from APEC News]

by Aaron Sydor

Faced with a possible food crisis, economies must work together and take action on food waste … starting at the front line with MSMEs.

Conflict, supply disruption, rising prices, and shortages are all impacting food supplies globally. Just as we are nearing some form of recovery from the pandemic, we are now facing another global challenge in the form of a food crisis – and it’s likely to get worse.

The United Nations World Food Programme (WFP) tells us that 349 million people face acute food insecurity this year — an increase from 287 million people in 2021. It is a tragedy that when the world is “hungrier than ever,” as the WFP calls it, so much food goes to waste. One-third of food production, or 1.3 billion tons per year, goes to waste globally, according to the UN Food and Agriculture Organization. It is inconceivable, then, that we don’t make the most of the food that we have.

This is a regional problem that cannot be solved by individual economies acting on their own. It must be looked at with a wider lens, such as through bodies, like APEC, that promote regional economic cooperation. APEC members acknowledge that all areas of the agri-food value chain are interdependent and that there is a need for a whole-system approach.

Among the forum’s efforts to reduce food waste is the Food Security Roadmap Towards 2030 which aims to establish an open, fair, transparent, productive, sustainable and resilient APEC food system. This corresponds to the UN and other multilateral goals by taking action through the following avenues: digital transformation; productivity and international trade; sustainability; public-private partnerships; and inclusivity, especially in the inclusion of micro, small and medium enterprises (MSMEs) along the agri-food value chain.

For more on this topic, download “Enhancing Green MSMEs’ Competitiveness for a Sustainable and Inclusive Asia-Pacific: Food Sector Waste Reduction in Food Supply Chain.” [Archived PDF]

In my capacity as the Chair of APEC’s Small and Medium Enterprises Working Group, I’d like to stress the importance of the latter: inclusivity and small business. MSMEs account for over 97 percent of all business in APEC economies and employ over half of the workforce. Any strategy for reducing food wastage will have to involve the wholesale participation of the region’s smaller businesses.

This is easier written than done. For one thing, fit-for-purpose data is scarce. No APEC economy has food waste data that is specific to MSMEs. And while all have policies and measures to address the problem of food waste, there are no large-scale direct MSMEfood waste reduction targets, policies or plans. Few have tried to reduce MSME food waste in the retail food and food service industries. Supermarkets, food storage facilities or warehouses in many APEC economies aren’t required to donate excesses.

Most entrepreneurs aren’t even aware of the problem, or underestimate its true cost. Those who do understand have limited options or capital, and are unable to find cost-effective solutions to create value out of food waste, and face problems with logistics and transportation. On top of this, there are few to no regulatory frameworks to guide them. From a technology perspective, a majority of APEC economies utilize modern technologies, including mobile applications, to reduce or manage MSME food waste/surplus food, but these modern technologies are used only by large companies in big cities.

Amid these challenges are an abundance of opportunities to help MSMEs reduce food waste. Training, policies and guidelines can aid them in improving profits by reducing costs and increasing the value added of food. They can reduce their carbon footprint, which enhances consumer demand, and divert waste to new products or bioenergy.

A November study by the APEC Small and Medium Enterprises Working Group presents case studies, identifies the best available data on food waste for MSMEs, and identifies several best practices for economies in dealing with food waste through MSME policy.

In one section, the study’s authors analyze a case study of a successful MSME, and identify four key factors contributing to its successful reduction of food waste: 1) creating a network of people — e.g., a community surrounding a farm; 2) using innovation and technology to facilitate farming and save time; 3) producing knowledge and providing it through several channels — e.g., a learning and training center, friendly guide books; and 4) considering the environment at every step of the process.

The paper, called “Enhancing Green MSMEs’ Competitiveness for a Sustainable and Inclusive Asia-Pacific: Food Sector Waste Reduction in Food Supply Chain,” [Archived PDF] is extensive and easily doubles as a handbook for anyone interested in MSME food waste, or the problem of food waste in general. It is a great example of what can be achieved when economies combine knowledge and resources in the pursuit of keeping the region inclusive, prosperous, and fed.

Aaron Sydor is the Chair of the APEC Small and Medium Enterprises Working Group.

FRBSF Economic Letter: Can Monetary Policy Tame Rent Inflation?

[from the Federal Reserve Bank of San Francisco Economic Letter]

by Zheng Liu and Mollie Pepper

Rent inflation has surged since early 2021. Because the cost of housing is an important component of total U.S. consumer spending, high rent inflation has contributed to elevated levels of overall inflation. Evidence suggests that, as monetary policy tightening cools housing markets, it can also reduce rent inflation, although this tends to adjust relatively slowly. A policy tightening equivalent to a 1 percentage point increase in the federal funds rate could reduce rent inflation as much as 3.2 percentage points over 2½ years.

“We’ve had a time of red-hot housing market all over the country… Shelter inflation is going to remain high for some time. We’re looking for it to come down, but it’s not exactly clear when that will happen. Hope for the best, plan for the worst.”

Federal Reserve Chair Jerome Powell (2022)

The rapid run-up of shelter costs—both house prices and rents—during the recovery from the pandemic has raised questions about how inflation pressures might affect housing affordability. Since March 2022, the Federal Reserve has rapidly lifted its federal funds rate target from near zero to over 4%, and policymakers have signaled that they are open to keeping the monetary policy stance sufficiently restrictive to return inflation to the longer-run goal of 2% on average. The tightened financial conditions following those policy changes, especially the surge in mortgage interest rates, have helped cool house price growth. However, rent inflation remains elevated.

This Economic Letter examines the effectiveness of monetary policy tightening for reducing rent inflation. We estimate that, during the period from 1988 to 2019, a policy tightening equivalent to a 1 percentage point increase in the federal funds rate can reduce rent inflation—measured by 12-month percentage changes in the personal consumption expenditures (PCE) housing price index—by about 3.2 percentage points, but the full impact takes about 2½ years to materialize. Based on housing costs’ share in total PCE, this translates to a reduction in headline PCE inflation of about 0.5 percentage point over the same time horizon.

Rising housing costs

Following the COVID-19 recession, house prices and rents both surged in the United States. For example, the 12-month growth rate of Standard & Poor’s CoreLogic Case-Shiller Home Price Index accelerated from about 10% in December 2020 to over 20% in March 2022. After the Federal Reserve started raising the target for the federal funds rate in March, house price growth has slowed significantly, to about 9% in October 2022.

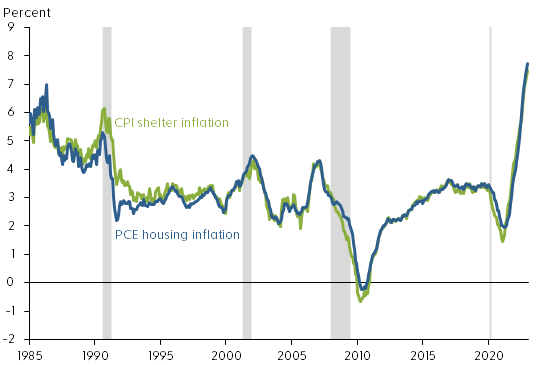
Rent inflation also accelerated during the pandemic period. Figure 1 shows that rent inflation—measured using 12-month changes in the PCE housing price index and including rents for tenant-occupied housing and imputed rents for owner-occupied housing—rose from a low point of about 2% in early 2021 to 7.7% by December 2022, the highest level since 1986. During the same period, rent inflation measured by 12-month changes in the shelter component of the consumer price index (CPI) experienced a similar increase. Thus, following the tightening of monetary policy, house price growth has slowed but rent inflation continues to rise.

Figure 1: PCE and CPI measures of rent inflation
Source: Bureau of Economic Analysis, Bureau of Labor Statistics, and Haver Analytics.
Note: Twelve-month percentage changes. Gray shading indicates NBER recession dates.

Economic theory suggests that some common forces such as changes in housing demand can drive both rents and house prices. For example, the expansion of remote work since the COVID-19 pandemic has increased demand for housing, raising both house prices and rents (Kmetz, Mondragon, and Wieland 2022). To the extent that the stream of current and future rents reflects the fundamental value of a house, house prices can be a leading indicator of future rent inflation (Lansing, Oliveira, and Shapiro 2022). Thus, monetary policy can affect both house prices and rents by cooling housing demand.

Housing demand responds to changes in financial conditions, such as increases in mortgage interest rates. However, theory suggests that house prices are more sensitive than rental prices to changes in financial conditions, because home purchases typically require longer-term mortgage financing. In addition, unlike rents, house prices can be partly driven by investor sentiments or beliefs, which explains the observed larger swings in house prices than in rents over business cycles (Dong et al. 2022). Long-term rental contracts can also contribute to slow adjustments in rent inflation.

Rent inflation is an important contributor to overall inflation because housing costs are an important component of total consumption expenditures. On average, housing expenditures represent about 15% of total PCE and 25% of the services component of PCE. In CPI, shelter costs represent an even larger share, accounting for about 30% of total consumption of all urban consumers and about 40% of core consumption expenditures excluding volatile food and energy components.

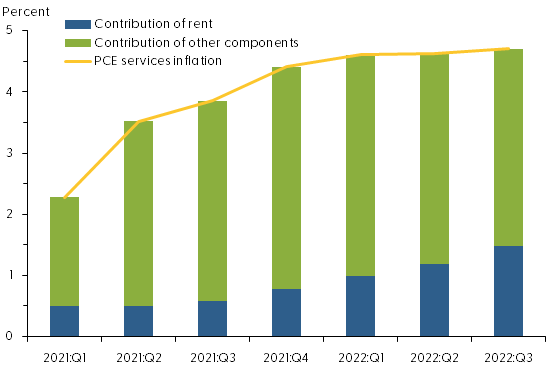
The contribution of rent inflation to overall PCE inflation has increased since early 2021. As Figure 2 shows, in the first quarter of 2021, rent inflation accounted for about 22% of the four-quarter change in the PCE services price index, excluding energy: 0.5 of the 2.3 percentage points increase in service prices was attributable to rent inflation. By the third quarter of 2022, the contribution of rent inflation had climbed to about one-third, or 1.5 of the 4.7 percentage point increase in service prices.

Figure 2: Rising contribution of rent inflation to services inflation
Source: Bureau of Economic Analysis, Haver Analytics, and authors’ calculations.
Note: Four-quarter changes in PCE services price index excluding energy.

Measuring policy effects

Given the rising contribution of rent inflation to overall inflation, it is important to assess the quantitative effects of monetary policy tightening on rent inflation.

For our analysis, we use a measure of monetary policy surprises constructed by Bauer and Swanson (2022). Their measure focuses on high-frequency changes in financial market indicators within a short period surrounding the Federal Open Market Committee (FOMC) policy announcements. If the public fully anticipates a policy change, then the financial market would not react to new policy announcements. However, if the market does react to an announcement, then the policy change must contain a surprise element. Thus, changes in financial market indicators, such as the price of Eurodollar futures, in a narrow window around an FOMC announcement can capture policy surprises. In practice, however, the data constructed this way are not complete surprises because they can be predicted by some macro and financial variables shortly before FOMC announcements. We follow the approach of Bauer and Swanson (2022) to purge the influences of those macro and financial variables from the measure of policy surprises. We use the resulting quarterly time series to measure monetary policy shocks, with a sample period from 1988 to 2019.

We then use a local projections model—a statistical tool proposed by Jordà (2005)—to project how rent inflation responds over time to a tightening of monetary policy equivalent to a 1 percentage point unanticipated increase in the federal funds rate in a given quarter. The model takes into account how monetary policy shocks interact with other macroeconomic variables, including lags of rent inflation, real GDP growth, and core PCE inflation.

In the final step, we compute the responses of rent inflation relative to its preshock level over a period up to 20 quarters after the initial increase in the federal funds rate.

Gradual impact of policy tightening on rent inflation

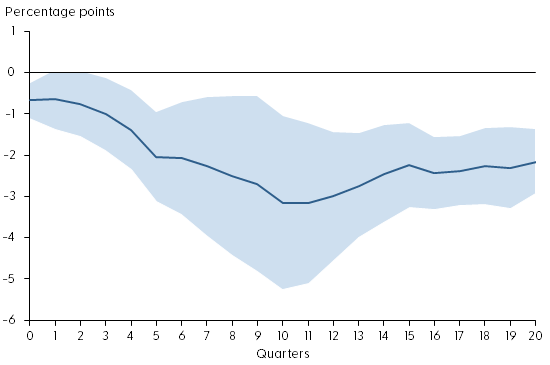
Figure 3 shows the response of rent inflation during the first 20 quarters after an unanticipated tightening of monetary policy (solid blue line). The shaded area shows the confidence band, indicating the statistical uncertainty in estimating the responses. Under the assumption that the model is correct, the shaded area contains the actual value of the rent inflation responses to the monetary policy shock roughly two-thirds of the time. The policy shock is normalized such that it is equivalent to a 1 percentage point unanticipated increase in the federal funds rate.

Figure 3: Response of rent inflation to monetary policy tightening
Source: Bureau of Economic Analysis, Bauer and Swanson (2022), and authors’ calculations.
Note: Response of rent inflation to a monetary policy shock equivalent to a 1 percentage point surprise increase in the federal funds rate. Shaded region shows 68% confidence band around the estimate.

The figure shows that monetary policy tightening has significant and gradual effects on rent inflation. On impact, a 1 percentage point increase in the federal funds rate reduces rent inflation about 0.6 percentage point relative to its preshock level. Over time, rent inflation declines gradually, falling about 3.2 percentage points in the 10 quarters following the impact. The slow adjustment in rent inflation partly reflects the stickiness in nominal rents due to long-term rental contracts. Since housing expenditures account for about 15% of total PCE, this estimate translates to a reduction in headline PCE inflation of about 0.5 percentage point, stemming from the decline in rent inflation over a period of 2½ years.

The rent component of PCE is measured based on average rents, including those locked in long-term rental contracts, which are slow to adjust to changes in economic and financial conditions. Rents on new leases, however, are more flexible. For example, the 12-month growth in Zillow’s observed rent index, which measures changes in asking rents on new leases, has slowed significantly since March 2022 (see Figure 4). Asking rents are typically a leading indicator of future average rents. Thus, the slowdown in asking rent growth could portend lower future rent inflation.

Figure 4: Year-over-year observed rent growth starting to slow
Source: Zillow and Haver Analytics.
Note: Twelve-month percentage changes in Zillow’s observed rent index. Gray shading indicates NBER recession dates.

Conclusion

Rents are an important component of consumer expenditures. Recent surges in rent inflation have led to concerns that overall inflation might stay persistently high despite tightening of monetary policy. We present evidence that monetary policy tightening is effective for reducing rent inflation, although the full impact takes time to materialize. A policy tightening equivalent to a 1 percentage point increase in the federal funds rate can reduce rent inflation up to 3.2 percentage points over the course of 2½ years. This translates to a maximum reduction in headline PCE inflation of about 0.5 percentage point over the same time horizon. Although average rents are slow to respond to policy changes, growth of asking rents on new leases has started to slow following recent monetary policy tightening. Our finding suggests that this tightening will gradually bring rent inflation down over time, thereby helping to reduce overall inflation.

Zheng Liu — Vice President and Director of the Center for Pacific Basin Studies, Economic Research Department, Federal Reserve Bank of San Francisco

Mollie Pepper — Research Associate, Economic Research Department, Federal Reserve Bank of San Francisco

[Archived PDF]

Economics-Watching: FedViews for January 2023

[from the Federal Reserve Bank of San Francisco]

Adam Shapiro, vice president at the Federal Reserve Bank of San Francisco, stated his views on the current economy and the outlook as of January 12, 2023.

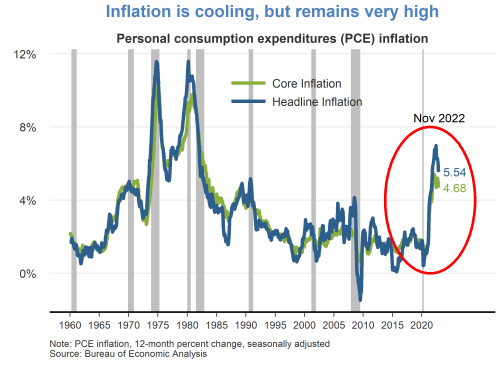
  • While continuing to cool over the last several months, 12-month inflation remains at historically high levels. The headline personal consumption expenditures (PCE) price index rose 5.5% in November 2022 from a year earlier. This marks a decline in inflation to a level last observed in October 2021, but still well above the Fed’s longer-run goal of 2%. A portion of the inflation moderation is attributable to recent declines in energy prices. Core PCE inflation, which removes food and energy prices, has shown less easing.
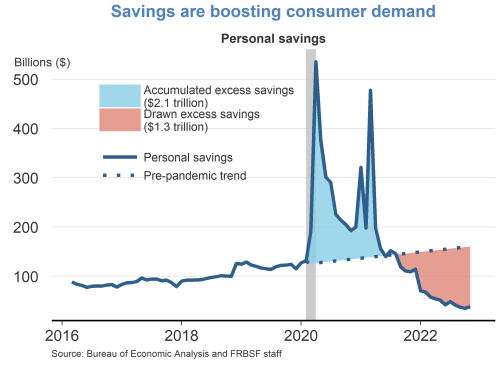
  • Owing to fiscal relief efforts and lower household spending over the course of the pandemic, consumers accumulated over $2 trillion dollars in excess savings, based on pre-pandemic trends. Since then, consumers have drawn down over half of this excess savings which has helped support recent growth in personal consumption expenditures. A considerable amount of accumulated savings remains for some consumers to support spending in 2023.
  • In the wake of the pandemic, consumer spending patterns shifted away from services towards goods. While there appears to be some normalization of spending behavior, this shift has generally persisted. Real goods spending remains significantly above its pre-pandemic trend, driven by strong demand for durables such as furniture, electronics, and recreational goods. Spending on services has shown a resurgence but remains below its pre-pandemic trend.
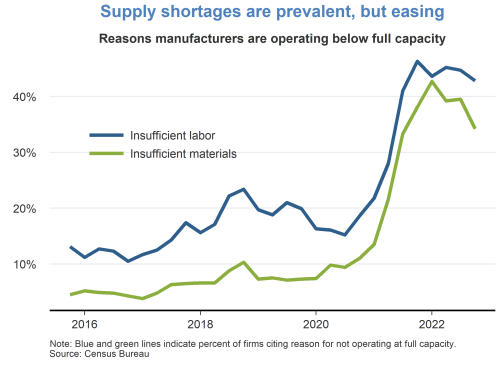
  • Supply chain bottlenecks for materials and labor remain a constraint on production, although there are some recent signs of easing. The fraction of manufacturers who reported operating below capacity due to insufficient materials peaked in late 2021 and has moderately declined over the past year. However, the fraction of manufacturers reporting insufficient labor has persisted at high levels.
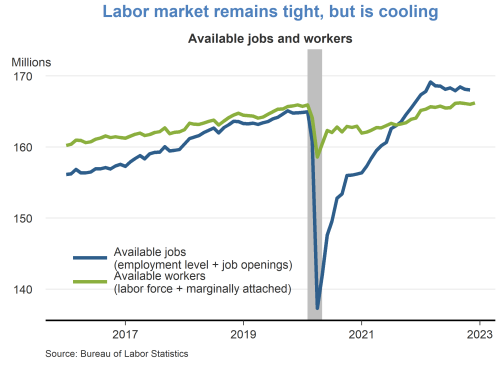
  • The labor market remains tight, despite some signs of cooling. The number of available jobs remains well above the number of available workers, although vacancy postings have been trending down in recent months. The tight labor market has put continued upward pressure on wages and labor market turnover.
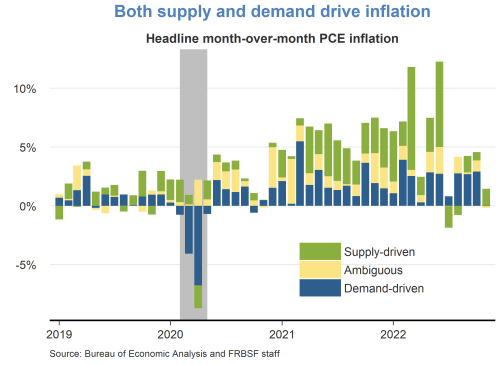
  • A decomposition of headline PCE inflation into supply– and demand-driven components shows that both supply and demand factors are responsible for the recent rise in inflation. The surge in inflation in early 2021 was mainly due to an increase in demand-driven factors. Subsequently, supply factors became more prevalent for the remainder of 2021. Supply-driven inflation has moderated significantly over recent months, while demand-driven inflation remains elevated.
  • The Federal Open Market Committee (FOMC) raised the federal funds rate by 50 basis points at the December meeting to a range of 4.25 to 4.5%. This cycle of continued rate increases since March of last year represents the fastest pace of monetary policy tightening in 40 years. The increase in the federal funds rate has been accompanied by a gradual reduction in the size of the Federal Reserve’s balance sheet.
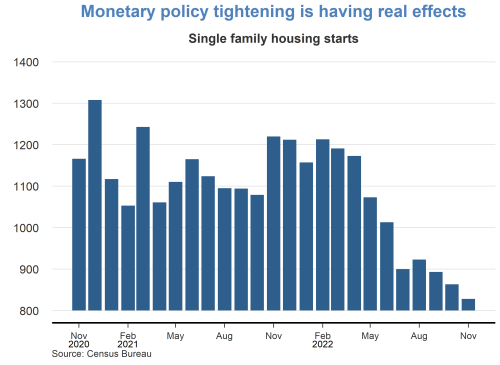
  • Economic activity in sectors such as housing, which is sensitive to rising interest rates, has slowed considerably in recent months. Housing starts have fallen steadily over the past year, as have other housing market indicators, such as existing home sales and house prices.
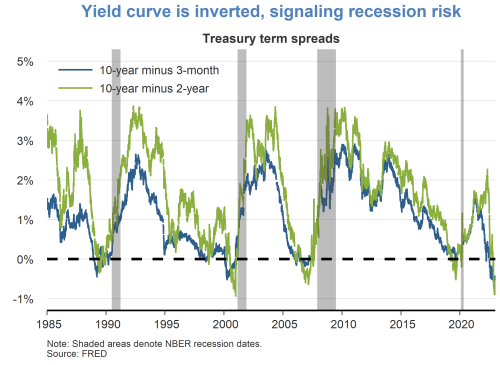
  • Although the labor market is currently very strong, financial markets are pointing to some downside risks. Namely, the difference between longer- and shorter-term interest rates has turned negative, which historically tends to occur immediately preceding recessions. It remains unclear whether lower longer-term yields are indicative of anticipated slower growth or lower inflation.
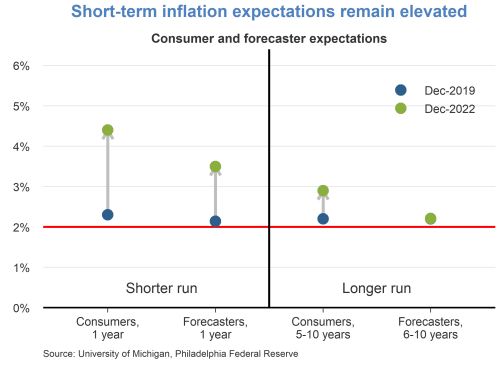
  • Short-term inflation expectations remain elevated relative to their pre-pandemic levels in December 2019. Consumers are expecting prices to rise 5% this year, while professional forecasters are expecting prices to rise 3.5%. Longer-term inflation expectations remain more subdued, indicating that both consumers and professionals believe inflation pressures will eventually dissipate.
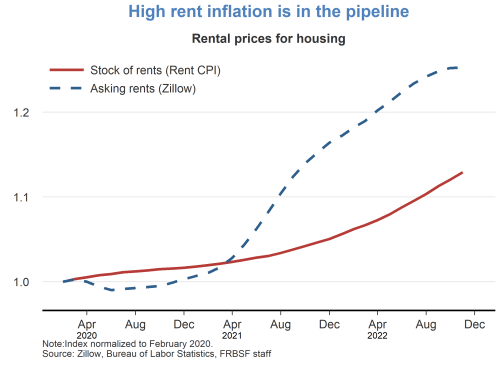
  • Rent inflation is expected to remain high over the next year. The prices for asking rents have grown quite substantially over the last two years. As new leases begin and existing leases are renewed, these higher asking rents will flow into the stock of rental units, putting upward pressure on rent inflation.
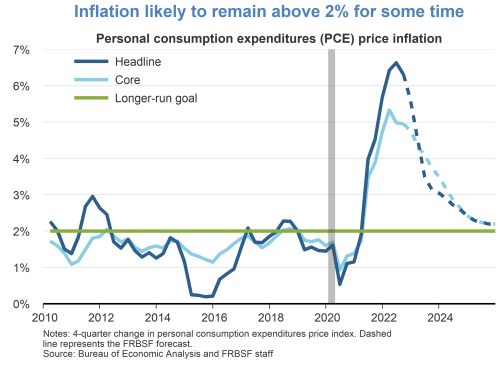
  • We are expecting inflation to moderate over the next few years as monetary policy continues to restrain demand and supply bottlenecks continue to ease. We anticipate that it will take some time for inflation to reach the Fed’s longer-run goal of 2%.
Inflation is cooling, but remains very high
Savings are boosting consumer demand
Goods consumption remains elevated
Supply shortages are prevalent, but easing
Labor market remains tight, but is cooling
Both supply and demand drive inflation
Monetary policy tightening is having real effects
Yield curve is inverted, signaling recession risk
Short-term inflation expectations remain elevated
High rent inflation is in the pipeline
Inflation likely to remain above 2% for some time

[Archived PDF]

Read other issues from FedViews.

Russia-Watching: Economic Dysfunctionalities

[from the Russian Analytical Digest]

This issue deals with dysfunctionalities in the Russian economy. The first three contributions look at the direct impact of sanctions. Ilya Matveev provides an overview, while Andrei Yakovlev compares the government’s anti-sanctions measures to its reaction to the economic impact of the COVID-19 pandemic. Janis Kluge offers a more detailed picture of the short- and long-term effects of the unfolding sanction regime. Michael Rochlitz then goes on to explain the lack of strategic planning in the country’s economic policy. Finally, Olga Masyutina and Ekaterina Paustyan provide a case study of inefficient governance mechanisms looking at waste management.

Read the full issue [archived PDF].

Analyses

Sanctions against Russia: No Blitzkrieg, but a Devastating Effect Nonetheless

by Ilya Matveev

In response to the Russian invasion of Ukraine, over 40 countries have introduced sanctions against Russia. The new restrictions concern finance, trade, logistics, and personal sanctions against businessmen and officials. In addition, more than 1,000 companies have ceased or limited their activities in Russia. In this article, Ilya Matveev argues that the sanctions, despite their unprecedented scale, have not led to the collapse of the Russian economy, yet their effect is dramatic, multi-faceted, and will increase over time.

Read the full issue [archived PDF].

Fighting the Pandemic and Fighting Sanctions: Can the Russian Economy Now Benefit from Its Experience with Anti-Crisis Measures?

by Andrei Yakovlev

Faced with tough international sanctions in reaction to its war against Ukraine, the Russian government has resorted to measures developed during the COVID-19 pandemic in order to stabilize the economy. This short analysis discusses the rationale behind this approach and demonstrates its limits.

Read the full issue [archived PDF].

Russia’s Economy under Sanctions: Early Impact and Long-Term Outlook

by Janis Kluge

Four months after a coalition of Western states imposed unprecedented sanctions on Russia, the Russian economy seems to be holding up better than expected. The Central Bank has managed to stabilize the country’s financial system and Russian officials are trying to project optimism about the future. However, this optimism is likely to be short-lived. The sanctions’ effects are only just beginning to unfold: supply-chain problems are intensifying and demand is falling quickly. In the longer run, Russia’s economy will become more primitive as it partially decouples from international trade. To avoid social tensions, the government will intervene to support Russian businesses, leading to more protectionism and a larger state footprint in the economy.

Read the full issue [archived PDF].

Why Russia Is Lacking an Economic Strategy for the Future

by Michael Rochlitz

Even before the economic crisis caused by Russia’s full-scale attack against Ukraine and the ensuing sanctions, the Russian economy was plagued by a number of growing problems. As a result, Russia’s economy has hardly grown for almost a decade, with an average annual growth rate of just 0.5% between 2013 and 2021. However, the Russian government does not have a strategy for addressing the fundamental economic challenges that are looming just over the horizon. There also seem to be no public debates about these challenges, whether in the policy circles around the government or among the wider public.

Read the full issue [archived PDF].

The Political Economy of Waste Management in Russia

by Olga Masyutina and Ekaterina Paustyan

The problem of household waste is one of the numerous environmental challenges facing Russia today. The 2019 nation-wide waste management reform was designed to tackle this problem by promoting recycling. However, the reform is stalling, due in large part to the nature of state-business relations in Russia. The lack of transparency in the public procurement process and the importance of personal connections between businesses and the federal and regional authorities undermine the implementation of the reform and produce suboptimal outcomes in the fight against waste.

Read the full issue [archived PDF].

EconoSpeak: Tariffs and Inflation

[from EconoSpeak, posted by Kevin Quinn]

Jason Furman and Janet Yellen have both suggested that cutting Trump’s tariffs would  be anti-inflationary. But most economists agree that the incidence of the tariffs is for the most part on U.S. consumers, not foreign suppliers (pace the treasonous and ignorant former president, who crowed about all the revenues we were raising from China). So how is a tax cut anti-inflationary?  There is a supply-side effect, which is all to the good, but the demand-side effects may well wash that out. So get rid of the tariffs but reverse the Trump tax cuts, which Manchin favors, through reconciliation. Taxes remain the same, so we’ve neutralized the effects on demand; and we still get the good supply side effects of a more rational global division of labor.

Shipping and the World

[from Seatrade Maritime News]

Asyad Dry Dock Expanding Capacity As Demand Grows

Oman shipyard Asyad Dry Dock is expanding its capacity by 20% with a new floating dock as its current facilities are fully utilized.

by Marcus Hand

The shipyard, formerly Oman Drydock Company, is now part of the Asyad Group, the logistics arm of the Oman government. Management of the yard has been combined with shipowner Oman Shipping Company, and overseen by Dr. Irbahim Al Nadhairi, Chief Executive Officer, Shipping & Drydock.

“We have integrated the shipping and drydocking as the shipping service. The companies are still two legal separate entities but then we share the same executive team to be more efficient,” Dr. Ibrahim told Seatrade Maritime News in an interview at Posidonia 2022.

On the shipping side of the business the group owns a fleet of 65 ships with plans to increase the fleet to over 100 vessels over the next five years. He explains that with such a size of fleet the shipowner needed a quality shipyard so it made sense to work together.

Asyad maintains most, if not all its fleet at the shipyard in Oman, accounting for around 15% of its business. While part of the same group Dr. Ibrahim says it does not send its ships to the yard “by default,” and they have to make sure it is competitive as it needs to be for their third-party customers.

Business has been growing for the shipyard and it experienced a spike in the first half of this year as Chinese capacity has been taken out of the market by COVID restrictions pushing work to yards in other parts of the world. “So, we could see there was a big hike in the number of ships, not only for Asyad Dry Dock, but the entire region as well,” Dr. Ibrahim said.

“The next 12 months I believe the ship repair industry will still continue to flourish on our side.”

The shipyard’s two 600,000 DWT drydocks are already operating at full capacity and this year sees it adding a floating dock with the capacity to handle vessels up to Panamax size.

“We’ve recently acquired a floating dock which is of Panamax size and we reckon that about 40% of the business in ship repair is within that Panamax size. The floating dock gives us around 20% extra capacity,” he said. It will increase the number of ships the yard can repair from 200 to around 240.

The floating dock is expected to arrive in Oman in the next six weeks, and following some dredging works be operational by the start of Q4 this year.

Greek owners are major clients of the shipyard and account for around 40% of business, and Dr. Ibrahim said they added two more Greek clients last week. “It seems we have a good reputation in the Greek market and between now and end of Q3 we have 27 ships in orderbook from the Greek market.”

Globally its customer base includes MSC, AP Møller-Mærsk, CMA CGM S.A., Hapag-Lloyd, and Mitsui OSK Lines (株式会社商船三井). Maersk currently has currently two vessels in the yard.

Being able to deliver services efficiently and on time is of critical importance in the financially booming container sector.

“Today when you talk about bringing a container ship into a shipyard time really is money,” Dr. Ibrahim said. If a container ship owner says a ship will be in the yard for 15 days the owner will expect work to be completed in 12 days.

‘Further Action Is Needed’ As MEPC 78 Gets Underway

IMO Secretary General Kitack Lim hailed the 78th session of the Marine Environment Protection Committee as an opportunity to be brave and lead by example on decarbonization.

by Gary Howard

MEPC 78 has a packed agenda with the opportunity to consider and progress IMO’s work on cutting greenhouse gas emissions from ships.

At the last MEPC meeting, a revision process was agreed to strengthen the IMO’s initial GHG strategy which was adopted in 2018. A strengthened version of that initial strategy is due in mid-2023 at MEPC 80.

Speaking to Seatrade Maritime News in May, Stamatis Fradelos, Vice President, Regulatory Affairs at ABS said that important influencers in the IMO like the United States, EU, Canada, Japan, Australia and New Zealand are calling for net zero emissions from shipping by 2050 and introducing a level of ambition for 2040.

“Whilst progress has been made on many of the measures set out in the Initial Strategy, I am sure that we can all agree that further action is needed. Your discussions this week will chart the way forward for the decarbonization of international shipping,” said Lim.

“It is therefore of utmost importance that IMO continues to deliver concrete progress in transitioning international shipping from fossil fuels to low and zero-carbon alternatives.”

Member states at MEPC 78 will also consider adoption of guidelines to support short-term measures on GHG emissions, including correction factors for carbon intensity, EEXI calculation methodology and revised SEEMP.

Calculations on the GHG impact of fuels will be discussed, as ISWG-GHG 11 reports progress on developing lifecycle GHG assessment guidelines. Well-to-wake and tank-to-wake calculations are in scope, with the aim of giving fuel users a full picture of the impact of the production and use of the fuels they choose.

“Your constructive discussions on these topics will enhance the Committee’s evidence-based decision making when further considering proposals for mid-term GHG reduction measures,” Lim told Member States.

“I would like to take this opportunity to express my deepest appreciation to all Member States, and observer delegations, and especially the Chair of the Working Group on reduction of GHG emissions from ships, Mr. Oftedal of Norway, for the extraordinary effort and dedication in ensuring the successful outcome of both intersessional meetings.”

Houston Begins $1.1Bn Ship Channel Widening

The Port of Houston kicked off its the long-awaited billion dollar dredging scheme, the Houston Ship Channel Widening and Improvement Project 11 last week.

by Michele Labrut

The $1.1bn expansion of the Houston Ship Channel, which has been in planning for more than a decade is finally underway.

After more than a decade of planning, Project 11 will allow the ship channel to accommodate an additional 1,400 vessels per year and could generate up to $134bn more annually in economic impact once completed. The channel currently accommodates about 8,200 vessels and 215,000 barges each year, hauling more than 247m tons of cargo.

“This project will enable Port of Houston to continue to grow and respond effectively to whatever the future demand in the supply chain has to offer,” Port of Houston Executive Director Roger Guenther said in a statement.

Port of Houston is a 40-2 km-long complex of nearly 200 private and public industrial terminals along the 583.6 km-long manmade Houston Ship Channel, which connects the port to the Gulf of Mexico.

Project 11 will widen the Houston Ship Channel by 51.8 m along its 41.8 km Galveston Bay reach, to 213.3 m wide. It will also deepen upstream segments from a current depth of 13.7 m to a depth of 14.7 m. Dredging began last week. The Houston Ship Channel winds from the Gulf of Mexico through shallow Galveston Bay and up through the port.

“This project is important on many levels, including improving the efficiency of our nation’s supply chains, promoting navigational safety, and creating environmental benefits through the innovative use of dredged material,” Michael Conner, Assistant Secretary of the Army (Civil Works), said in a statement.

Port of Houston and the Army Corps of Engineers signed an agreement in August giving the port permits to start dredging the federal waterway. Great Lakes Dredge and Dock Co. was awarded a $95m contract in October, which also includes oyster mitigation and construction of a bird island. The channel widening and deepening project is scheduled to be completed in 2025.

EU Transport Commissioner Focuses on ‘Solidarity Lanes’ and Sanctions

As the global food crisis deepens and millions of tons of Ukraine’s grain remain blocked in the Black Sea, EU Transport Commissioner Adina-Ioana Vălean has declared that all transport modes will be considered in setting up new Solidarity Lanes that bypass the Black Sea.

by Paul Bartlett

Her comments come as disrupted grain movements risk a global food crisis.

Speaking to journalists immediately prior to yesterday’s opening ceremony at Posidonia, she said that trucks, tracks, trains, transshipment and storage facilities will all contribute to new supply chains to ensure that exports from one of the world’s largest grain exporters can resume, at least in part, as soon as possible.

She said that the setting up of Solidarity Lanes would have important commercial implications for shipping and could even lead to changes in the sector’s business models

Vălean also rejected criticism from prominent Greek shipowners who had claimed earlier in the day that sanctions imposed on Russia in the wake of its invasion on Ukraine won’t work. At a Maritime Leaders Summit staged by Capital Link on Monday, George Prokopiou and Evangelos Marinakis had both said that sanctions against Iran and Venezuela had been shown not to work and similar moves against Russia would not be effective either.

However, other sources pointed to the scale of the sanctions package that has severely impacted the Russian economy by disrupting key revenue generating sectors. Energy exports are the most obvious example and although Russian oil is still easily sold in India and China, for example, it is at deep discounts to global prices.

Meanwhile, LNG exports have also been hit and development of Arctic LNG supply chains have also been severely affected. Within the next few months, Vălean said that Russian oil exports would be further disrupted by the withdrawal of insurance cover on shipping and transport arrangements.

Education and Seeing the “Swirl” of History

The tempo and rhythm of world events and world history are not captured in the linear and bland books one reads in schools and colleges where the sense of the stormy forward turbulence of the world is not communicated. Here’s an example that does communicate this “crazy dynamics”:

The leading historian, James Joll, in his excellent Europe Since 1870: An International History talks about gold and the gold standard in this way:

“The world supply of gold was diminishing, as the effects of the gold rushes in California and Australia in the 1850s and 1860s passed. This coincided with the decision in the 1870s of many of the leading countries to follow Britain’s example to use gold rather than silver as the basis of their currencyGermany in 1871, France in 1876 for example — so that the demand for gold rose just as the supply was temporarily declining. This in turn led to some doubt about the use of a gold standard and to much discussion about ‘bi-metallism’ and about the possibility of restoring silver to its place as the metal on which the world’s currency should be based, though this movement had more success in the United States than in Europe, where gold has now established itself firmly. By the 1890s however the discovery of new gold deposits in South Africa, Western Australia and Canada put an end to these discussions and uncertainties, as far as currency was concerned, for some fifty years.”

(James Joll, Europe Since 1870: An International History, Penguin Books, 1976, page 35)

These twists and turns and accidents or contingencies don’t communicate the real semi-turmoil surrounding all the decisions, which we can infer from the comment by a German politician in 1871, “We chose gold, not because gold was gold, but because Britain was Britain.” (Ian Patrick Austin, Common Foundations of American and East Asian Modernisation: From Alexander Hamilton to Junichero Koizumi, Select Publishing, 2009, page 99.)

Professor Joll delineates the emergent primacy of England:

“The establishment of London as the most important center in the world for shipping, banking, insurance-broking and buying and selling generally, as well as the growth of British industry, had been based on a policy of free trade.”

(James Joll, Europe Since 1870: An International History, Penguin Books, 1976, page 34)

The gold standard itself, dominated from London led to intricate problems: Golden Fetters: The Gold Standard and the Great Depression, 1919-1939 (published in 1992) by Barry Eichengreen, the leading historian of monetary systems, shows the downstream pitfalls of the gold standard.

In other words, the de facto emergence of Britain/London as the world commercial and policy center and the relation of this emergence to empire and international tensions and rivalries, means it is very problematical for any country to steer a course other than staying in tandem with British moods and ideologies, such as free trade. Any country by itself would find it difficult to have a more independent policy. (Friedrich List of Germany, who died in 1846, wrestles with these difficulties somewhat.) The attempts to find “autonomy and autarky” in the interwar years (Germany, Japan, Italy) led to worse nightmares. The world seems like a “no exit” arena of ideologies and rivalries.

The “crazy dynamics” and the semi-anarchy of the system, which continues to this day and is even worse, means that policy-making is always seen through a “dark windshield.”

History in the globalizing capitalist centuries, the nineteenth and the twentieth, is a kind of turbulent swirl and not a rational “walk.”

India-Watching

ICRIER Working Paper № 407

India’s Platform Economy and Emerging Regulatory Challenges

by Rajat Kathuria, Mansi Kedia and Kaushambi Bagchi

Abstract

The phenomenal rise of the platform economy has reshaped how economies operate across the world. The importance of digital platforms has never been more evident than in combatting the ongoing coronavirus (COVID-19) pandemic. Even with the threat of a global recession looming large, technology companies are witnessing a surge in demand for their services. Platforms distinguish themselves from traditional markets by demonstrating speed and scale of innovation and fostering efficient and productive interaction between buyers and sellers. Enterprises using platform-based business models have expanded beyond social media, travel and entertainment to sectors like financial services, healthcare, logistics and transportation. With the objective of building evidence for policy-making in this sector, this study undertakes an in-depth analysis of the impact generated by the platform economy in India, by estimating consumer surplus from the use of platforms, analyzing its impact on traditional businesses either by transformation or disruption. The estimated consumer surplus is Rs. 438.75 per individual per month, amounting to a collective annual surplus of Rs. 3620 billion for India. At current exchange rates this would amount to $47 billion. 

The growth of platforms has also been accompanied by global concern against their anti-competitive practices, the spread of fake news and harmful content, political bias, etc. The paper discusses regulatory changes and areas of concern for market competition, labour and employment, fake news and misinformation, consumer protection, counterfeit goods and data privacy in India.

[Read full article, archived PDF]

[Executive summary, archived PDF]