Following the inflationary surge from 2021 to 2023, which was touched off by supply chain constraints and shipping bottlenecks, we evaluate a new panel of own-firm price and unit cost growth expectations in the Atlanta Fed’s Survey of Business Uncertainty for signs that the anticipated impact from tariffs is broadening beyond directly affected firms. We find evidence for the potential of tariffs to touch off another bout of high inflation. First, firms that are directly exposed to tariffs have increased their year-ahead price growth expectations sharply (by 0.7 percentage points). Second, firms that are not directly exposed to tariffs but are operating in industries that are highly exposed to tariffs anticipate a moderately higher trajectory for year-ahead price growth (0.3 percentage points). Third, this broadening of overall price pressures—a key feature of the pandemic-era inflationary impulse—is only partially offset by lower price increases from tariff-exposed firms that are operating largely in industries not exposed to tariffs.
Key Findings
Firms, en masse, have increased their year-ahead price growth expectations since the end of 2024. This is especially true for firms directly exposed to tariffs.
We find evidence of a broadening out of the influence of tariffs beyond those directly exposed. Unexposed firms in exposed industries anticipate a moderately higher trajectory of year-ahead price growth.
The broadening of anticipated price growth is only partially offset by lower price growth expectations among tariff-exposed firms that are operating in largely unexposed industries.
by Hamza Abdelrahman, Luiz Edgard Oliveira and Aditi Poduri
Information the San Francisco Fed collects from businesses and community sources for the Beige Book provides timely insights into economic activity at both the national and regional levels. Two new indexes based on Beige Book questionnaire responses track business sentiment across the western United States. The indexes track data on economic activity and inflation, serving as early indicators of official data releases and helping improve near-term forecasting accuracy. The latest index readings suggest weakening economic growth and intensifying inflationary pressures over the coming months.
This Economic Letter examines the economic information collected through the SF Fed’s Beige Book questionnaire over the past 10-plus years. We analyze this information by constructing sentiment indexes from the qualitative data and comparing them with quantitative measures of national and regional economic activity and inflation. We introduce two indexes—the SF Fed Business Sentiment Index and the SF Fed Inflation Gauge Index—which track our contacts’ views and expectations for economic growth and inflation, respectively. We find that these new indexes serve as reliable early indicators of official data releases and help improve near-term forecast accuracy. The SF Fed Business Sentiment Index has generally exhibited patterns similar to other recent business and household sentiment indexes, and the SF Fed Inflation Gauge Index has shown a strong uptick in expected inflation. To regularly monitor changes in these two indexes, the San Francisco Fed has launched a new Twelfth District Business Sentiment data page.
Constructing regional sentiment indexes
The San Francisco Fed sends out a Beige Book questionnaire to business and community contacts across the District eight times a year to gather regional information. In addition to answering questions regarding their organizations, respondents share their views on regional and national topics, including economic activity and inflationary pressures.
In two questions, respondents indicate whether they see national output growth and inflation rates increasing, decreasing, or staying stable over the coming year using a standard five-tiered scale. We use these responses since 2014 to formulate two business sentiment indexes, one on economic activity and another on inflation. We assign standard weights to the five-tiered qualitative scale that are symmetrical around zero. For example, we ask if activity is expected to “decrease significantly” = –2, “decrease” = –1, “remain unchanged” = 0, “increase” = 1, or “increase significantly” = 2. We add up the weighted shares of responses for each tier within each index. We then normalize each resulting series by its own average and standard deviation for ease of comparison with traditional economic indicators.
Tracking business sentiment
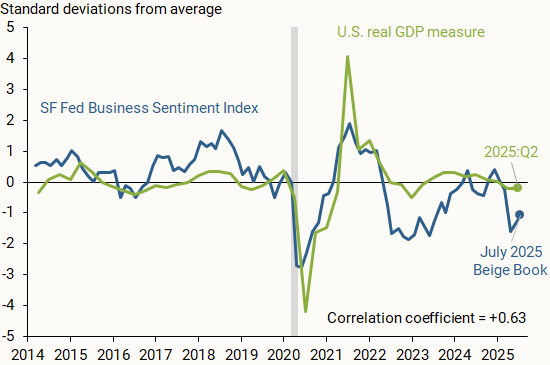
Figure 1 shows how the SF Fed Business Sentiment Index (blue line), compiled from responses to the question on national economic activity, compares with data on changes in national GDP (green line). We measure national output as the four-quarter change in inflation-adjusted, or real, GDP, normalized by its average and standard deviation so that it is centered around zero and, hence, more directly comparable to the SF Fed Business Sentiment Index. The vertical axis shows how many standard deviations away each observation is from its respective measure’s average from 2014 to mid-2025.
Figure 1 Economic growth versus business sentiment
The SF Fed Business Sentiment Index generally tracks the movements in national GDP over the past decade; a correlation coefficient of +0.63 on a scale of –1 to 1 indicates a moderately strong positive relationship between the two measures. A relatively recent exception started in 2022, when our index began showing a considerable decline relative to the national GDP measure. Respondents across the District were downbeat about economic growth and reported expectations of a sharp decline in consumer spending and overall household financial health following the depletion of pandemic-era savings (Abdelrahman and Oliveira 2023). A similar decline appeared in other measures of business and household sentiment. Nevertheless, overall economic growth continued at a solid pace. This decoupling between sentiment and hard data that began in 2022 was dubbed a “vibecession” (Daly 2024, Scanlon 2022).
Another possible reason for the divergence between national real GDP and our Business Sentiment Index is the influence of the regional economy. Although respondents are asked about their views of national GDP, their responses may be affected by regional outcomes. Thus, our index may also reflect a regional perspective from our business and community contacts.
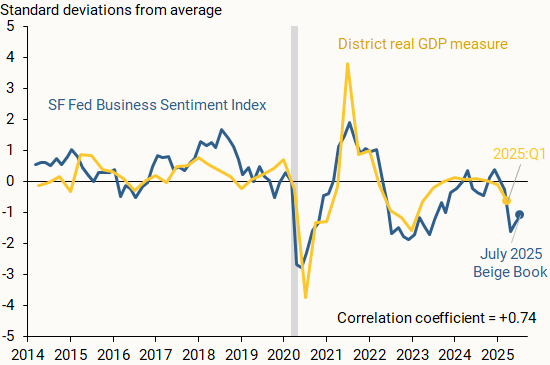
Figure 2 supports this rationale, showing the SF Fed Business Sentiment Index alongside a measure of regional output growth (gold line). We find that the measures closely track one another, including for 2022 and 2023, with a correlation coefficient of +0.74. We define District real GDP growth as the year-over-year percent change in the total output of the District’s nine states as reported by the Bureau of Economic Analysis (BEA). We normalize the series as described before.
Figure 2 Regional economic growth and business sentiment
Our findings indicate that the SF Fed Business Sentiment Index can serve as an accurate early indicator for national and regional output growth. Since the regional Beige Book questionnaire is collected twice each quarter, it provides particularly timely insights into economic activity during the current quarter. By contrast, the first GDP data release for any given quarter usually arrives a full month after that quarter has ended, and initial data releases for state-level output growth arrive with even more delay.
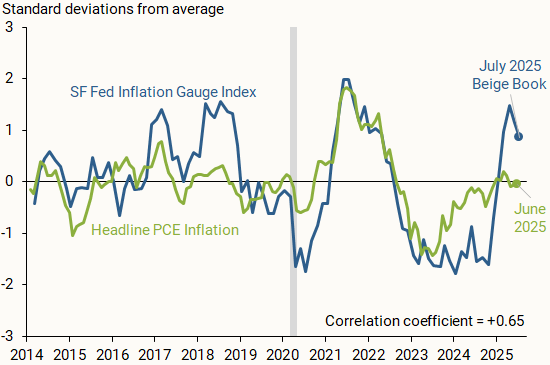
Our Beige Book questionnaire responses also provide insights into how business and community contacts in the District see national inflation evolving. Figure 3 compares the SF Fed Inflation Gauge Index (blue line) with monthly changes in the year-over-year headline personal consumption expenditures (PCE) inflation rate published by the BEA (green line). We normalize the inflation series and index as discussed earlier.
Figure 3 SF Fed Inflation Gauge Index versus realized inflation
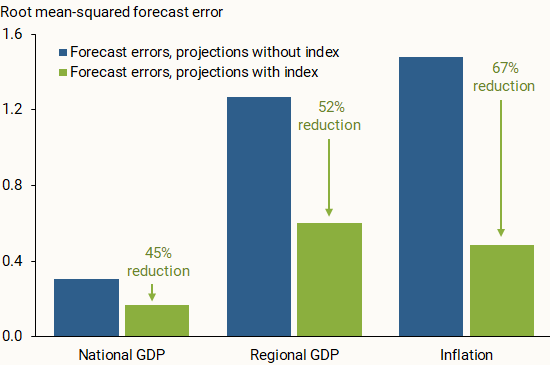
Beyond tracking data on national and regional economic conditions, we consider whether our two indexes can help improve one-year-ahead projections of output growth and overall inflation. We run linear regressions on a 2014–2022 data sample and estimate out-of-sample projections for the period starting in the first quarter of 2023. We run this analysis for the three economic measures—national GDP, regional GDP, and inflation—once with our index included on the right-hand side of the regression equation and once without the index. For this analysis, we use versions of the SF Fed Business Sentiment Index and the SF Fed Inflation Gauge Index that have been aggregated quarterly.
Figure 4 compares the out-of-sample projection accuracy of the two iterations. Across all economic measures, incorporating the SF Fed Business Sentiment Index or the SF Fed Inflation Gauge Index in the regression noticeably reduced the forecast errors for the out-of-sample period. This general result appears to hold when we project output growth and inflation one quarter ahead, in line with other studies that incorporate soft data from the Beige Book in short-term projections (Balke and Petersen 2002). The results are also consistent when using a local projections method from Jordà (2005) for one-year-ahead projections of output growth and shorter-term projections of inflation. This further supports the usefulness of our qualitative measures as early indicators of the future economic landscape over the short term.
Figure 4 Forecast errors with and without SF Fed sentiment indexes
Information collected from businesses and communities through the San Francisco Fed’s regional Beige Book questionnaire can provide valuable insights into the national and regional economies. Sentiment indexes described in this Letter use responses from Twelfth District Beige Book contacts to generally track economic activity and inflation. Our two indexes serve as reliable early indicators of official data, which could help improve near-term forecast accuracy. The SF Fed Business Sentiment Index remained negative for much of 2022 and 2023, possibly reflecting more subdued growth within the District relative to the United States. Meanwhile, the SF Fed Inflation Gauge Index spiked in recent months following adjustments to trade policy.
As programmable payments become more common, an old-school budgeting idea is making a comeback: earmarking. At its core, earmarking just means setting money aside for a specific purpose—like rent, payroll, or taxes—so it’s only used for that. It’s a simple concept, but when combined with automation, it could be the budgeting upgrade many people and businesses have been waiting for.
The word “earmark” dates to the 15th century, when farmers would notch their animals’ ears to show ownership. Over time, it came to mean setting something aside for a specific use. In personal finance, this idea lives on in the envelope system, where people divide up cash into labeled envelopes—groceries, bills, savings—and stick to those limits. It works, but let’s face it: handling cash envelopes isn’t exactly practical in a digital-first world.
That’s where programmable payments come in. These are payments that happen automatically based on rules you set. Instead of stuffing envelopes, you set up digital “buckets” for your money. Maybe 20 percent of every gig workpayment goes straight to a tax account or your weekly paycheck splits into rent, groceries, and savings buckets automatically.
Through banking apps, digital wallets, or budgeting platforms, consumers choose or create spending categories and assign rules—like percentages, spending limits, or triggers. For example, you can link your checking account to a programmable wallet that auto-transfers money into savings or investments accounts on payday, or prevents spending on dining once you hit your monthly cap.
It’s like having a personal money assistant organizing your finances, paying your bills, and keeping you on budget without you having to think about it. For businesses, this brings new efficiency to managing payroll, vendorpayments, and escrow accounts.
The upside of earmarking with programmable payments is clear: automation takes the work out of budgeting, real-time visibility helps track your money, and flexible rules let you customize how it all works. It’s also useful in more regulated settings like distributing aid or managing shared accounts because it adds accountability.
But if the rules are too rigid or confusing, that can frustrate users. Businesses may need to integrate programmable features with legacy systems, which takes time and money. And over reliance on automation poses risks—glitches, errors, or outdated settings can cause missed payments or unintended consequences.
Still, earmarking with programmable payments is a smart, modern take on a tried-and-true budgeting technique. It may not be right for every situation—and some apps already do this behind the scenes—but used intentionally, it can bring clarity, control, and purpose to the way money flows. In a complex financial world, that’s something both individuals and experts can benefit from.
GDPNow is not an official forecast of the Atlanta Fed. Rather, it is best viewed as a running estimate of real GDP growth based on available economic data for the current measured quarter. There are no subjective adjustments made to GDPNow—the estimate is based solely on the mathematical results of the model.
The GDPNowmodel estimate for real GDP growth (seasonally adjusted annual rate) in the second quarter of 2025 is 2.4 percent on July 25, unchanged from July 18 after rounding. The forecasts of the major GDP subcomponents were all unchanged or little changed from their July 18 values after this week’s releases from the U.S. Census Bureau and the National Association of Realtors.
As more monthly source data becomes available, the GDPNow forecast for a particular quarter evolves and generally becomes more accurate. That said, the forecasting error can still be substantial just prior to the “advance” GDP estimate release. It is important to emphasize that the Atlanta FedGDPNow forecast is a model projection not subject to judgmental adjustments. It is not an official forecast of the Federal Reserve Bank of Atlanta, its president, the Federal Reserve System, or the FOMC.
When I was first introduced to computers, programming languages like COBOL, Fortran, and Pascal were standard. None of them were particularly user-friendly, especially for someone like me who isn’t a natural coder. Over time, new languages and tools appeared, making programming more accessible.
Programmable payments are automated transactions that occur when specific conditions or events are met. Unlike traditional payment methods, which can rely on manual approvals or fixed schedules (think monthly softwaretransactions), programmable payments offer a more dynamic approach. For instance, a programmable payment might only occur when a product is delivered or a service is completed.
Transparency and security are other significant advantages, particularly when programmable payments are powered by blockchain. Each transaction is recorded on a decentralized ledger, providing a clear, auditable trail of activity. This can help reduce the risk of fraud and create a more secure system for managing payments.
As the Internet of Things expands, integrating programmable payments could allow devices to handle payments autonomously. Imagine a car that automatically pays for tolls or parking, or a smart refrigerator that orders and pays for groceries when supplies run low. The possibilities for real-time, automated payments between connected devices are enormous.
Despite all the potential, programmable payments face challenges. The technology—particularly blockchain-based systems—can be complex and requires specialized expertise, which can increase upfront costs for businesses. In addition, the regulatory environment around programmable payments is still evolving, especially for cross-border transactions. This creates uncertainty for businesses.
Both point to a future where systems execute tasks on their own, based on rules set by users. The goal is simple: Once the conditions are established, the system handles the rest.
Programmable payments are reshaping the future of finance. It’s an exciting future that promises smarter and more streamlined and efficient financial operations.
In October, I wrote about the potential for standards to make business-to-business payments more efficient. Today, let’s talk about standards again, this time for money transfer businesses and the state regulations covering them.
For new and established money transfer businesses and for state regulators, the hodgepodge of state regulations creates headaches. To do business everywhere in the United States, money transfer businesses must register separately in each state and US territory and meet license requirements that can vary from state to state. They can face multiple state examinations, also with different requirements, simultaneously (and annually). During examinations, regulators review operations, financial condition, management, and compliance with anti-money laundering laws.
Fortunately, many states have acted to address this confusing and inefficient situation by adopting the Model Money Transmission Modernization Act (MTMA) [archived PDF], sample legislation developed by the Conference of State Bank Supervisors to establish nationwide standards and requirements for licensed money transmitters. Fourteen states have adopted some version of the MTMA: Arizona, Arkansas, Georgia, Hawaii, Indiana, Iowa, Minnesota, Nevada, New Hampshire, North Dakota, South Dakota, Tennessee, Texas, and West Virginia. In my home state of Massachusetts, the legislature’s Joint Committee on Financial Services heard testimony on a version of this bill just last month. For traditional money transmitters and new fintech entrants, the MTMA aims to reduce the substantive and technical differences among the various state laws and regulations. This kind of change has the potential to reduce compliance burdens, encourage innovation, and remove barriers to entry for new market participants.
The MTMA is important given the prodigious growth in person-to-person, or P2P, payments via apps. Among all USconsumers, half of P2P payments were sent using noncash methods in 2022, up from less than 30 percent in 2020 (see the chart). From Massachusetts alone, money transmitters sent $31 billion in 2022, according to the state’s Division of Banks.
Half of P2P payments were made electronically in 2022.
The MTMA also has the potential to create efficiencies for state supervisors. For example, the Conference of State Bank Supervisors (CSBS) has facilitated a collaborative exam program for nationwide payments and cryptocurrency firms to undergo one exam, each facilitated by one state overseeing a group of examiners sourced from across the country. According to the CSBS, transmitters in more than 40 states that have laws addressing core precepts can benefit from the streamlined exams.
The MTMA is another example showing that standards create efficiencies that are good for businesses, good for regulators and, by extension, good for consumers.
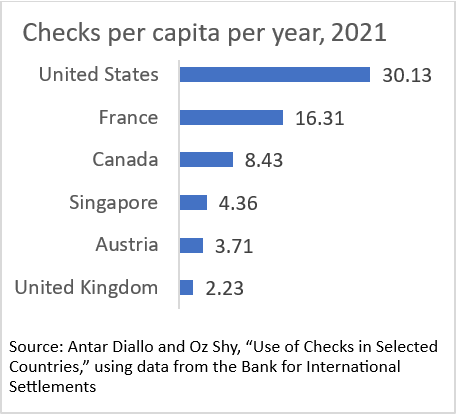
Among the 20 countries that reported the number and value of these payments to the BIS, the United States had by far the highest per capita use of checks per year in 2021: 30 checks. Only six countries reported more than two per capita (chart below), another 12 between zero and two. Belgium and South Africa reported zero.
Given the high per capita use in the United States, it makes sense that our year-over-year decline from 2012 has been slower than that for other countries. The per-year decline in the number of U.S.checks from 2012 to 2021 was slower than the decline for all the other high-use countries listed in the chart. The United States was down 6.7 percent per year from 2012 to 2021, compared to down 8.8 percent per year for Canada at the slow end and down 17.4 percent per year for Austria at the quick end.
No way around it: we love our checks, and our response to innovation has been tepid compared to that of other countries.
GDPNow is not an official forecast of the Atlanta Fed. Rather, it is best viewed as a running estimate of real GDP growth based on available economic data for the current measured quarter. There are no subjective adjustments made to GDPNow—the estimate is based solely on the mathematical results of the model. In particular, it does not capture the impact of COVID-19 and social mobility beyond their impact on GDP source data and relevant economic reports that have already been released. It does not anticipate their impact on forthcoming economic reports beyond the standard internal dynamics of the model.
On April 5, the GDPNow model estimate for real GDP growth in the first quarter of 2023 is 1.5 percent, down from 1.7 percent on April 3.
The next GDPNow update is Monday, April 10.
Want to see even more economic data? The Atlanta Fed’s EconomyNow app will put GDPNow and all its data tools right in your hands. Download it today to see the latest data on inflation, growth, and the labor market.