The Overview of Japan, US, and the Euro area is renewed once a year after the Flow of Funds Accounts is released in June.
The Bank of Japan retroactively revises data for the Flow of Funds Accounts (FFA), in principle once a year, to reflect information updates, such as newly obtained source data and institutional changes, and to incorporate revised estimation methods. The retroactive revision of 2026 was implemented on June 25 and data from the first quarter of 2005 onward has been updated accordingly. The majority of the revision contents are unchanged from the Planned Retroactive Revision to the Flow of Funds Accounts [Archived PDF] released on May 25, 2026.
Working Session on “Reviving a Balanced, Shared and Sustainable Economic Growth”
On June 17, commencing at 10:30 a.m. (local time. 5:30 p.m. on June 17, Japan time.) for approximately 120 minutes, Ms. TAKAICHI Sanae (高市 早苗), Prime Minister of Japan, attended the G7Evian Summit Working Session on “Reviving balanced, inclusive, and sustainable economic growth for the benefit of all”. The overview of the session is as follows.
Prime MinisterTAKAICHI stated that the G7 and like-minded countries should maintain close communication to reduce uncertainty in the global economy. Prime MinisterTAKAICHI also stated that it is a common challenge for many countries to promote self-sustaining growth, by addressing non-market policies and practices (NMPPs) and the resulting excess capacity which are drivers of widening global imbalances.
Furthermore, Prime MinisterTAKAICHI stated that G7 members and the countries participating in this session should also demonstrate their contribution to reducing imbalances for their own balanced growth as well as for the stability of the global economy and financial markets. Prime MinisterTAKAICHI added that making use of data-driven, objective analyses and policy advice by the IMF and the OECD is extremely beneficial in advancing these efforts.
Prime MinisterTAKAICHI expressed her hope that the G7 and like-minded countries would lead the global economy through frank discussions. She also stated that she looked forward to discussions at the G20, chaired by PresidentDonald Trump of the United States, on reducing uncertainty in the global economy and becoming stronger and more prosperous together.
Situation in Iran (Signing of a Memorandum of Understanding between the United States and Iran)
Hereafter, it is important that free and safe navigation through the Strait of Hormuz is swiftly reestablished through the steady implementation of this MoU by all parties. Japan also considers it of critical importance that vessels be able to transit the Strait of Hormuz without being subject to additional costs, as has been the case thus far.
After the conclusion of a final agreement, Japan intends to play an active role in the reconstruction and recovery of the region. Japan will also continue to make every diplomatic effort, in close coordination with the international community, toward the realization of peace and stability throughout the Middle East region.
Parliamentary Vice-Minister for Foreign Affairs ERI’s Visit to the United States
During her visit, Parliamentary Vice-Minister ERI will attend the United Nations General Assembly High-Level Meeting on HIV/AIDS and deliver a statement in the meeting. She will also hold meetings with representatives of international organizations.
At this dialogue, following the enactment of Japan’s Cyber Response Capability Strengthening Act and Necessary Arrangement of Relevant Acts last year, as well as the adoption of its new Cybersecurity Strategy, the two sides exchanged views on broad range of topics, such as each country’s respective cybersecurity strategy and policy, and cooperation at both the bilateral and multilateral levels.
Both sides confirmed that they will continue to work closely together in the field of cyber, including through the Japan–Australia Cyber Policy Dialogue.
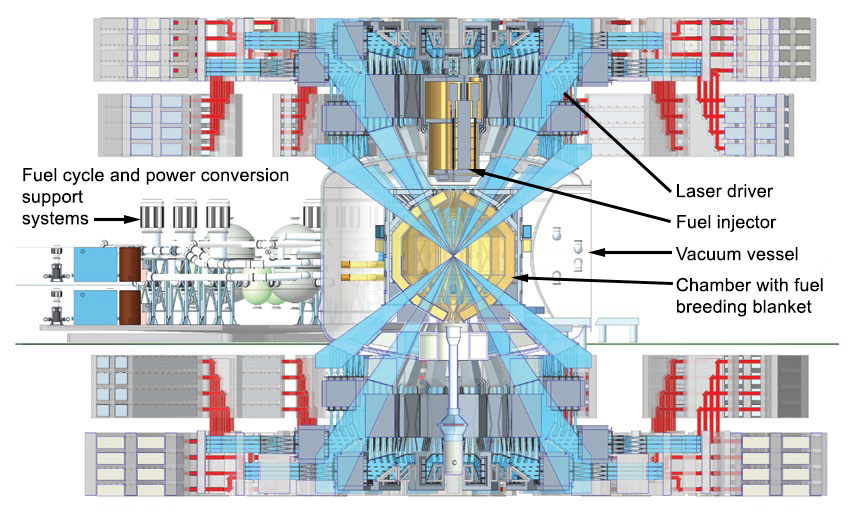
Although significant work remains to harness fusion energy, pursuing the development and deployment of IFE is crucial for the nation’s energy security, enabling the United States to shape implementation worldwide, avoid technological surprises from adversaries, and influence technical leadership in other energy-intensive technologies such as AI, machine learning (ML), and supercomputing.
IFE research stretches back to the early days of Lawrence Livermore, and today the Laboratory is fostering the overall fusion ecosystem. Livermore’s unique capabilities, expertise, and connections will be critical to laying the technical, logistical, and legal groundwork to make IFE possible. “IFE is a grand scientific and engineering challenge, something that is so incredibly difficult and high-risk and takes enormous expertise,” says Tammy Ma, Livermore’s IFE Institutional Initiative lead. “This challenge makes it the right kind of problem for national laboratories to pursue.”
This artist’s rendering shows the concept for an inertial fusion energy (IFE) power plant design, with a cutaway to show the plant’s target chamber in the center. Livermore researchers are laying the groundwork for private fusion companies to build similar designs. (Illustration by Eric Smith.)
Designing for Viability
NIF is the only facility to date to demonstrate the ignition and burning plasma conditions that are prerequisites for IFE, but it is an experimental facility for stockpile stewardship research, not a power plant. To be commercially viable and produce the energy to offset costs and meet demands (baseload power), IFE plants will need to generate more than 30 times the energy they deliver to the fusion target on every shot while firing 10 or more shots per second, compared to NIF’s rate of one or two shots per day.
The Laser Inertial Fusion Energy (LIFE) study, conducted between 2008 and 2013, aimed to build directly on technology developed for NIF to achieve IFE and took a systematic approach to this requirement by developing the Integrated Process Model (IPM). (See S&TR, April/May 2009 [archived PDF], pp. 6-15.)
IPM is a technoeconomic model of an IFE power plant with detailed technical and cost breakdowns and interdependencies of key systems and subsystems. “The work done under LIFE was fantastic,” says Ma. “IPM lays out engineering and physics requirements for the entire system to test out different scenarios and see the impact. Now, we not only get to expand on all that but also leverage 15 years of new data from NIF, better codes, and high-performance computing (HPC), as well as new work in AI, ML, advanced manufacturing, diagnostics, and nonproliferation across the Laboratory.”
IPM describes an IFE power plant that requires a solid-state laser driver system to “pump” lasers with optical energy using laser diodes instead of flashlamps as at NIF. The plant will also need to fabricate and fill target capsules onsite and send them into its target chamber at a high enough frequency to produce baseload power. “We will have to repeatedly inject targets into the chamber, so the targets must be able to withstand and survive that process,” explains Ma. “Then, the lasers will track the moving targets, and when one gets to the center of the chamber, they would fire on the centered target, repeating 10 to 20 times per second.”
The facility would convert fusion energy into heat and then electricity via steam turbines, sending most of the electricity to the power grid and recycling the rest to power operations on subsequent shots. Neutrons from the reaction would produce tritium needed for the DT fuel by bombarding lithium isotopes in a “breeding blanket” material lining its target chamber. By closing both the power and fuel cycles, IFE plants are expected to be self-sustaining.
Thanks in part to IFE STARFIRE (IFE Science and Technology Accelerated Research for Fusion Innovation and Reactor Engineering), a Department of Energy (DOE)-funded multi-institutional IFE research and development hub, researchers across the Laboratory are working to meet the new system’s demands. IPM can help identify key challenges, test the viability of new designs, and direct future research. “Many technical models and cost models exist for IFE, but very few, if any, pair systems and cost models together at the same depth as IPM,” says Mackenzie Nelson, a technoeconomic systems analyst in the Computational Engineering Division. “This type of tool offers such an advantage because we can assess design choices from both a technical and economic standpoint and create blueprints for what an IFE plant could look like.”
(left to right) Livermore researchers Bassem El Dasher, Claudio Santiago, and Mackenzie Nelson discuss a 3D model of a proposed IFE power plant design alongside the Integrated Process Model (IPM). IPM has more than 270 potential user inputs that researchers and collaborators can use to assess different IFE design choices to see the technical and cost impact on the entire design.
Operational Demands
NIF’s target capsules are extremely precise, fragile, and can take weeks to fabricate, fill, and position. Researchers are trying to reconcile that factor with the estimated demand of more than 800,000 capsules per day produced at less than $0.50 each to achieve IFE plant viability. To do this, they are examining optimal target designs for IFE and exploring advanced manufacturing methods such as microfluidics, volumetric additive manufacturing, and two-photon polymerization. (See S&TR, April/May 2025 [archived PDF], pp. 16-19.) Additional projects involve developing diagnostic instruments that can collect, analyze, and combine data with other diagnostics at the 10 to 20 shot per second frequency and use it to improve lasers in real time.
Nuclear fissionreactors are regulated through international agreements and export control rules, and the independent International Atomic Energy Agency (IAEA) verifies that nuclear material and facilities are only being used for peaceful purposes. Neither treaties nor the IAEA address fusion energy, and no consensus has been reached on whether fusion energy systems need an international verification program. Verification methods for safeguarding tritium are also far less developed than for plutonium and uranium and focus more on contamination and transfers than analytical accounting for discrepancies. The precise scale of allowable tritium unaccounted for without posing proliferation risk is also unclear.
Fusion systems can be designed for proliferation resistance, but not having an existing design remains a challenge.
International security analyst Anne-Marie Riitsaar and her colleagues are exploring these complexities and starting conversations with international fusion experts and private industry to raise awareness. Riitsaar also plans to collaborate with the IPM team to map tritium diversion vulnerabilities and identify high-risk points where researchers could incorporate surveillance methods into plant designs to detect and prevent potential misuse. “People sometimes ask me why I’m thinking about fusion energyregulations and proliferation risks at this point, but it’s not too early,” says Riitsaar. “Reaching a multinational consensus on regulating sensitive technologies takes considerable time and effort.”
The National Ignition Facility is an experimental facility and not a power plant, so a commercial IFE plant design has vastly different requirements—many of which are being studied by Livermore researchers and their collaborators.
The Laser Driven Fusion Integration Research and Science Test Facility (LD-FIRST) is a proposed blueprint for a proof-of-concept IFE facility that will test all the key IFE subsystems in an integrated fashion. A public-private partnership will likely be necessary to build the facility and will help the IFE community address the main subset of risks and the technological challenges of building a commercial plant.
Converging on a Solution
The team seeks to make IPM as accurate and comprehensive as possible by meeting with subject matter experts across the Laboratory to incorporate the latest research. “We’re trying to evolve the model so it has the same level of high detail across every single functional area to tell us where we can focus research and help us find optimized solutions that we could propose to industry,” says Nelson.
Computer scientist Claudio Santiago and his colleagues also modernized IPM by porting its framework from Microsoft Excel to Python in December 2024, making it compatible with AI, ML, design optimization, and HPC to further inform designs. “Once we think about all the forcing functions such as minimum shot yield and materials requirements pinning us in from every direction, we end up with an optimized solution space. As we sharpen the pencil more with these tools, that optimized solution box gets smaller until eventually we’ve converged on a point design,” says IFE lead systems engineer Justin Galbraith. Galbraith and his team’s point design is called the Laser Driven Fusion Integration Research and Science Test Facility, or LD-FIRST, a proof-of-concept physics demonstration facility for IFE. “That point design, we anticipate, will serve as the foundation for a future public-private partnership that would facilitate building and realizing a physical facility to focus the IFE community in pursuit of fusion power on the grid,” says Galbraith.
Ma chaired DOE’s “Basic Research Needs for IFE” workshop and report in 2022 and co-chairs the subcommittee providing recommendations on the nation’s fusion activities through DOE’s Fusion Energy Sciences Advisory Committee. She and her team travel often to Washington, D.C., working with DOE and legislators to expand fusion energyresearch and advocacy in the nation. Livermore also leads a “Collaboratory” with other DOEnational laboratories to connect research project leads and facilitate public-private partnerships. The Collaboratory has hosted multiple events with industry, and the Laboratory has partnered with three private companies who aim to design pilot IFE plants.
Meanwhile, Galbraith and other IFE leaders have served as technical advisors for engineering design teams at Texas A&M University and given them IFE-relevant problems to solve, including advanced chamber and blanket design. Galbraith is working with Nelson to develop the IFE plant design portion of a high-energy-density science summer school program, which Nelson is leading in 2025 at the University of California at San Diego, and they have developed IFE curriculum that has been deployed at six universities starting in spring 2025. “We’re hoping we can get a group of students really excited about fusion and start to build up the next generation of engineers and scientists that will make fusion a reality,” says Galbraith. The team has led IFE strategic planning exercises at the Laboratory, and Lawrence Livermore will stand up a new fusion institute—named “LIFT,” for Livermore Institute for Fusion Technology—a research and development center that will coordinate and centralize institutional fusion energyresearch.
Harnessing IFE will be a massive undertaking, but Livermore’s broad and deep expertise, facilities, and capabilities put the Laboratory in a unique position to lead and play an impactful role. “If we can set it up correctly, IFE will be a big piece of the Laboratory’s long-term vision,” says Ma. “IFE plays off of our history and all of our strengths, and it is critical for long-term national security.”
The great price revolution of the 16th and 17th centuries provided a powerful lever for the specifically capitalistic tendencies of seeking profit through cheapening production and lowering the price. This revolution is rightly ascribed to the continuous inflow of precious metals, in consequence of the great overseas discoveries. It lasted from the thirties of the 16th century down to the time of the Thirty Years’ War, but affected different branches of economic life in quite different ways. In the case of agricultural products an almost universal rise in price set in, making it possible for them to go over to production for the market. It was quite otherwise with the course of prices for industrial products. By and large these remained stable or rose in price relatively little, thus really falling, in comparison with the agricultural products. This relative decline was made possible only through a shift in technology and economics, and exerted a pressure in the direction of increasing profit by repeated cheapening of production. Thus the development did not follow the order that capitalism set in first and the decline in prices followed, but the reverse; first the prices fell relatively and then came capitalism.
Notice the last sentence above, Weber explicitly describes price revolutions exactly as Fischer argues.
In the history books we read, the emphasis is always on colorful personalities, inventions and other more theatrical events. This obviously omits the idea of phenomena like price revolutions. We cannot explain history merely by these personalities; we need to zoom out and view the larger picture.
Drewry Maritime Financial Research (DMFR), is the marketing name of Drewry Financial Research Services Ltd. DMFR, is an independent equity research service focused on the maritime industry. DMFR’s parent organisation, Drewry Shipping Consultants Holdings Limited was established more than 50 years ago and is now widely regarded as one of the leading independent sources of global industry analysis and insight. This in-depth industry knowledge is fully applied in our analysis of quoted maritime companies.
The railway is the most revolutionary instrumentality known to history, for economic life in general and not merely for commerce, but the railway was dependent on the age of iron; and it also like so many other things, was the plaything of princely and courtier interests.
Zooming out you may intuit that these narrow gauge explanations are inadequate but much better than nothing. We are faced with the problem of connecting railroads and the Iron Age to larger transformations from which these railroads were born.
Despite the brilliance of Watt’s engine, however, without the financial backing of Matthew Boulton, it might have been a failure.
If you read Watt and Boulton’s correspondence, Watt is always thinking locally, whereas Boulton is already talking about selling the invention globally. This is the ecosystem in which Weber’s economic observations reside.
Land transport also remained as before. The post produced no change; it merely forwarded letters and small packages, but did not concern itself with large scale production, which was decisive for economic life.
Only the roads underwent an extraordinary improvement, through the construction of turnpikes. In this the French government under Sully took the lead, while England leased the roads to private enterprisers who collected tolls for their use. The building of the turnpikes wrought a revolution in commercial life comparable to no other before the appearance of the railways. There is no comparison between the present density of road traffic and that of this period. In 1793, 70,000 horses went through the little town of Lüneburg while as late as 1846 only 40,000 were used in freight transport in all Germany. The costs of land carriage amounted to ten or twenty times the freight on the railways at a later time, and were three to four times as high as the charges for inland shipping at the same period. A half billion ton-kilometers was the highest figure for transportation for the movement on land in Germany, while in 1913, 67 billions were carried on the railroads.
Everything is connected to everything else, and without realizing this truth and sensing the underlying transformations, you cannot get a clear signal from history.
Ever since new tariffs were enacted in early 2025, a key policy question has been what is the extent to which businesses will pass tariff costs through to prices, and when? The effects of a tariff are rarely straightforward, given, among other things, competitive dynamics and the challenges of implementation, but the historically large and changing nature of these tariffs have created additional levels of uncertainty over the effects.
In uncertain times, anecdotal evidence from businesses can be especially insightful. We are learning how businesses are reacting to tariffs through the Richmond Fed’s business surveys as well as through hundreds of one-on-one conversations with Fifth District businesses since the start of 2025.
These conversations showcase that navigating tariffs is a complex and sometimes protracted process for firms, particularly when there is uncertainty. Firms describe several reasons they may not have experienced the full impact of proposed tariffs yet (even when goods and countries they deal with are subject to them), as well as reasons that even when they have incurred tariff-related cost increases, there can be a delayed impact on pricing decisions.
Reasons Firms May Not Have Incurred Tariffs Yet
Business contacts describe several strategies or circumstances that can delay or reduce the tariffs on inputs or other imported items. These include the following:
Delayed ordering. In response to announced tariffs, many firms ran down existing inventories or ran inventories lean in hopes that tariffs would become lower. For example, a national retailer said everyone was “delaying all we can delay in hopes we get more clarity on trade deals” and reported meeting with procurement teams multiple times per week to discuss ports and ship capacity, evolving tariffs, and inventories to keep goods flowing and prices as low as possible. One port said they have a crane waiting to be shipped but can’t do so now due to the tariffcost.
Cost-sharing.Vendor relationships are often long term, and many firms report partnering with suppliers and customers to share costs. When tariffs first rolled out, multiple firms (a beverage distributer, supply chainlogistics company) anticipated a “rule of thirds” where the cost was split evenly among the supplier, the importer, and the customer. A national retailer reported being large enough to force suppliers to bear much of the cost, though it varied by relationship and item. Interestingly, firms also reported that cost-sharing is not necessarily a permanent solution: A steeldistributer said that with the second round of tariffs announced in June, “The ‘kumbaya’ of cost-sharing was likely to come to an end.” Similarly, a fabricmanufacturer said that upon an announced trade deal with Vietnam that took tariffs from 10 percent to 20 percent, suppliers took a new stand on cost sharing: “Most vendors said you’re on your own” for the second 10 percent, and one even clawed back cost-sharing from the first round.
Transit time. It takes up to six weeks for container ships to arrive to the East Coast from China, so even if firms are ordering goods, there is a natural delay when the tariff is incurred. Shipping time in a world of rapidly changing tariff proposals add to uncertainty around tariffcosts.
Tariff implementation delays.Richmond FedeconomistMarina Azzimonti has found that a variety of tariff implementation delays help explain why actual tariffs as of May 2025 were much lower than expected. These factors include legacy exemptions and delays in customs system updates. Azzimonti also finds that a small percentage is explained by countries substituting away from high-tariff countries. For example, one national retailer we spoke with was in the process of dropping 10 percent of products sourced from China. Whether a company can change sourcing varies dramatically by type of firm and product.
As our monthly business surveys have found, many firms report deploying more than one strategy to delay tariffs. Notably, many of these delays are only temporary.
Reasons Tariffs May Have a Delayed Impact on Prices
Even when firms have incurred tariffs, they give several reasons why tariffs may not be immediately reflected in the prices they charge for their products. These include the following:
Waiting for tariff policy to clarify. Higher prices could reduce demand for goods and services and/or lead firms to lose market share, so many firms said they are hesitant to increase prices until they’re sure tariffs will remain in place. For example, a large national retailer said if tariffs are finalized at a sufficiently low level, they’ll absorb what they’ve incurred to date, but if high tariffs stick, they’ll have to raise prices. A steel fabricator for industrial equipment described being reluctant to raise prices on the 10 percent cost increases they’d seen thus far but would have to raise prices should the increases reach 12 to 13 percent. A grocery store chain was reluctant to raise prices and instead might reduce margins, which had recovered in recent years, to maintain their customer base. Some firms explicitly noted a strategy to both raise prices over time and pursue efficiency gains to cut costs and completely restore margins within a year or two.
Elasticity testing. Firms reported testing across goods whether consumers will accept price increases. A furnituremanufacturer said he’s seen competitors pass along just 5 percentage points of the tariffs at a time so it isn’t such a huge shock to customers, though in that sector, “We all end in the same place which is the customer bearing most of it.” A national retailer said most firms are doing a version of stair-stepping tariffs through, e.g., raising prices a small amount once or twice to see if consumer demand holds, and if so, trying again two months later. This retailer said prices were going up very marginally in early summer, would increase more in July and August, and would be up by 3 to 5 percent by the end of Q4 and into 2026. Another national retailer said they would start testing the extent to which demand falls with price increases, e.g., when the first items that were subject to tariffs—in this case back to school items—hit shelves in late July.
Blind margin. Some firms reported attempting to pass through cost in less noticeable ways. While any price increase to consumers will be captured in measures of aggregate inflation, the fact that price increases may occur on non-tariffedgoods might make it difficult to directly relate price increases to tariffs. An outdoor goodsretailer said, “Unless it’s a branded item where everyone knows the price, if something goes for $18, it can also go for $19.” A national retailer plans to print new shelf labels with updated pricing, which will be less noticeable for consumers compared to multiple new price stickers layered on top. This takes time (akin to a textbook “menu cost” in economics), so it will not be reflected in prices until July and August. A grocery store said their goal was to increase average prices across the store but focus on less visible prices.
Selling out of preexisting inventory: Many firms noted they still have productioninventory from before tariffs were announced, so they do not need to raise prices as long as they still sell these lower cost goods. A national retailer noted they have at least 25 weeks of inventory on hand for most importedproducts. A firm that produces grocery items said they will decide how much to raise prices as they get closer to selling tariff-affected products. Similarly, retailers order seasonal items quarters in advance. Many were receiving items for fall and winter when the new tariffs were going into effect in the spring. They paid the tariff then, but we won’t see the price increase until those items hit the shelves in the fall or winter. One retailer speculated that seasonal décor items will look the most like a one-time increase.
Pre-established prices. Many firms face infrequent pricing due to factors like annual contracts or pre-sales. For example, a dealer of farm equipment gets half its sales through incentivized pre-sales to lock in demand and smooth around crop cycles. They noted that while it would be difficult to retroactively ask those customers to pay for part of the tariff, they will pass tariffs directly through on spare parts. A steel fabricator for industrial equipment has a contract for steel through Q3, so they haven’t been impacted yet by price increases. However, they will face new costs once that contract expires.
In general, compared to small firms, large firms have more ability to negotiate with vendors, temporarily absorb costs, burn cash, wait for strategic opportunity, and test things out. This matters because large firms often lead pricing behavior among firms, so these strategic choices may influence the response of inflation to tariffs more generally. Even within firm size, one often hears that negotiations on price vary considerably by relationship and item.
Conclusion
A key question surrounding tariffs is whether any effects on inflation will resemble a short-lived price increase—as in the simplest textbook model of tariffs—or a more sustained increase to inflation that may warrant tighter Fedmonetary policy. When asked in May what will determine the answer, Fed ChairJerome Powellcited three factors [archived PDF]: 1) the size of the tariff effects; 2) how long it takes to work their way through to prices; and 3) whether inflation expectations remain anchored. The insights shared above suggest the process from proposed tariffs to the prices set by firms is far from instantaneous or clear-cut, particularly when tariff policy is changing.
Sensing from businesses suggests that the impact of tariffs on their price-setting [archived PDF] has been lagged, but it is starting to play out. Nonetheless, it remains highly uncertain how tariffs will impact consumerinflation. The discussion above makes clear that firms are nimble and innovative in the face of challenge, and they are concerned about losing customers in the current environment, particularly consumer-facing firms. We will continue to learn from our business contacts and share their insights.
There have been all kinds of “voices” in the history of Western civilization. Perhaps the loudest voice is that of monomaniacs, who always claim that behind the appearance of the many is the one. If we illustrate the West, and at its roots, the intersection of Athens and Jerusalem, we see the origins of this monomania. Plato’s realm of ideas was supposed to explain everything encountered in our daily lives. His main student and rival, Aristotle, has his own competing explanation, based in biology instead of mathematics.
Currently, the monomania impetus continues full-force. For example, Professor Seth Lloyd of MIT tells us that reality is the cosmos and not chaos, because all of reality together is a computer. His MIT colleague, Max Tegmark, argues in his books that the world is not explained by mathematics, but rather ismathematics. Perhaps the climax of this kind of thinking is given to us by the essay “Everything Is Computation” by Joscha Bach:
These days we see a tremendous number of significant scientific news stories, and it’s hard to say which has the highest significance. Climate models indicate that we are past crucial tipping points and irrevocably headed for a new, difficult age for our civilization. Mark van Raamsdonk expands on the work of Brian Swingle and Juan Maldacena and demonstrates how we can abolish the idea of spacetime in favor of a discrete tensor network, thus opening the way for a unified theory of physics. Bruce Conklin, George Church, and others have given us CRISPR/Cas9, a technology that holds promise for simple and ubiquitous gene editing. “Deep learning” starts to tell us how hierarchies of interconnected feature detectors can autonomously form a model of the world, learn to solve problems, and recognize speech, images, and video.
It is perhaps equally important to notice where we lack progress: Sociology fails to teach us how societies work; philosophy seems to have become infertile; the economicsciences seem ill-equipped to inform our economic and fiscal policies; psychology does not encompass the logic of our psyche; and neuroscience tells us where things happen in the brain but largely not what they are.
It is the notion of computation. Computation, at its core, and as informally described as possible, is simple: Every observation yields a set of discernible differences.
These we call information. If the observation corresponds to a system that can change its state, we can describe those state changes. If we identify regularity in those state changes, we are looking at a computational system. If the regularity is completely described, we call this system an algorithm. Once a system can perform conditional state transitions and revisit earlier states, it becomes almost impossible to stop it from performing arbitrary computation. In the infinite case that is, if we allow it to make an unbounded number of state transitions and use unbounded storage for the states—it becomes a Turing machine, or a Lambda calculus, or a Post machine, or one of the many other mutually equivalent formalisms that capture universal computation.
Computation is different from mathematics. Mathematics turns out to be the domain of formal languages and is mostly undecidable, which is just another word for saying “uncomputable” (since decision making and proving are alternative words for computation, too). All our explorations into mathematics are computational ones, though. To compute means to actually do all the work, to move from one state to the next.
Computation changes our idea of knowledge: Instead of justified true belief, knowledge describes a local minimum in capturing regularities between observables. Knowledge is almost never static but progresses on a gradient through a state space of possible worldviews. We will no longer aspire to teach our children the truth, because, like us, they will never stop changing their minds. We will teach them how to productively change their minds, how to explore the never-ending land of insight.
A growing number of physicists understands that the universe is not mathematical but computational, and physics is in the business of finding an algorithm that can reproduce our observations. The switch from uncomputable mathematical notions (such as continuous space) makes progress possible. Climate science, molecular genetics, and AI are computationalsciences. Sociology, psychology, and neuroscience are not: They still seem confused by the apparent dichotomy between mechanism (rigid moving parts) and the objects of their study. They are looking for social, behavioral, chemical, neural regularities, where they should be looking for computational ones.
Friedrich Nietzsche rebelled against this type of thinking the most profoundly. If scientism represents the modern, then Nietzsche was the prophet of postmodernism. Nietzsche’s famous phrase, “God is dead.” is not about a creator or divinity, but rather finality itself. There is no final explanation.
by Hamza Abdelrahman, Luiz Edgard Oliveira and Aditi Poduri
Information the San Francisco Fed collects from businesses and community sources for the Beige Book provides timely insights into economic activity at both the national and regional levels. Two new indexes based on Beige Book questionnaire responses track business sentiment across the western United States. The indexes track data on economic activity and inflation, serving as early indicators of official data releases and helping improve near-term forecasting accuracy. The latest index readings suggest weakening economic growth and intensifying inflationary pressures over the coming months.
This Economic Letter examines the economic information collected through the SF Fed’s Beige Book questionnaire over the past 10-plus years. We analyze this information by constructing sentiment indexes from the qualitative data and comparing them with quantitative measures of national and regional economic activity and inflation. We introduce two indexes—the SF Fed Business Sentiment Index and the SF Fed Inflation Gauge Index—which track our contacts’ views and expectations for economic growth and inflation, respectively. We find that these new indexes serve as reliable early indicators of official data releases and help improve near-term forecast accuracy. The SF Fed Business Sentiment Index has generally exhibited patterns similar to other recent business and household sentiment indexes, and the SF Fed Inflation Gauge Index has shown a strong uptick in expected inflation. To regularly monitor changes in these two indexes, the San Francisco Fed has launched a new Twelfth District Business Sentiment data page.
Constructing regional sentiment indexes
The San Francisco Fed sends out a Beige Book questionnaire to business and community contacts across the District eight times a year to gather regional information. In addition to answering questions regarding their organizations, respondents share their views on regional and national topics, including economic activity and inflationary pressures.
In two questions, respondents indicate whether they see national output growth and inflation rates increasing, decreasing, or staying stable over the coming year using a standard five-tiered scale. We use these responses since 2014 to formulate two business sentiment indexes, one on economic activity and another on inflation. We assign standard weights to the five-tiered qualitative scale that are symmetrical around zero. For example, we ask if activity is expected to “decrease significantly” = –2, “decrease” = –1, “remain unchanged” = 0, “increase” = 1, or “increase significantly” = 2. We add up the weighted shares of responses for each tier within each index. We then normalize each resulting series by its own average and standard deviation for ease of comparison with traditional economic indicators.
Tracking business sentiment
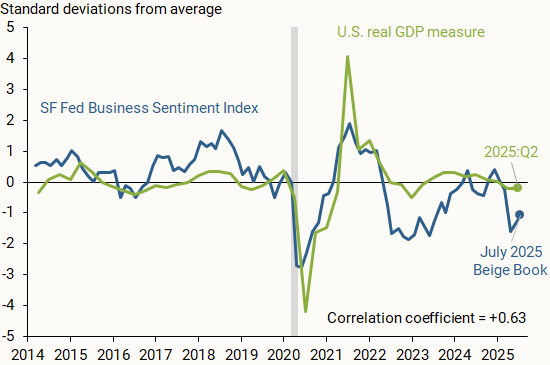
Figure 1 shows how the SF Fed Business Sentiment Index (blue line), compiled from responses to the question on national economic activity, compares with data on changes in national GDP (green line). We measure national output as the four-quarter change in inflation-adjusted, or real, GDP, normalized by its average and standard deviation so that it is centered around zero and, hence, more directly comparable to the SF Fed Business Sentiment Index. The vertical axis shows how many standard deviations away each observation is from its respective measure’s average from 2014 to mid-2025.
Figure 1 Economic growth versus business sentiment
The SF Fed Business Sentiment Index generally tracks the movements in national GDP over the past decade; a correlation coefficient of +0.63 on a scale of –1 to 1 indicates a moderately strong positive relationship between the two measures. A relatively recent exception started in 2022, when our index began showing a considerable decline relative to the national GDP measure. Respondents across the District were downbeat about economic growth and reported expectations of a sharp decline in consumer spending and overall household financial health following the depletion of pandemic-era savings (Abdelrahman and Oliveira 2023). A similar decline appeared in other measures of business and household sentiment. Nevertheless, overall economic growth continued at a solid pace. This decoupling between sentiment and hard data that began in 2022 was dubbed a “vibecession” (Daly 2024, Scanlon 2022).
Another possible reason for the divergence between national real GDP and our Business Sentiment Index is the influence of the regional economy. Although respondents are asked about their views of national GDP, their responses may be affected by regional outcomes. Thus, our index may also reflect a regional perspective from our business and community contacts.
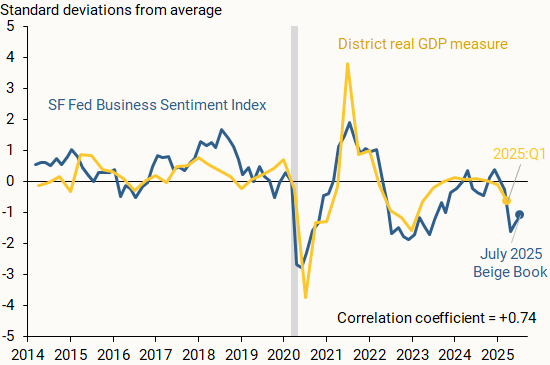
Figure 2 supports this rationale, showing the SF Fed Business Sentiment Index alongside a measure of regional output growth (gold line). We find that the measures closely track one another, including for 2022 and 2023, with a correlation coefficient of +0.74. We define District real GDP growth as the year-over-year percent change in the total output of the District’s nine states as reported by the Bureau of Economic Analysis (BEA). We normalize the series as described before.
Figure 2 Regional economic growth and business sentiment
Our findings indicate that the SF Fed Business Sentiment Index can serve as an accurate early indicator for national and regional output growth. Since the regional Beige Book questionnaire is collected twice each quarter, it provides particularly timely insights into economic activity during the current quarter. By contrast, the first GDP data release for any given quarter usually arrives a full month after that quarter has ended, and initial data releases for state-level output growth arrive with even more delay.
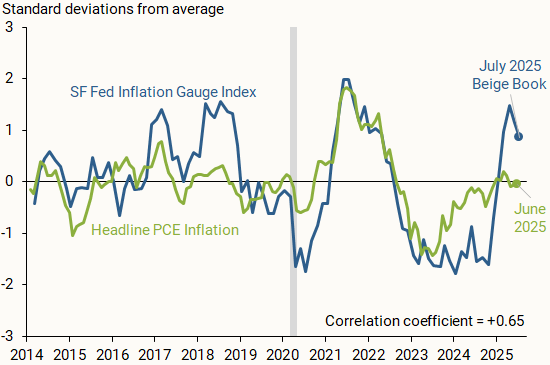
Our Beige Book questionnaire responses also provide insights into how business and community contacts in the District see national inflation evolving. Figure 3 compares the SF Fed Inflation Gauge Index (blue line) with monthly changes in the year-over-year headline personal consumption expenditures (PCE) inflation rate published by the BEA (green line). We normalize the inflation series and index as discussed earlier.
Figure 3 SF Fed Inflation Gauge Index versus realized inflation
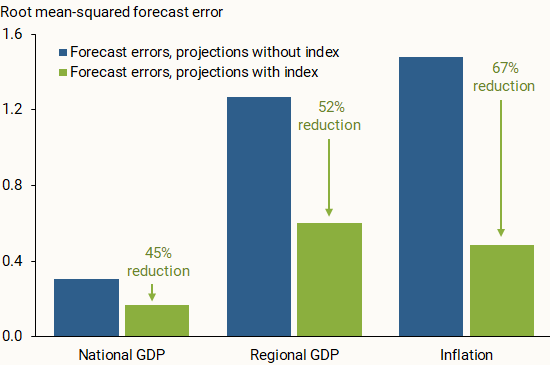
Beyond tracking data on national and regional economic conditions, we consider whether our two indexes can help improve one-year-ahead projections of output growth and overall inflation. We run linear regressions on a 2014–2022 data sample and estimate out-of-sample projections for the period starting in the first quarter of 2023. We run this analysis for the three economic measures—national GDP, regional GDP, and inflation—once with our index included on the right-hand side of the regression equation and once without the index. For this analysis, we use versions of the SF Fed Business Sentiment Index and the SF Fed Inflation Gauge Index that have been aggregated quarterly.
Figure 4 compares the out-of-sample projection accuracy of the two iterations. Across all economic measures, incorporating the SF Fed Business Sentiment Index or the SF Fed Inflation Gauge Index in the regression noticeably reduced the forecast errors for the out-of-sample period. This general result appears to hold when we project output growth and inflation one quarter ahead, in line with other studies that incorporate soft data from the Beige Book in short-term projections (Balke and Petersen 2002). The results are also consistent when using a local projections method from Jordà (2005) for one-year-ahead projections of output growth and shorter-term projections of inflation. This further supports the usefulness of our qualitative measures as early indicators of the future economic landscape over the short term.
Figure 4 Forecast errors with and without SF Fed sentiment indexes
Information collected from businesses and communities through the San Francisco Fed’s regional Beige Book questionnaire can provide valuable insights into the national and regional economies. Sentiment indexes described in this Letter use responses from Twelfth District Beige Book contacts to generally track economic activity and inflation. Our two indexes serve as reliable early indicators of official data, which could help improve near-term forecast accuracy. The SF Fed Business Sentiment Index remained negative for much of 2022 and 2023, possibly reflecting more subdued growth within the District relative to the United States. Meanwhile, the SF Fed Inflation Gauge Index spiked in recent months following adjustments to trade policy.
Therefore, the behavior and the volatility of different asset classes have been impacted, altering global financial conditions. This scenario requires particular caution from emerging market economies amid heightened geopolitical tensions.
Regarding the domestic scenario, the set of indicators on economic activity has shown some moderation in growth, as expected, but the labor market is still showing strength.
The inflation outlook remains challenging in several dimensions. Copom assessed the international scenario, economic activity, aggregate demand, inflation expectations, and current inflation. Copom then discussed inflation projections and expectations before deliberating on the current decision and future communication.
The global environment is more adverse and uncertain. If, on the one hand, the approval of certain trade agreements, along with recent inflation and economic activity data from the U.S., could suggest a reduction in global uncertainty, on the other hand, the U.S. fiscal policy—and, particularly for Brazil, the U.S. trade policy—make the outlook more uncertain and adverse. The increase of tradetariffs by the U.S. to Brazil has significant sectoral impacts and still uncertain aggregate effects that depend on the unfolding of the next steps in the negotiations and the perception of risk inherent to this process. The Committee is closely monitoring the potential impacts on the real economy and financial assets. The prevailing assessment within the Committee is the increased global outlook uncertainty, and, therefore, Copom should maintain a cautious stance. As usual, the Committee will focus on the transmission mechanisms from the external environment to the domestic inflation dynamics and their impact on the outlook.
The domestic economic activity outlook has indicated a certain moderation in growth, while also presenting mixed data across sectors and indicators.
Overall, some moderation in growth is observed, supporting the scenario outlined by the Committee. This moderation, necessary for the widening of the output gap and the convergence of inflation to the target, is aligned with a contractionary monetary policy. Monthly sectoral surveys and more timely consumption data support a gradual slowdown in growth.
The credit market, which is more sensitive to financial conditions, has shown clearer moderation. A decline in non-earmarkedcredit granting and an increase in interest and delinquency rates have been observed. Moreover, regarding householdcredit, there has been an increase in the household debt–service ratio and a deepening of the negative credit flow—that is, households repaying more debt than taking on. It was emphasized during the discussion that some recent measures, such as private payroll-deducted loans, have had less impact than many market participants expected. Given the implementation agenda in this credit line, as well as the effects of introducing and removing taxes on other credit modalities, the Committee believes it should closely monitor upcoming credit data releases.
Fiscal policy has a short-term impact, mainly through stimulating aggregate demand, and a more structural dimension, which has the potential to affect perceptions of debt sustainability and influence the term premium in the yield curve. A fiscal policy that acts counter-cyclically and contributes to reducing the risk premium favors the convergence of inflation to the target. Copom reinforced its view that the slowdown in structural reform efforts and fiscal discipline, the increase in earmarkedcredit, and uncertainties over the public debt stabilization have the potential to raise the economy’s neutral interest rate, with deleterious impacts on the power of monetary policy and, consequently, on the cost of disinflation in terms of activity. The Committee remained firmly convinced that policies must be predictable, credible, and countercyclical. In particular, the Committee’s discussion once again highlighted the need for harmonious fiscal and monetary policy.
Inflation expectations, as measured by different instruments and obtained from various groups of agents, remained above the inflation target at all horizons, maintaining the adverse inflation outlook. For shorter-term horizons, following the release of the most recent data, there has been a decline in inflation expectations. For longer-term horizons, conversely, there has been no significant change in inflation expectations between Copom meetings, even though measures of breakeven inflation extracted from financial assets have declined. The Committee reaffirmed and renewed its commitment to re-anchoring expectations and to conducting a monetary policy that supports such a movement.
De-anchored inflation expectations is a factor of discomfort shared by all Committee members and must be tamed. Copom highlighted that environments with de-anchored expectations increase the disinflation cost in terms of activity. The scenario of inflation convergence to the target becomes more challenging with de-anchored expectations for longer horizons. When discussing this topic, the main conclusion obtained and shared by all members of Copom was that, in an environment of de-anchored expectations—as currently is the case—greater monetary restriction is required for a longer period than would be otherwise appropriate.
The inflation scenario has continued to show downside surprises in recent periods compared with analysts’ forecasts, but inflation has remained above the target Industrial goods inflation, which has already been showing weaker wholesale price pressures, continued to ease in the more recent period. Food prices also displayed slightly weaker-than-expected dynamics. Finally, servicesinflation, which has greater inertia, remains above the level required to meet the inflation target, in a context of a positive output gap. Beyond the changes in items, or even short-term oscillations, the core inflation measures have remained above the value consistent with the target achievement for months, corroborating the interpretation that inflation is pressured by demand and requires a contractionary monetary policy for a very prolonged period.
Copom then addressed the projections. In the reference scenario, the interest rate path is extracted from the Focus survey, and the exchange rate starts at USD/BRL 5.552 and evolves according to the purchasing power parity (PPP). The Committee assumes that oil prices follow approximately the futures market curve for the following six months and then start increasing 2% per year onwards. Moreover, the energy tariff flag is assumed to be “green” in December of the years 2025 and 2026.
In the reference scenario, four-quarter inflation projections for 2025 and for 2026 are 4.9% and 3.6%, respectively (Table 1). For the relevant horizon for monetary policy—2027 Q1—the inflation projection based on the reference scenario extracted from the Focus survey remained at 3.4%, above the inflation target.
Regarding the balance of risks, it was assessed that the scenario of greater uncertainty continues to present higher-than-usual upside and downside inflation risks to the inflation outlook. Copom assessed that, among the upside risks for the inflation outlook and inflation expectations, it should be emphasized (i) a more prolonged period of de-anchoring of inflation expectations; (ii) a stronger-than-expected resilience of servicesinflation due to a more positive output gap; and (iii) a conjunction of internal and external economic policies with a stronger-than-expected inflationary impact, for example, through a persistently more depreciatedcurrency. Among the downside risks, it should be noted (i) a greater-than-projected deceleration of domestic economic activity, impacting the inflation scenario; (ii) a steeper global slowdown stemming from the trade shock and the scenario of heightened uncertainty; and (iii) a reduction in commodity prices with disinflationary effects.
Prospectively, the Committee will continue monitoring the pace of economic activity, which is a fundamental driver of inflation, particularly services inflation; the exchange rate pass-through to inflation, after a process of increased exchange rate volatility; and inflation expectations, which remain de-anchored and are drivers of future inflation behavior. It was emphasized that inflationary vectors remain adverse, such as the economic activity resilience and labor market pressures, de-anchored inflation expectations, and high inflation projections. This scenario prescribes a significantly contractionary monetary policy for a very prolonged period to ensure the convergence of inflation to the target.
Copom then discussed the conduct of monetary policy, considering the set of projections evaluated, as well as the balance of risks for prospective inflation.
Following a swift and firm interest rate hike cycle, the Committee anticipates, as its monetary policy strategy, continuity of the interruption of the rate hiking cycle to observe the effects of the cycle already implemented. It was emphasized that, once the appropriate interest rate is determined, it should remain at a significantly contractionary level for a very prolonged period due to de-anchored expectations. The Committee emphasizes that it will remain vigilant, that future monetary policy steps can be adjusted and that it will not hesitate to proceed with the rate hiking cycle if appropriate.
The Committee has been closely monitoring with particular attention the announcements regarding the imposition by the U.S. of tradetariffs on Brazil, reinforcing its cautious stance in a scenario of heightened uncertainty. Moreover, it continues to monitor how the developments on the fiscal side impact monetary policy and financial assets. The current scenario continues to be marked by de-anchored inflation expectations, high inflation projections, resilience on economic activity, and labor market pressures. Ensuring the convergence of inflation to the target in an environment with de-anchored expectations requires a significantly contractionary monetary policy for a very prolonged period.
Copom decided to maintain the Selic rate at 15.00% p.a., and judges that this decision is consistent with the strategy for inflation convergence to a level around its target throughout the relevant horizon for monetary policy. Without compromising its fundamental objective of ensuring price stability, this decision also implies smoothing economic fluctuations and fostering full employment.
The current scenario, marked by heightened uncertainty, requires a cautious stance in monetary policy. If the expected scenario materializes, the Committee foresees a continuation of the interruption of the rate hiking cycle to examine its yet-to-be-seen cumulative impacts, and then evaluate whether the current interest rate level, assuming it stable for a very prolonged period, will be enough to ensure the convergence of inflation to the target. The Committee emphasizes that it will remain vigilant, that future monetary policy steps can be adjusted and that it will not hesitate to resume the rate hiking cycle if appropriate.
The following members of the Committee voted for this decision: Gabriel Muricca Galípolo (Governor), Ailton de Aquino Santos, Diogo Abry Guillen, Gilneu Francisco Astolfi Vivan, Izabela Moreira Correa, Nilton José Schneider David, Paulo Picchetti, Renato Dias de Brito Gomes, and Rodrigo Alves Teixeira.
Table 1
Inflation projections in the reference scenario Year-over-year IPCA change (%)
1 Unless explicitly stated otherwise, this update considers changes since the June Copom meeting (271st meeting).
2 It corresponds to the rounded value of the average exchange rate observed over the ten working days ending on the last day of the week prior to the Copom meeting, according to the procedure adopted since the 258th meeting.
Meeting information
Date: July 29-30 2025
Place: BCB Headquarters’ meeting rooms on the 8th floor (7/29 and 7/30 on the morning) and 20th floor (7/30 on the afternoon) – Brasilia – DF – Brazil
Starting and ending times:
July 29: 10:07 AM – 11:37 AM; 2:17 PM – 5:51 PM
July 30: 10:10 AM – 11:13 AM; 2:37PM – 6:34 PM
In attendance:
Members of the Copom
Gabriel Muricca Galípolo – Governor
Ailton de Aquino Santos
Diogo Abry Guillen
Gilneu Francisco Astolfi Vivan
Izabela Moreira Correa
Nilton José Schneider David
Paulo Picchetti
Renato Dias de Brito Gomes
Rodrigo Alves Teixeira
Department Heads in charge of technical presentations (attending on July 29 and on the morning of July 30)
André de Oliveira Amante
Open Market Operations Department
Euler Pereira Gonçalves de Mello
Research Department (also attending on the afternoon of 7/30)
Fábio Martins Trajano de Arruda
Department of Banking Operations and Payments System
Luís Guilherme Siciliano Pontes
International Reserves Department
Marcelo Antonio Thomaz de Aragão
Department of International Affairs
Ricardo Sabbadini
Department of Economics
Other participants (attending on July 29 and on the morning of July 30)
Alexandre de Carvalho
Office of Economic Advisor
André Maurício Trindade da Rocha
Head of the Financial System Monitoring Department
Angelo Jose Mont Alverne Duarte
Head of Office of the Deputy Governor for Licensing and Resolution (attending on the mornings of 7/29 and 7/30)
Arnaldo José Giongo Galvão
Press Office Advisor
Cristiano de Oliveira Lopes Cozer
General Counsel
Edson Broxado de França Teixeira
Head of Office of the Deputy Governor for Supervision
Eduardo José Araújo Lima
Head of Office of the Deputy Governor for Economic Policy
Fernando Alberto G. Sampaio C. Rocha
Head of the Department of Statistics
Isabela Ribeiro Damaso Maia
Head of the Sustainability and International Portfolio Investors Unit (attending on the mornings of 7/29 and 7/30)
Julio Cesar Costa Pinto
Head of Office of the Governor
Laura Soledad Cutruffo Comparini
Deputy Head of the Department of Economics
Leonardo Martins Nogueira
Head of Office of the Deputy Governor for Monetary Policy
Marcos Ribeiro de Castro
Deputy Head of the Research Department
Mardilson Fernandes Queiroz
Head of the Financial System Regulation Department
Olavo Lins Romano Pereira
Deputy Head of the Department of International Affairs
Renata Modesto Barreto
Deputy Head of the Department of Banking Operations and Payments System
Ricardo da Costa Martinelli
Deputy Head of the International Reserves Department
Ricardo Eyer Harris
Head of Office of the Deputy Governor for Regulation
Ricardo Franco Moura
Head of the Prudential and Foreign Exchange Regulation Department
Rogerio Antonio Lucca
Executive Secretary
Simone Miranda Burello
Advisor in the Office of the Deputy Governor for Monetary Policy