The EU as a Global Actor
Kicking off a new CGD series of policy proposals to inform the European Union’s upcoming development agenda, Mikaela Gavas and W. Gyude Moore suggest a reset of the EU’s international relations narrative. Explore their ideas for how the EU can position itself as a global development player while staying true to its values and focusing on the common good.
Read the full article [archived PDF].
Is There Any Hope for Bipartisan Cooperation on Aid in 2025?
by Charles Kenny, July 15, 2024 (CGD Blog Post)
The gap between parties on international economic policy is often smaller than the gap between consensus positions over time. While the Biden administration has introduced migrant-supporting measures including relief for the undocumented spouses of citizens and community sponsorship of refugees, both parties are far tougher on asylum seekers than Obama or Bush were. Back in the 1990s, President Bill Clinton signed NAFTA, which made it through Congress relying on considerable Republican support. Today, President Trump’s trade war with China has been expanded by President Biden and the tariffs first imposed by President Trump are openly backed by many Congressional Democrats. Again, there is now strong bipartisan agreement that a considerable focus of US overseas investment support ought to be countering China, with Democratic appointees leading the charge for greater flexibility in the US International Development Finance Corporation’s development mandate set during the last Republican administration.
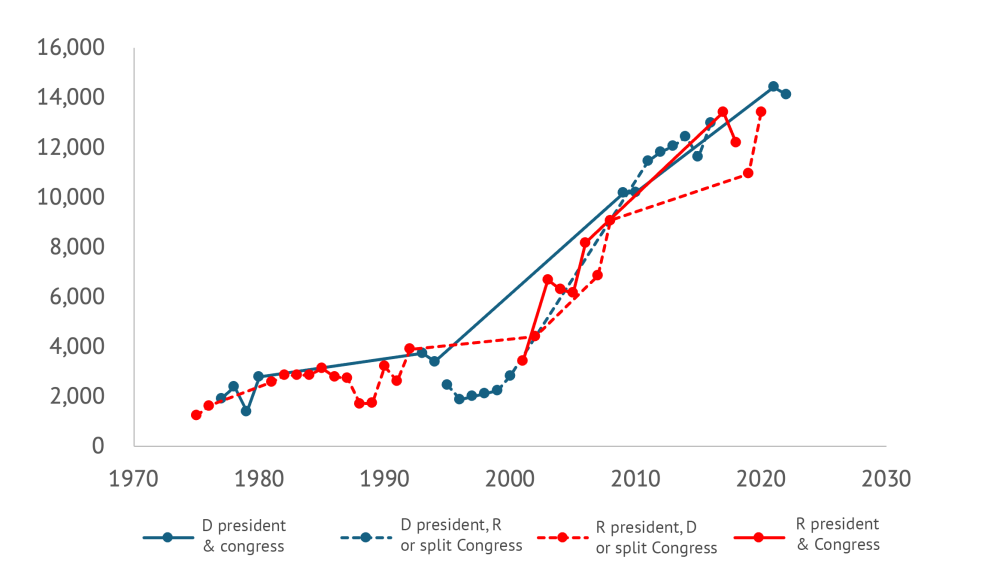
The same applies to aid flows. The figure below shows data on total aid disbursements from the US depending on who is in power: the solid blue line is Democratic control of the presidency and both branches of Congress, the blue dashed line is Democratic control of the presidency and one or neither branch, the solid red line is Republican control of the presidency and both chambers, and the red dashed line is control of the presidency and one or neither chamber. There’s only one data point for each year, of course, but the lines connect between them. The broad picture strongly suggests the trend matters more than who is in power (indeed, remember the Surprise Party?).
Figure 1: US aid disbursements by party control (Current $m)
The potential good news from this is that despite substantive disagreements over topics including the Mexico City Policy, bipartisan cooperation on aid might still be more possible than it might appear from a close-up perspective in the midst of partisan rancor. To repeat the bad news: much of the recent bipartisan movement on foreign economic policy has been to the detriment of developing countries. And there is certainly some talk of sweeping changes, including cuts, that might mean the past is no guide. But perhaps there still space for elements of a positive agenda around aid for the legislative sessions of next year, one that could appeal to at least some people on both sides of the aisle. Examples might include:
Advancing localization: Spending more US aid finance in recipient countries rather than on US contractors has been a hallmark of Samantha Power’s tenure at USAID. But it has Republican antecedents. The Trump administration followed a localization strategy for PEPFAR that significantly increased the number of local partners and a New Partnerships Initiative at USAID designed in part to do the same. And in 2021, US Senators Marco Rubio (R–FL) and Tim Kaine (D–VA) introduced legislation to reduce red tape for local organizations seeking USAID funds. It would be great to see further cooperation on ensuring more development dollars are actually spent in developing countries.
Country focus: All else even somewhat equal, a dollar of foreign assistance simply has a larger impact in poorer countries. The logic that richer countries should be able to look after themselves was a justification for the Trump administration’s “Journey to Self-Reliance”—a philosophy dedicated toward “ending the need for aid.” The Biden administration has continued to produce the “country roadmaps” designed to chart the journey. It would be great to see bipartisan efforts to focus grant resources in particular where they’ll have the greatest impact—in the poorest countries.
Sovereign lending and guarantees: While grants should be focused on poorer countries, loans could be an effective and comparatively low-cost tool to support wealthier countries. The recently passed Ukraine aid package provided resources in the form of partially forgivable loans, and senior Republicans have been pushing the model more widely. More lending and guarantees could be a powerful tool to support infrastructure rollout in middle-income countries. And strengthening the US sovereign loan guarantee program could back development and national security goals at a considerably lower cost than grant-based programs.
MCC reform: The Millennium Challenge Corporation, created during the George W. Bush administration, is running into pipeline challenges—and appropriators have clawed back funding in response. That’s a shame. It is a small but effective aid agency providing resources for development priorities including infrastructure and working with client countries to help them deliver—in fact, it’s a model of successful localization. MCC faces spending challenges in part because it hasn’t increased the size of individual country operations, limits repeat operations, and can only work in countries that pass its “scorecard” of development indicators. The agency wants to address its partner problem by working in richer countries. That’s a sad way to achieve impact and goes against the bipartisan principle that richer developing countries should be weaned off aid flows, not given more. Altering the size of compacts, allowing more repeat compacts, and moving away from a scorecard model towards a model of reward for reform—a specific set of policy changes that need to be completed before funds start flowing—would be a far more effective approach.
Fighting malaria: In the 1958 State of the Union, President Eisenhower said that the US would lead a global effort to eradicate malaria. The time and the tools were not right then, but today there is far greater hope for rapid progress against the disease. George Bush created the President’s Malaria Initiative in 2005, and the US has been a vital contributor to the global fight against the parasite since then. With the arrival of new vaccines in the past couple of years, we could accelerate progress and save hundreds of thousands of children’s lives each year. And with better vaccines, we could move even faster. PEPFAR, the US initiative to provide HIV drugs, has transformed the battle against AIDS worldwide. A similar bipartisan initiative could achieve as much with malaria.
Transparency: Both parties have shown commitment to increasing the transparency of aid finance including around subawards and indirect cost rate data. It would be great if there was a bipartisan consensus on simply publishing all aid contracts.
Beyond aid, the African Growth and Opportunity Act was first passed during the Clinton administration, renewed during the Bush administration and then again under the Obama administration. A bipartisan proposal to renew the trade package once more was launched in the Senate in April this year. Perhaps AGOA could be made even bigger and better. Even amidst partisan rancor, there is plenty a Congress and administration could do to improve US relations with and support to low- and middle-income countries next year.
Undoing Gender Inequality Traps in the Financial Sector: The Case of Colombia
by Mayra Buvinic and Alba Loureiro, July 9, 2024 (CGD Blog Post)
Gender data is needed to gauge the extent to which financial services include and benefit women. However, sex-disaggregated data that tracks access to and use of financial services is still hard to come by, and it is especially rare to have country-level data that captures the universe of financial sector providers (FSPs) and is published on a regular basis.
A notable exception is Colombia, where Banca de Oportunidades (BdO), a public sector technical assistance and advocacy platform, compiles in a centralized data platform anonymized data from all FSPs in partnership with Colombia’s Superintendency of Banks. The 2023 edition, the 13th annual publication, reports on 15 million transactions, 60 percent of them monetary, from the universe of banks, credit and savings cooperatives, microfinance institutions, and fintechs. The report tells a sobering story worth highlighting of the trajectory of women’s financial inclusion because it mirrors much of what we know [archived PDF] about the constraints women face having access to financial services in low- and middle-income countries. The report’s numbers [archived PDF] suggest that:
Expanding access is not enough
Despite almost universal access to financial products, gender gaps persist. In 2023, 19 out of every 20 adult Colombians (or 94.6 percent) reported access to at least one financial product or service. However, women faced less favorable conditions (see below), underscoring that mere access is insufficient.
Gender gaps are evident in both savings and credit
In 2023, women had 6.5 and 3.7 percentage points (pp) lower access to savings and credit, respectively, than men. While women’s access to savings increased over time–from 75 percent in 2018 to 90.4 percent in 2023–the gender gap widened (from 4.3 pp to 6.5 pp). In the same period, the gender gap in credit narrowed slightly (from 4.8 pp to 3.7 pp) but both men’s and women’s access to credit decreased–for women from 37.7 percent in 2018 to 33.4 percent in 2023.
Women face access to credit in less favorable conditions than men
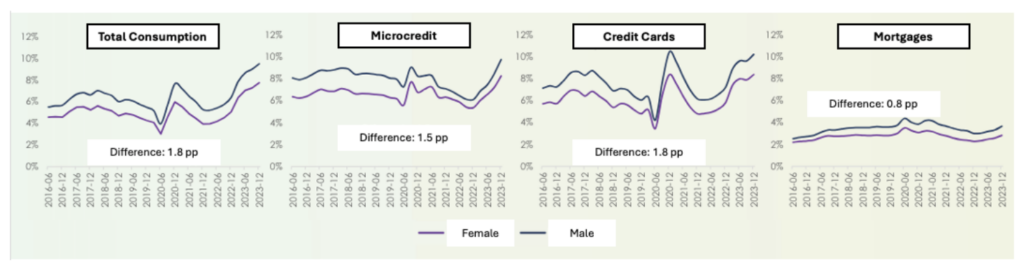
Interest rates are higher for women clients across all loan types, and highest for microcredit–with a 5.4 percent gender gap–which women access more than men. In 2023, women accessed 1,029 million and men accessed 857,000 microcredit loans. More men than women accessed commercial loans (20,000 versus 14,000 loans) while housing loans went equally to women and men.
Paradoxically, these less favorable conditions coexist with women exhibiting lower credit risks than men
Women have better repayment rates than men across loan types (Figure 1). Women also perform better across insurance products, except for microinsurance, showing lower accident rates. However, female clients have 13.8 pp lower access to insurance products than men.
Figure 1: Total Repayment Rates, Overdue More Than 30 Days.
The data implies that women’s good financial behavior is penalized rather than prized, with higher interest rates and lower access to financial products
This is partly the result of gender biases that affect both the demand and supply of credit and lead to rationing credit to women.
Rationing credit and other financial services to women perpetuates ‘gender inequality traps’ leading to further rationing
It all starts with women having fewer assets to use as collateral and lower earnings than men (a commonplace fact across financial markets everywhere) which leads them to qualify for smaller loans. In turn, this results in women having less access to credit to increase earnings because of the high costs to lenders of serving customers with small loans, resulting in even lower earnings.
Gender biases that affect the supply and demand for credit reinforce this vicious cycle
Results from five clever experiments in Colombia done by BdO in collaboration with the Development Bank of Latin America and the Caribbean (CAF) suggest how easily these gender biases reinforce each other:
- On the supply side, there are cognitive and perceptual biases (the latter detected by eye-tracking) from financial sector providers–male potential borrowers are ‘ex-ante’ perceived as having higher earnings than similar women. And female bank agents are stricter at evaluating female clients than male clients.
- On the demand side, the incorrect assumption that women are higher credit risks than men is reinforced by female clients’ own lower self-confidence and greater self-exclusion from financial services: women do not apply for credit because they anticipate they will be rejected because they have lower earnings.
Not surprisingly perhaps, women in Colombia score lower than men in a financial health indicator–with an average score of 4.9 for women and 5.6 for men measured in a 0 to10 scale (scored by BdO using data from the 2022 edition of the survey).
To overcome these gender inequality traps, only a combination of strategies will work
Solutions must address both demand– and supply-side constraints and include:
- Expand access to financial services to all by lowering the costs of serving small and micro borrowers, including women–as a recently announced collaboration between the Bill and Melinda Gates Foundation, the European Investment Bank, and KCB Bank Kenya seeks to pilot in Kenya by lowering the costs of loans to female micro borrowers through digital technology and data, and risk-sharing.
- Increase women’s self-confidence and combat their self-exclusion from financial services with credit ‘plus’ interventions that include ‘soft skills’ training.
- Provide customized products that fit women’s needs, including importantly insurance and microinsurance that respond to women’s greater need for mitigating (family) risks.
- Combat supply-side biases that lead to inefficiencies and exclusions, including incentives to financial sector providers to reach women with financial services.
- For the above, collect and publish gender data, but data that does not end up sitting on a shelf gathering dust; data that instead is used to make management decisions, which underscores the role of public sector institutions such as BdO in collaborating with and incentivizing financial sector providers, and in measuring, tracking, and reporting progress in financial inclusion.
Fortunately, there is a growing wealth of research that backs up the solutions suggested above. But there is still an important practical research agenda ahead:
- First is reaching the poorest and excluded with financial services that they may need. In the case of Colombia, this includes indigenous and Afro-descendent populations in geographically distant regions of the country. This requires building further granularity in the financial inclusion data, following guidelines of intersectionality data in development.
- There is substantial research on demand-side constraints in women’s access to financial services. There is comparatively little research on supply-side gender biases and solutions to these biases that can be scaled.
- Lastly, there is the task of developing financial health indicators that can be easily and widely used disaggregated by gender and other demographic features to monitor an important development outcome from increasing financial access to all.
Disclaimer
CGD blog posts reflect the views of the authors, drawing on prior research and experience in their areas of expertise. CGD is a nonpartisan, independent organization and does not take institutional positions.