Japan-Watching: Machinery Orders in August, 2026

[from Japan’s Cabinet Office (内閣府) Economic and Social Research]

Results

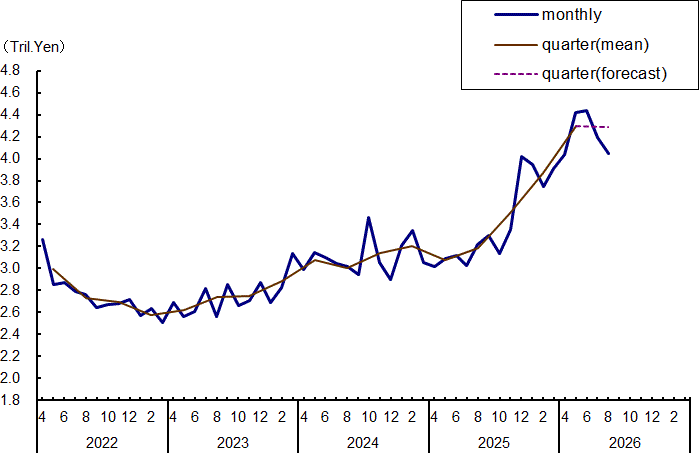
  1. The total value of machinery orders received by 280 manufacturers operating in Japan decreased by 3.7% in August from the previous month on a seasonally adjusted basis.
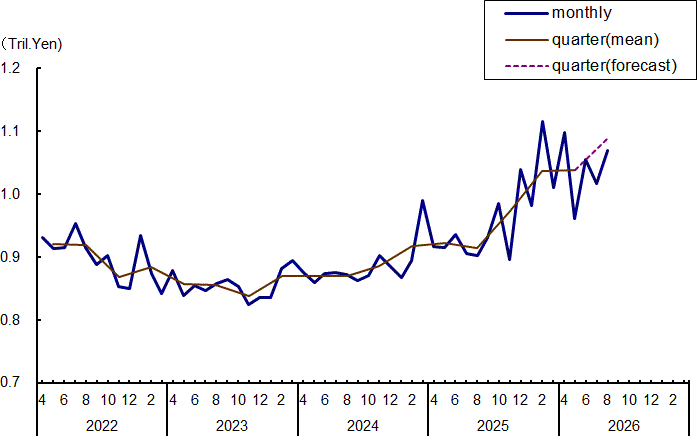
  2. Private-sector machinery orders, excluding volatile ones for ships and those from electric power companies, increased a seasonally adjusted by 5.2% in August.

Percentage change from previous quarter (month)

(%)

2025
Jul-Sep
Oct-Dec2026
Jan-Mar
Apr-JunJul-Sep
(forecast)
2026
May
JunJulAug
Total3.510.210.311.3-0.19.50.4-5.5-3.7
private sector-1.36.22.614.6-3.837.4-26.01.5-4.2
(exc. volatile orders)-1.06.66.40.24.9-12.49.7-3.75.2
manufacturing5.3-0.810.0-1.34.0-14.919.9-1.01.6
non-manufacturing (exc. volatile orders)-4.411.36.2-2.35.9-9.34.5-2.62.9
governments-14.757.7-21.3-17.828.5-5.010.5-9.2-6.1
from overseas14.53.631.010.41.3-4.419.9-8.2-7.7
through agencies0.32.64.86.711.1-5.87.21.3-6.3

Note

  1. Seasonally adjusted series. As all series are seasonally adjusted individually, a sum of seasonally adjusted individual/component series does not equal to seasonally adjusted totals.
  2. Volatile orders: Orders for ships and those from electric power companies.

References

Chart 1: Total Value of Machinery Orders

Chart 2: Private Sector (excluding volatile orders)

Table 1: Machinery Orders by Sectors

(billion Yen %)

2025
Jul-Sep
Oct-Dec2026
Jan-Mar
Apr-JunJul-Sep
(forecast)
2026
May
JunJulAug
Total9,543.6
(3.5)
[6.1]
10,514.8
(10.2)
[13.5]
11,593.0
(10.3)
[23.5]
12,900.0
(11.3)
[39.4]
12,881.0
(-0.1)
[36.7]
4,422.2
(9.5)
[40.4]
4,439.0
(0.4)
[43.7]
4,195.7
(-5.5)
[36.8]
4,041.9
(-3.7)
[26.1]
private sector3,370.6
(-1.3)
[12.9]
3,580.8
(6.2)
[11.2]
3,674.3
(2.6)
[11.6]
4,210.8
(14.6)
[22.4]
4,051.2
(-3.8)
[21.0]
1,706.2
(37.4)
[40.8]
1,262.6
(-26.0)
[12.7]
1,281.3
(1.5)
[10.3]
1,226.9
(-4.2)
[13.8]
(exc. volatile orders)2,741.4
(-1.0)
[6.6]
2,921.6
(6.6)
[8.1]
3,109.2
(6.4)
[12.6]
3,116.2
(0.2)
[10.8]
3,268.6
(4.9)
[19.9]
962.0
(-12.4)
[-1.9]
1,055.8
(9.7)
[16.9]
1,016.9
(-3.7)
[11.2]
1,069.8
(5.2)
[18.6]
manufacturing1,369.3
(5.3)
[14.0]
1,357.8
(-0.8)
[3.9]
1,493.7
(10.0)
[14.8]
1,474.8
(-1.3)
[12.5]
1,534.0
(4.0)
[12.6]
437.2
(-14.9)
[-4.7]
524.1
(19.9)
[27.4]
518.6
(-1.0)
[20.5]
527.0
(1.6)
[23.5]
non-manufacturing (exc. volatile orders)1,409.5
(-4.4)
[1.5]
1,568.1
(11.3)
[12.0]
1,666.0
(62)
[12.5]
1,627.2
(-2.3)
[9.6]
1,723.8
(5.9)
[25.6]
516.9
(-9.3)
[0.9]
540.2
(4.5)
[8.5]
525.9
(-2.6)
[5.7]
541.3
(2.9)
[10.8]
governments1,159.4
(-14.7)
[-22.7]
1,828.8
(57.7)
[-4.4]
1,439.2
(-21.3)
[-18.6]
1,183.4
(-17.8)
[-13.2]
1,521.2
(28.5)
[33.4]
374.7
(-5.0)
[-24.9]
414.2
(10.5)
[-7.3]
376.2
(-9.2)
[-25.8]
353.3
(-6.1)
[8.1]
from overseas4,624.3
(14.5)
[10.3]
4,789.4
(3.6)
[22.3]
6,275.3
(31.0)
[57.2]
6.928.8
(10.4)
[71.1]
7.016.5
(1.3)
[55.6]
2,135.5
(-4.4)
[62.2]
2,559.6
(19.9)
[83.8]
2,350.2
(-8.2)
[81.5]
2,168.7
(-7.7)
[36.9]
through agencies410.6
(0.3)
[9.1]
421.3
(2.6)
[13.1]
441.3
(4.8)
[18.7]
470.7
(6.7)
[13.7]
522.7
(11.1)
[24.7]
150.2
(-5.8)
[0.4]
161.0
(7.2)
[16.1]
163.1
(1.3)
[12.1]
152.8
(-6.3)
[17.4]

Notes

  1. Seasonally adjusted series. As all series are seasonally adjusted individually, a sum of seasonally adjusted individual/component series does not equal to seasonally adjusted totals.
  2. Figures in () represent the percentage change from the previous quarter (month). Figures in [] are the percentage change from the corresponding quarter (month) of the previous year in original series.
  3. Volatile orders: Orders for ships and those from electric power companies.

Table 2:

2025
Jul-Sep
Oct-Dec2026
Jan-Mar
Apr-Jun2026
May
JunJulAug
Manufacturing5.3-0.810.0-1.3-14.919.9-1.01.6
1. Foods and beverages-72-0.911.0-2.1-13.227.3-11.60.1
2. Textile mill products12.3-3.1-12.526.13.8-14.3-7.0-18.6
3. Pulp, paper and paper products5.09.4-7.9-2.514.35.465.2-33.2
4. Chemical and chemical products9.5-37.542.7-21.719.239.0-12.0-11.5
5. Petroleum and coal products-36.366.7-53.4-2.57.132.94.819.6
6. Ceramic, stone and clay products31.2-7.19.515.7-13.33.26.1-23.0
7. Iron and steel22.6-11.521.5-21.5-5.3-10.85.8-36.3
8. Non-ferrous metals-5.2-0.226.1-16.019.5225.3-82.2132.6
9. Fabricated metal products-6.9-5.716.448.313.8-46.113.2-10.7
10. General-purpose and production machinery7.1-4.111.0-0.8-10.318.9-1.49.3
11. Business-oriented machinery-11.52.48.219.9-14.33.2-7.2-5.7
12. Electrical machinery-6.310.3-3.020.2-12.02.246.1-5.9
13. Information and communication electronics22.3-8.611.915.1-23.629.74.713.0
14. Automobiles, parts and accessories3.8-0.813.6-0.57.46.91.513.1
15. Ship building18.8-25.765.73.9-80.594.988.9-41.0
16. Other transport equipment-4.55.936.4-11.467.14.7-41.443.7
17. Other manufacturing-1.59.9-4.2-4.6-10.2-0.6-1.36.1
Non-manufacturing-2.410.3-1.524.168.0-40.40.8-5.7
18. Agriculture, forestry and fishing10.412.20.5-23.2-24.233.011.0-4.0
19. Mining, quarrying of stone and gravel-8.4-6.93.0-24.120.723.76.725.0
20. Construction-3.18.34.09.31.6-8.55.8-17.2
21. Electricity supply1.0-1.50.291.7342.9-75.134.2-34.9
22. Transportation and postal activities7.00.1-15.85.5-23.38.93.3-13.9
23. Telecommunications-16.818.8-0.814.6-7.522.3-23.216.9
24. Wholesale and retail trade4.8-2.44.13.4-3.1-3.1-3.929.2
25. Finance and insurance-6.39.38.5-2.7-10.617.9-6.80.2
26. Real estate-20.94.714.139.7-69.3253.1-26.40.7
27. Information services-6.47.725.1-11.8-8.916.0-16.97.9
28. Goods leasing14.3-12.810.1-16.6-18.6-0.9-6.8136.0
29. Other non-manufacturing-2.541.5-2.8-5.234.9-26.620.1-28.0

Note

Percentage change from previous quarter (month) in seasonally adjusted series.

Japan Inc. Now Sells No Yen to Invest Abroad

Earnings on Japan’s foreign direct investment (FDI) reached 103% of new FDI in 2022–25. With dividends and retained earnings counted together, Japan Inc. now needs to sell little yen to invest abroad.

[by OKUBO Takuji]

Key takeaways

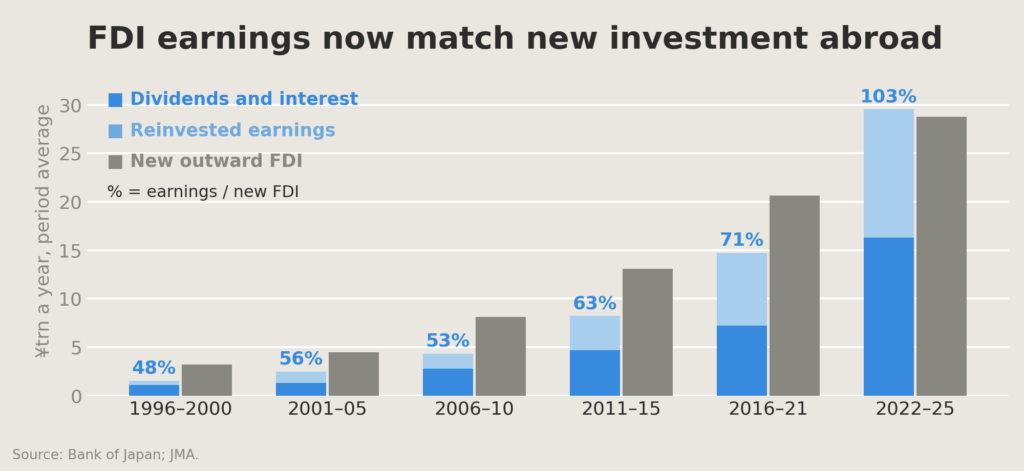
  • Foreign affiliates now earn about as much as Japan invests abroad each year. Reinvested earnings, dividends and interest together reached 103% of new outward FDI in 2022–25, against 48% in 1996–2000.
  • Dividends from foreign affiliates account for a growing share of Japanese corporate profit. We estimate that foreign affiliates contributed 13.4% of Japan Inc.’s earnings in FY2025, up from 1.7% in FY1996.
  • Corporate investment abroad now involves little net yen selling. After dividends and interest paid home, the estimated outflow has been close to zero since 2022, down from about ¥5 trillion a year, or about 1% of GDP, on average in the 2010s.

Japan’s FDI stock now earns 103% of new investment

It is often said that Japan’s ageing population and slow growth give its companies too few investment opportunities at home. A Japanese government report in 2024 included the following passages.

“Japan’s ageing and shrinking population depresses expected demand at home. Expected returns remain higher abroad, so Japanese companies have accelerated outward direct investment” (my translation). — MATSUBAYASHI Yōichi [松林 洋一], MOF PRI, chapter 8, p.136.

“Companies invested abroad because they saw no promising investments in Japan; they are unlikely to bring back every return. On a cash-flow basis, the external balance is in deficit and is one factor behind the weak yen” (my translation). — KARAKAMA Daisuke [唐鎌 大輔], MOF PRI, chapter 10, pp.178 and 175.

However, my review of recent data shows that while their premise of low growth prospects in Japan is probably still right, the direct investment Japan has accumulated abroad has reached a level where it earns enough to cover Japan’s new investment abroad. This changes the exchange-rate implication even if Japan keeps investing abroad.

As chart 1 shows, earnings on the accumulated investment stock rose from 48% of new outward FDI in 1996–2000 to 103% in 2022–25.

Chart 1

Overseas affiliates pay interest and dividends to their parent companies in Japan. Those dividends have become a sizable part of corporate Japan’s income: we estimate that they made up 13.4% of Japanese corporate profit in FY2025, up from 1.7% in FY1996.

When foreign affiliates retain their earnings on their balance sheets, Japan’s balance of payments statistics record them as FDI from Japan, even though no money crosses the border. While the companies receiving FDI dividends and the companies paying for new FDI are not necessarily the same, Japan Inc. as a whole is now financing its FDI almost entirely from the earnings of its overseas affiliates. At the current level of FDI, little new yen needs to be converted into foreign currencies as Japan goes about investing abroad.

In the rest of this report, I explain how foreign direct investment by Japanese companies evolved, and its near-term outlook. This report is the third in a series on the yen repatriation theme that I have published over the past few weeks, following “Yen Repatriation Starts with the Whale”, on capital flows through Japan’s national pension funds, and “Mrs Watanabe No More”, on Japanese households’ assets invested abroad.

A strong yen helped drive Japan’s first outward FDI boom

Japan’s outward investment was heavily restricted after WWII, requiring case-by-case permission from the government. Approvals became more and more automatic over the years until outward investment became “free in principle” in 1980. Trade friction with the US-led Japanese carmakers to restrain their exports from 1981, pushing them to build factories abroad. The rapid appreciation of the yen was also a factor. The yen strengthened from ¥242 per dollar before the Plaza Accord in September 1985 to ¥121 by the end of 1987. Japanese producers had to move lower value-added work abroad. The strong yen also gave Japanese financial institutions sizable purchasing power for a while, until the stock and property bubbles burst in 1990 and 1991.

All of these factors contributed to a rapid increase in outward FDI through the 1980s and 1990s (chart 2).

Chart 2

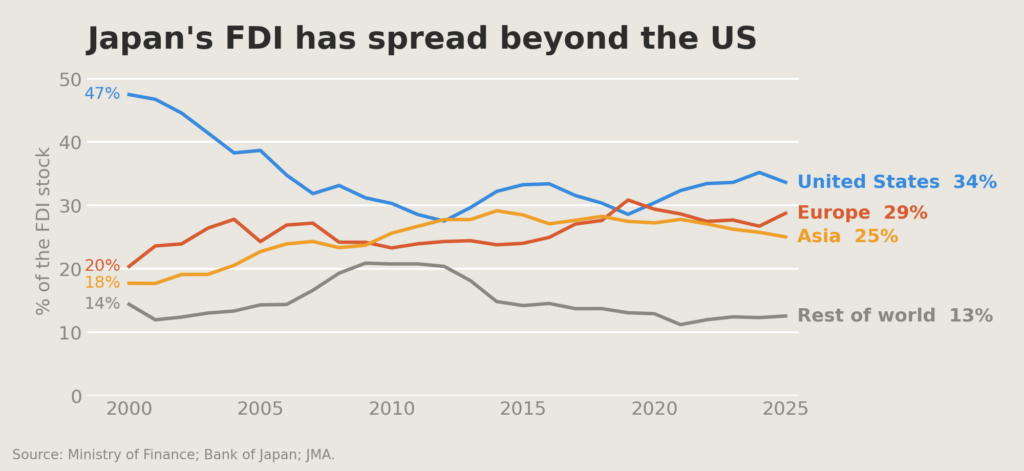
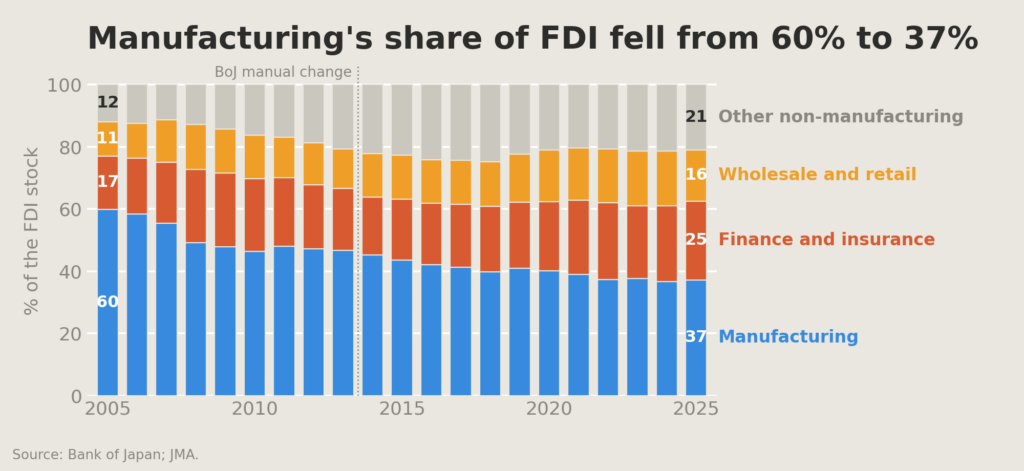
Even after the bubble burst, the strong yen kept pushing manufacturers to move abroad. In 2005, manufacturers accounted for 60% of the FDI stock. As Japanese manufacturers expanded their supply chains abroad, Asia’s share of outward FDI rose from about 12% in FY1986–90 to 19% in FY1995–99, and Asia held 23% of the FDI stock by 2005 (chart 3).

Chart 3

Japan’s outward FDI stock rose to 56% of GDP

The next phase was sustained by a different pressure. With weak growth and low interest rates at home, Japan Inc. kept investing abroad, across a broader range of industries. Between 1995 and 2025, the stock of FDI rose from 9% of Japan’s GDP to 58% (chart 4). In 2025, it is as large as about 38% of the private sector’s domestic fixed capital, on our estimate.

Chart 4

By industry composition and by destination compositions changed over time. Manufacturing’s share of the FDI stock had fallen to 37% by 2025, giving Japan’s FDI more breadth. By destination, we are seeing a revival of FDI toward the United States. It accounted for 34% of the stock in 2025, Europe 29% and Asia 25% (see earlier chart 3).

Thus, after decades of overseas investment, Japan’s FDI stock is now large enough that its earnings are sufficient to finance new investment abroad, at least for now. In the next section, I consider whether this will continue, and in particular whether Japanese companies may bring an even larger share of their overseas earnings back to Japan, given the weak yen, higher borrowing costs in yen and possibly better investment opportunities at home.

The weak yen has slowed offshoring, not reversed it

The real depreciation of the yen over the past 15 years made production in Japan more competitive. There is some evidence that manufacturers are considering bringing production back to Japan. The 2023 manufacturing white paper found more firms shifting production back from China than moving there, and they named the weak yen as one reason. We see some signs of reshoring. Japanese manufacturers’ overseas production ratio rose from 18.0% in FY2011 to 27.2% in FY2023, but it may have started to decline or at least stabilize. The ratio fell to 26.7% in FY2024. A Cabinet Office survey of listed manufacturers puts the ratio at 24.5% in FY2025, and their plan for FY2030 is broadly unchanged at 24.7%. The weak yen seems to have stabilized the wave of offshoring, but I see no firm evidence of a move back onshore yet.

Domestic investment has grown slowly despite the weak yen

There are tentative signs that domestic capital spending is starting to grow again. For three decades it grew at a very low speed. In real terms, private business investment rose only 26% between FY1997 and FY2025, less than 1% a year. In comparison, capital spending grew by about 4% a year on average in the United States. In my view, a weak currency is only one of the factors manufacturers weigh in designing their global production chains. The weak yen makes production in Japan competitive today, but they have also seen the exchange rate swing violently within short periods. Japan also has a shrinking population problem. It started to address it by opening a door to immigration, but the door is only tentatively open. Overall, my view is that the weak yen alone is unlikely to give Japan Inc. sufficient incentive to bring its capital back to Japan and to the yen.

Economic security is bringing some production home

The government is pushing harder than the currency, mostly in the name of economic security, even before the Takaichi government came along. The government currently has a ¥250 trillion domestic investment target for FY2040 and named AI and semiconductors among its 17 strategic fields. Semiconductors are where the money has gone furthest. In November 2024, under the Ishiba government, Japan committed more than ¥10 trillion of public support to AI and semiconductors by FY2030, aiming to draw more than ¥50 trillion of public and private investment over ten years. Japan managed to lure a TSMC plant to Japan, backed by a sizable subsidy. Rapidus, a government-supported Japanese semiconductor maker, has received a sizable subsidy and is building a factory in Hokkaido. Japan’s production of integrated circuits and discrete semiconductors rose from ¥2.7 trillion in 2019 to ¥4.1 trillion in 2025.

Under the name of economic security, the Japanese government is promoting other industries such as batteries, shipbuilding and pharmaceuticals. Defence spending adds to the push. Japan’s defence budget rose from about ¥5 trillion in FY2022 to ¥9.0 trillion in FY2026. Some defence contractors, such as Mitsubishi Heavy Industries, have doubled their defence revenue.

Japan’s industrial-policy record gives reason for caution

The Japanese government and the Ministry of Economy, Trade and Industry (METI), the key agency behind Japan’s industry policy, may claim some expertise in their industrial policies. Empirical studies in the past paint a poor track record, though. Rapidus, the most ambitious semiconductor project, has had no independent cost-benefit assessment (Negrine et al., 2025). While defence and economic security-driven policies have a different logic, I doubt that these industrial policies will succeed in bringing large-scale manufacturing investment back to Japan so long as macro factors such as Japan’s demography remain unfavourable.

FDI no longer appears to drive yen weakness

The weak yen and non-economic geopolitical factors do point to a halt in Japan’s four-decade offshoring trend, although it is a stabilization, rather than an economy-wide reversal of past offshoring. Japan Inc. will continue to invest more abroad, rather than within its borders. Given the sizable growth in the stock of cumulative FDI, Japan Inc. no longer needs to convert yen into overseas currency to keep investing abroad though. Net of dividends and interest paid home, Japan’s FDI sold about ¥5 trillion of yen a year, or about 1% of GDP, on average in the 2010s; since 2022 the net flow has been close to zero. There is also an interesting development in an effort to allow more share-exchange based M&A for cross-border deals that will further reduce the need for Japanese companies to spend their yen to purchase overseas assets. In my view, Japan Inc.’s FDI is no longer a factor to drive the yen weaker.

References

Japan-Watching: Yen Repatriation Starts with the Whale

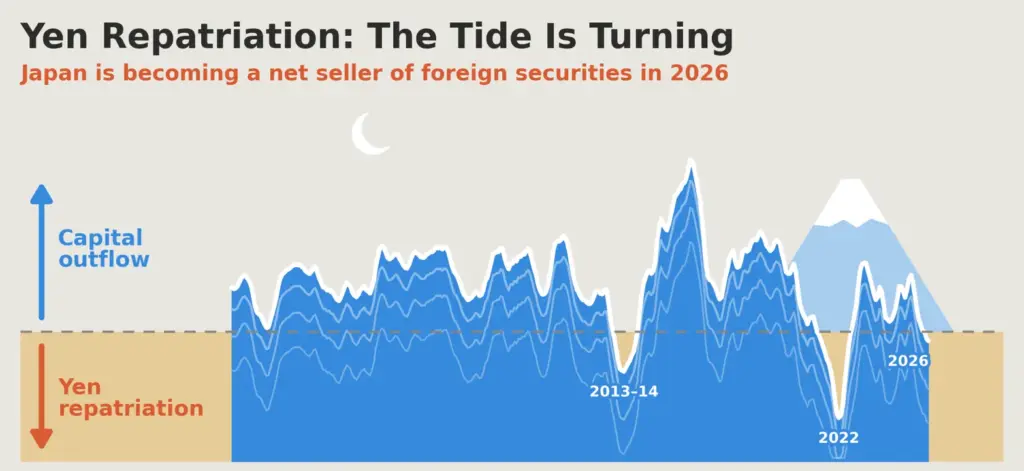
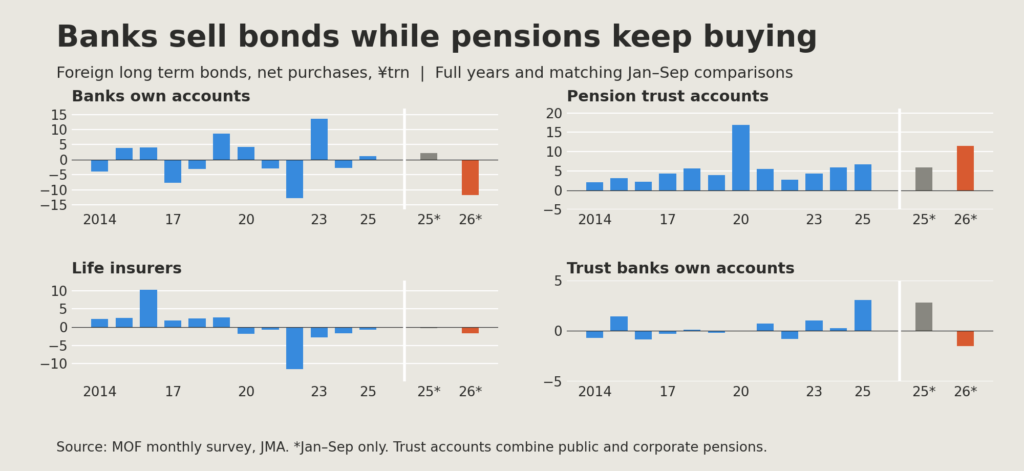
GPIF, one of the largest national pension funds in the world, is likely to rebalance its assets from non-yen bonds to yen bonds, signaling a big turn in Japan’s cross-border capital flows.

[from Japan Macro Advisors, 10 September, 2026]

Key takeaways

  • In 2013, GPIF’s investment committee, chaired by UEDA Kazuo [植田和男], now the BoJ governor, saw a fair chance of a JGB crash within five to ten years. Its CEO priced the crash as the 10-year rising from 0.5% to 3%. Subsequently, GPIF cut its target weight for domestic bonds from 60% to 25% as an emergency measure against abnormally low yields.
  • The 10-year is now at 3%. On my replication of GPIF’s own allocation rule, a real return on JGBs near zero points to a 50% weight in domestic bonds, against 25% today. I expect GPIF to raise the weight, if it has not already started in the September quarter.
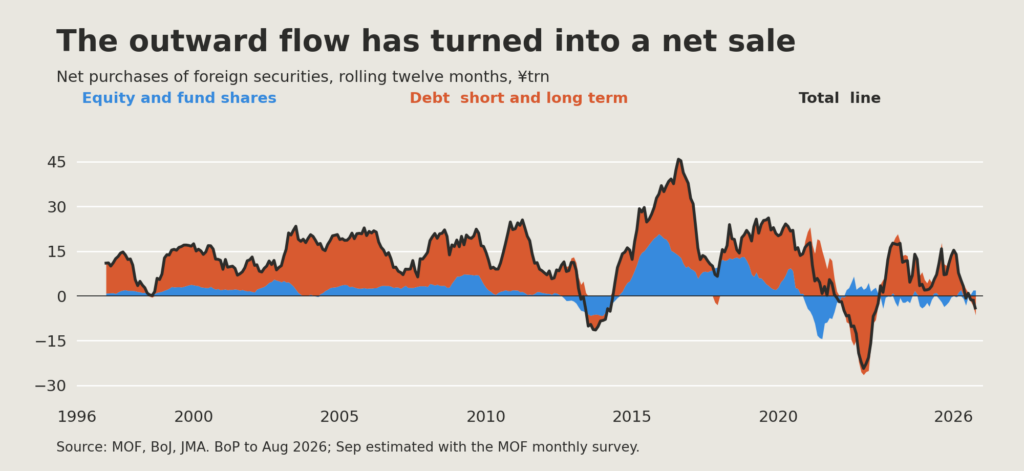
  • How GPIF decides its asset allocation and communicates it publicly is a very delicate and political issue. But regardless of how it communicates it, a change in asset allocation is inevitable. In my view, it signifies a big turn in Japan’s cross-border capital flows.

Japan has one of the Largest Pension Funds in the World

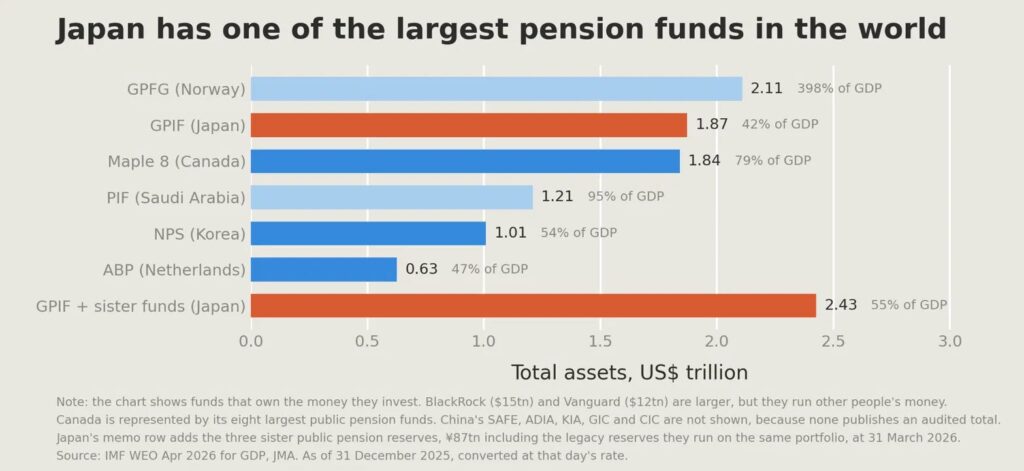
Japan has the second largest public pension fund in the world. Norway’s is the biggest, although it is not strictly a pension fund. Canada’s pension funds, when all eight of its variants are added together, come a close third.

Japan set up its first national pension fund in 1961 and it has since gone through various reforms and reorganization over the last 65 years. Its current form is called the Government Pension Investment Fund (GPIF). As explained in a later section, GPIF has a few siblings, and when we add them together, Japan’s public pension funds can be said to be the largest in the world.

Chart 1

GPIF used to invest most of its asset into JGBs

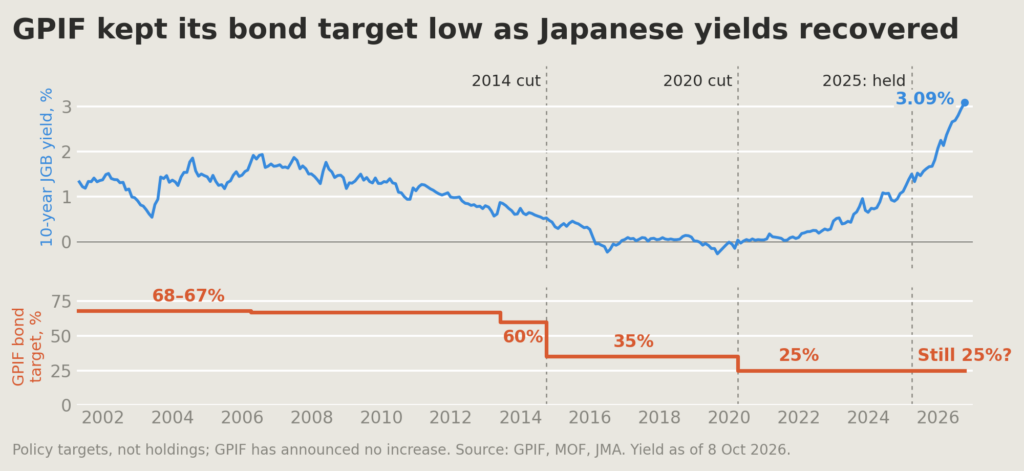
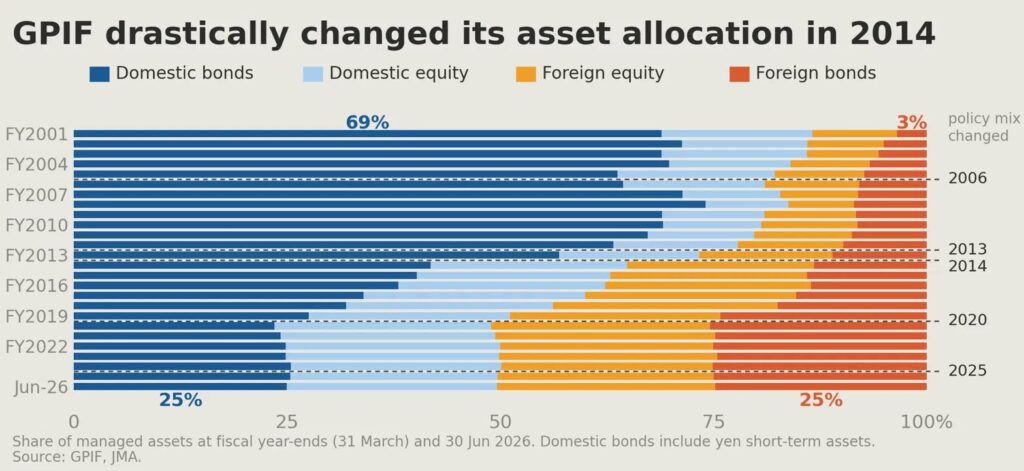
GPIF used to invest the majority of its fund as loans to the national government and into Japanese government bonds (JGBs). At the end of FY2012, 62% of its assets consisted of domestic bonds. However, in 2014 it went through a radical asset reallocation and the target weight for domestic bonds was reduced from 60% to 35%, and then further down to 25% in 2020. Its current target allocation is a clean four-way 25% split into domestic bonds, domestic equity, foreign equity and foreign bonds.

As one of the largest pension funds in the world, its asset allocations attract market attention and there is speculation that it is about to raise its allocation into domestic bonds. In my view, there is indeed a very high chance that GPIF will be raising its allocation into domestic bonds, if it has not already started to do so in the current quarter ending in September 2026.

Chart 2

UEDA in 2013 Saw a Bond Crash Coming

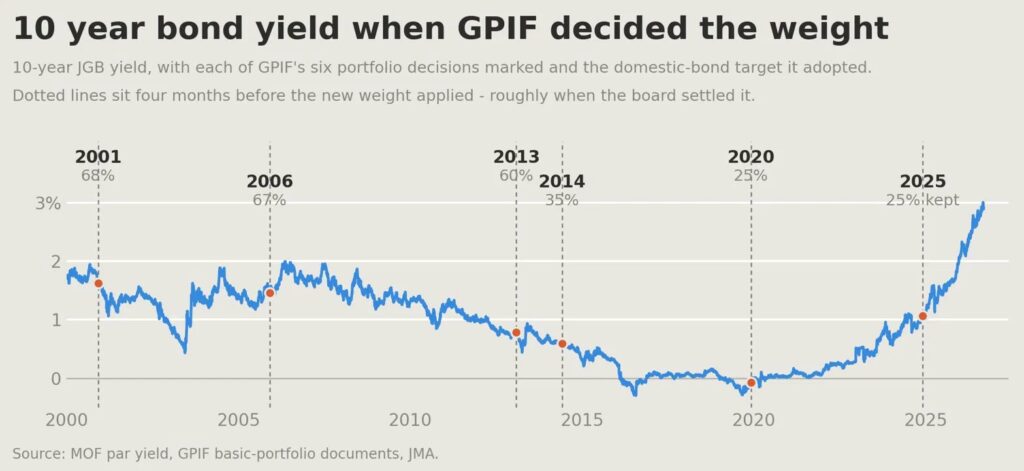
To understand why GPIF is highly likely to raise its allocation into domestic bonds, we need to go back in history to 2013. Why 2013? Of course, it is the year the Bank of Japan (BoJ) started its massive quantitative easing. The 10-year JGB yield started 2013 at 0.8% and it fell to 0.3% by the end of 2015 before briefly hitting a negative rate of -0.3% in 2016. If you were the chairperson of the GPIF investment committee, you would have been concerned about the wisdom of continuing to invest in JGBs at such a policy-driven low rate. The actual chairperson was UEDA Kazuo [植田和男], the current BoJ governor. In the minutes for October 2013, UEDA said, “I think there is a fair chance that bonds will crash at some point in the next five to ten years [unofficial translation].”

The minutes were released only seven years later; otherwise the use of the word “crash” would have been controversial.

GPIF CEO Priced the Crash at 3% in 2014. We Are There Now

If you read through the GPIF minutes between 2013 and 2014, you would see that GPIF officials were increasingly conscious of the precariousness of investing in JGBs. Long story short, as this process was highly political and a sensitive subject, they decided to radically lower the target allocation weight for JGBs to 35% in 2014, presented it as the result of a philosophical change in the way GPIF is managed and how the concept of “risk” should be considered. Investment in JGBs was no longer considered low risk in real terms. The asset allocation for domestic bonds was further lowered to 25% in 2020. The following is what MITANI Takahiro [三谷隆博], the GPIF CEO at the time and an ex-BoJ senior official, said in the October 2014 GPIF minutes.

“Yields are just under 0.5% now, so a move to near 3% would mean a loss of about ¥25 trillion. (…). So I think the clearest way to explain it is that reducing the weight on JGBs to some degree is simply unavoidable [unofficial translation]”

The 2014 cut in the weight was partly an emergency escape

As I wrote earlier, the radical asset reallocation in 2014 was part a shift in the concept of risk from “nominal” to “real”, so that JGB is no longer risk free assets. But the change was also at least partly an emergency measure to escape the abnormally low-yield environment. Then the next natural question is, now that the JGB yields are no longer abnormally low, what should happen to its asset allocation? Pensions are paid in yen, so long-duration Japanese government bonds are a natural match, while GPIF should also be holding some non-yen assets and equities to diversify its assets and protect the overall balance sheet from inflation. In the next section, I will show you a simplified replication of how GPIF decides its asset allocation and what GPIF’s asset allocation could be now that JGB yields are normal.

How GPIF decides its weights

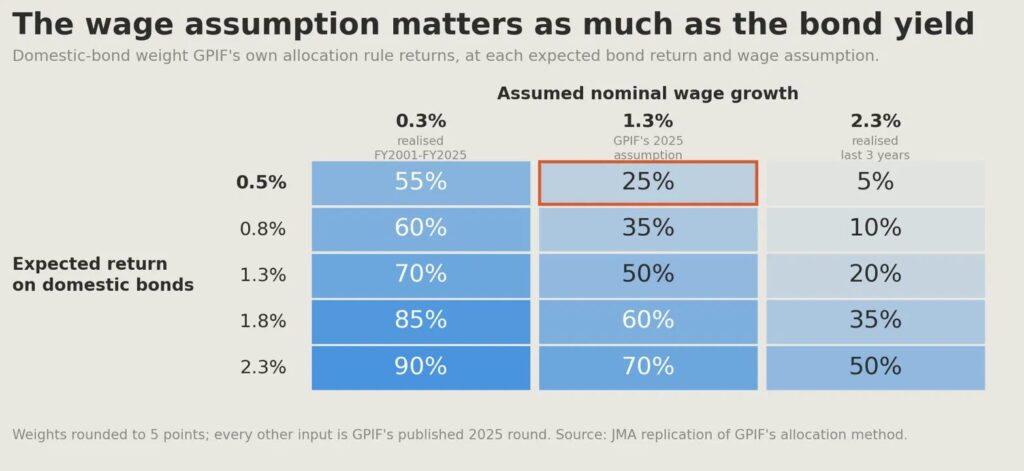
Put simply, GPIF’s target weights are the output of an optimizer with a few rules. Find the portfolio that, at the required real return, has the smallest average shortfall below wage growth in the years when it falls short, and round it to the nearest 5%.

When GPIF last decided to keep the current 25% weight for domestic bonds in 2025, JGBs were assumed to produce a nominal return of 0.5% against wage growth of 1.3%, so a real return of minus 0.8%. Exhibit 1 shows a simplified matrix of weights depending on expected nominal return on bonds and wage growth. The red box shows the assumption behind the 2025 weights decision mentioned above. If we use a higher wage growth assumption of 2.3%, an expected nominal return of 1.8% on bonds gives a weight of 35%. GPIF’s bond portfolio has an average maturity around 10 years, and the 10-year bond is yielding 3% now. A lot of thought and estimation is needed to form a view on the expected real return on domestic bonds, but in my view, it is clear that the minus 0.8% used in their last review is too low given where bond yields are.

Why GPIF kept the weight in 2025 and why circumstances changed

In late 2024 when the GPIF was reviewing the weight as part of its five-year plan, the BoJ was already in the process of exiting from QE and raising its policy rate. However, the JGB market was still in the process of adjustment and bond yields had a lot of room to rise. For example, the 10-year yield was 0.89% at the end of September 2024, rose to 2% by the end of 2025 and now, in September 2026, stands at 3%. You can understand why GPIF decided to keep its weight on domestic bonds unchanged as it would have incurred capital losses on bond purchases in 2025. But in my view, as I wrote in the report “The Long Climb in JGB Yields Is Nearly Over” [archived PDF], long bond yields are getting closer to a stability point. If the GPIF board shares my view, it is a good time to think about raising its target weight into domestic yen bonds.

The Whale Problem and the Washington Problem

How high should the new weight be for domestic bonds? The reality of determining appropriate weights and how to announce it is a lot harder than the simplified model I explained above. Other than forming a reasonable view on the expected real return on asset classes, there are a few factors that complicate the process.

Firstly, GPIF needs to think about how such an announcement would affect the market. GPIF is what financial market professionals call a whale, a massive investor whose investment decisions sway market prices. There is also a related argument that given the dominance of GPIF in the domestic market, GPIF should be increasing its asset weight abroad to reduce its impact on domestic asset markets.

Secondly, changing asset allocation weights carries political considerations. If GPIF decides to raise the target weight for domestic bonds, foreign bonds are the likely asset class whose weight will go down. More than 50% of its foreign bonds are in US dollars. With all the news circulating in the market now, Scott Bessent will not like a public announcement that one of the largest pension funds in the world is reducing its purchase of US treasuries. There are domestic political considerations as well, as the Takaichi government contemplates how best to fund its deficits.

These are the issues GPIF officials must be debating. How GPIF decides its asset allocation in the near future will be a revealing case study for those who want to study how policy-making works in Japan. Those who are interested in this topic should read the transcripts of an interesting government committee in 2014 that focused on how GPIF could shield itself from political meddling. Guess who chaired the committee? UEDA Kazuo [植田和男].

Whatever the near-term decision GPIF makes regarding its target weight, I think it is fairly clear that GPIF should be increasing its investment into domestic bonds. The following table shows how much GPIF could buy in net terms, depending on the eventual rise in the target weight.

How much GPIF buys: ¥32tn at 35%, ¥80tn at 50%

Domestic Bond TargetGPIF BuysWith the Sister Funds
30%¥16tn¥20tn
35%¥32tn¥20tn
40%¥48tn¥20tn
50%¥80tn¥20tn

Additional domestic-bond holdings from re-weighting the fund at 30 June 2026 (managed assets ·317.8tn). Foreign bonds sold first.
Source: GPIF, JMA.

Three things in this table matter for the market. GPIF is allowed to deviate its asset allocation by six points either side of 25% without any announcement, so 39% target is already possible without any public announcement. In 2014 GPIF moved inside its band first and announced the new portfolio afterwards, and I would expect the same sequence this time. Second, these are static figures, which do not account for the growth of the fund over time.

The sister funds move with the whale

As mentioned earlier, GPIF has a few siblings. The Pension Fund Association for Local Government Officials (¥35.5tn), the Federation of National Public Service Personnel Mutual Aid Associations, known as KKR (¥11.5tn), and the Promotion and Mutual Aid Corporation for Private Schools of Japan (¥4.9tn) manage the pension reserves of local government employees, national government employees and private-school teachers. These sisters run their funds on the same 25/25/25/25 model, and with the legacy reserves they also run, they hold a further ¥87tn on top of GPIF’s.

Conclusion

GPIF cut its domestic bond weight from 60% to 35% in 2014, and later to 25%, to safeguard its assets from the manipulated low JGB yields at the time and the eventual crash they foresaw. That crash, as GPIF’s CEO MITANI defined it in 2014, has now happened with the 10-year yield rising to 3%. In my view, JGB yields have largely normalized and there is no emergency reason to avoid domestic bonds. It is only natural that GPIF would raise its allocation into domestic bonds, although how GPIF communicates this publicly is a touchy issue they need to figure out. When GPIF raises its domestic bond allocation, foreign bonds are the likely asset class to take the hit. GPIF publishes quarterly results and the next publication for the end-September 2026 quarter, expected in early November 2026, will be closely watched. Judging from market movements in the last few weeks, the market has started to sense that what I described in this article is already happening and Japanese money is starting to come back to the yen. While it should be characterized as rebalancing, rather than a repatriation, it seems we are observing a big turn in Japanese cross-border capital flows.

Japan’s Deadliest Delicacy Is Getting More Dangerous

Rising sea temperatures are pushing pufferfish species together, spawning hybrids that even specialist chefs cannot safely prepare

[from South China Morning Post]

by Julian Ryall

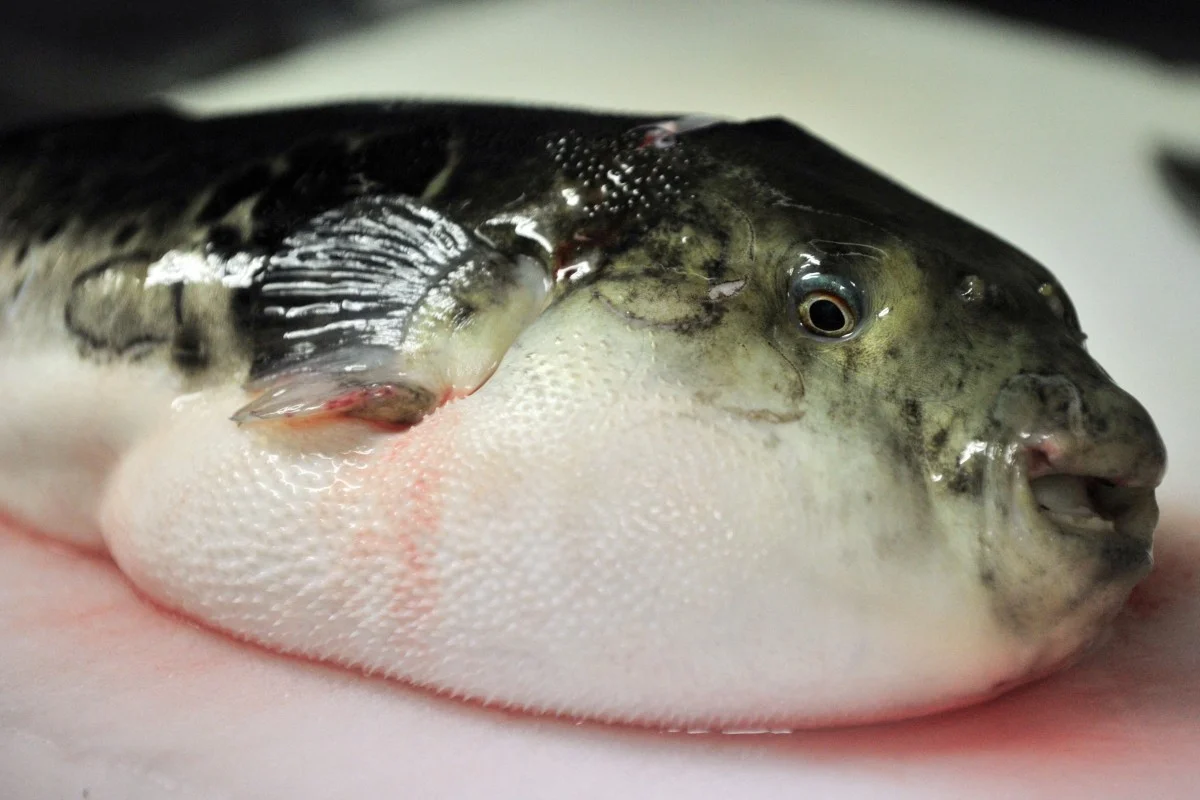
Japan’s most dangerous delicacy is getting harder to prepare safely as warming seas push different pufferfish species into the same waters, where they are inbreeding to produce hybrids whose lethal toxins are not yet fully understood.

Fugu – the collective Japanese name for several species of edible pufferfish – is prized as much for the danger surrounding its preparation as for its subtle flavour.

Many species contain tetrodotoxin, a powerful neurotoxin with no known antidote that can cause paralysis, respiratory failure and death.

Since 1958, anyone wishing to prepare pufferfish for public consumption has had to obtain a licence first, a process that takes at least two years and defeats roughly two-thirds of those who attempt it.

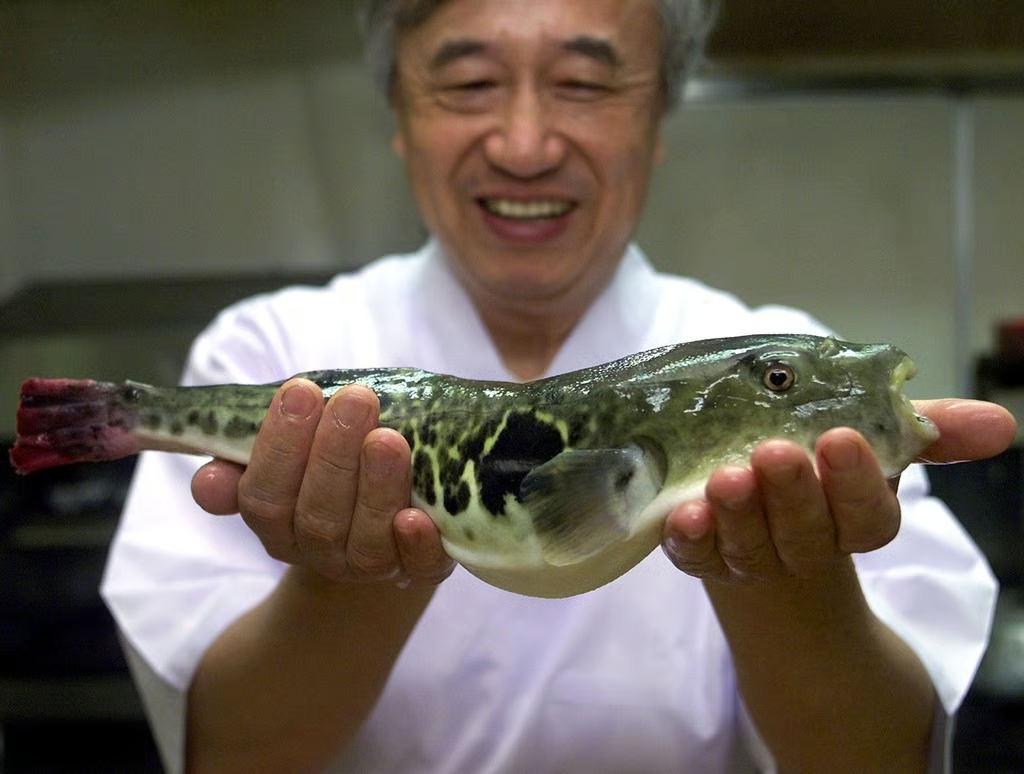
A restaurateur shows off a “fugu”, or pufferfish, at a restaurant in Shimonoseki, Japan. Photo: AP

Chefs learn to strip out the fish’s liver, ovaries, eyes and skin – tissues where the poison concentrates – with the precision of a brain surgeon and the nerve of a bomb-disposal technician.

But that hard-won expertise is now being undermined by climate-induced interbreeding, as experts say Japan’s coastal waters are heating up at roughly twice the global average rate.

Spotted pufferfish, once largely confined to the Sea of Japan, have spent the past decade steadily pushing northward in search of cooler currents. Some slipped through the Tsugaru Strait – the channel separating Honshu from far northern Hokkaido – where they have met and mated with the region’s native pufferfish species.

The resulting hybrids now make up as much as 40 per cent of local catches, according to a recent study of fish caught off Fukushima and Ibaraki prefectures.

“We started seeing these spotted fugu on the Pacific coast in 2012 as temperatures in the Sea of Japan became too high for them,” said Professor Hiroshi Takahashi of the National Fisheries University in Shimonoseki, Yamaguchi prefecture.

Temperatures in the waters there were “among the fastest rising anywhere in the world”, he told This Week in Asia, adding that the changes in pufferfish had been happening just as fast.

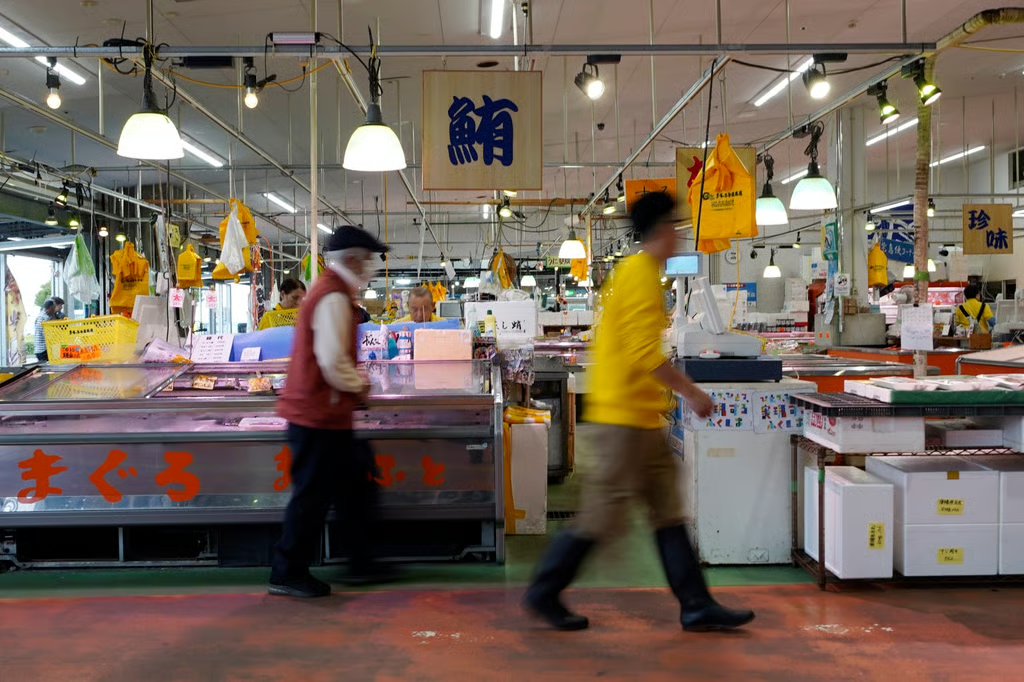
Customers visit a seafood market in Japan’s Fukushima prefecture. Photo: AP

Some spotted pufferfish had ventured down the east coast as far south as Tokyo Bay, Takahashi said, only to be driven north again as those waters also warmed.

Tiger pufferfish had likewise moved north from their usual range to interbreed with common pufferfish in and around Tokyo Bay, he added.

The trouble is not that hybrids are more toxic than their ancestors, it is that nobody yet knows how interbreeding has affected the distribution of toxins.

Each species of pufferfish stores tetrodotoxin in a different combination of organs and Japan’s health ministry has not yet been able to establish which parts of the new hybrids are safe to eat and which are not.

Until it does, the government has banned the sale or consumption of hybrid fugu – but this ban is almost impossible to enforce.

“They are very hard to identify,” said Takahashi, whose team has developed a DNA test capable of distinguishing hybrid fish and hopes to make the technology commercially available to fishermen who currently have no reliable way of screening their catch.

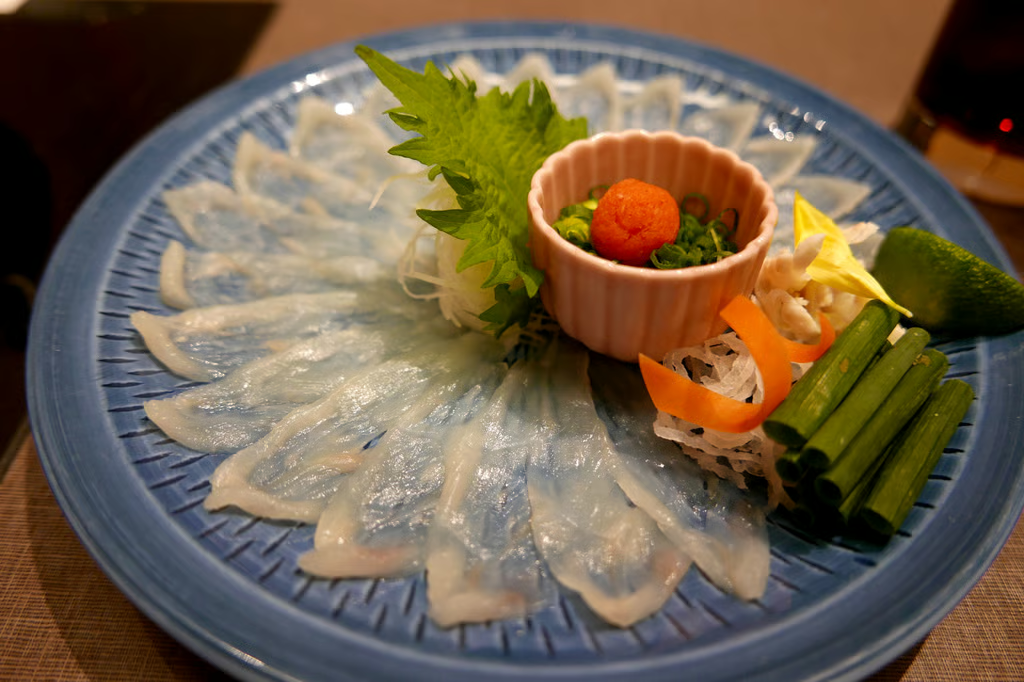
Pufferfish, or “fugu”, sashimi prepared for eating at a restaurant in Japan. Photo: Shutterstock

Fatal attraction

None of this is likely to diminish fugu’s deadly mystique. The dish has been eaten in Japan for centuries, enjoyed despite – or because of – the risks involved.

Every year, new tales emerge of amateur anglers preparing the fish to eat against the advice of anxious relatives and not surviving the attempt.

Diners speak of a faint numbness in the lips as evidence of a narrow escape and the emperor of Japan is barred from eating fugu altogether, lest even a licensed chef makes a mistake.

Urban legend holds that chefs who do poison a customer are honour-bound to end their own life, with their own knife, in atonement – though this is a myth.

For their part, Japanese restaurateurs are, perhaps unsurprisingly, keen to play down the risks.

A spokeswoman for Miyawaki Fugu Club, an upscale restaurant in Tokyo’s Ginza district, said its chef works exclusively with farmed tiger pufferfish from a long-established supplier, which she insisted were “completely safe”.

James Reimer, a professor of marine biology at the University of the Ryukyus, said the fugu phenomenon fit a wider pattern of marine life relocating in response to global warming.

“What happens to marine ecosystems is one of the hot-button issues of the day, particularly in Japan, because the waters here are warming at twice the global average rate,” he said.

During fieldwork off the Izu peninsula, south of Tokyo, three years ago, local fishermen told him that they had lost virtually their entire kelp crop and that the abalone once abundant in those waters had vanished.

A sea turtles in waters off Japan’s Amami Islands. Turtles are increasingly venturing farther north, fishermen say. Photo: Shutterstock

In their place, they said they were seeing far more sea turtles, as well as large schools of brightly coloured fusiliers – the prefectural fish of Okinawa, some 1,400km (870 miles) to the south.

“Last year, our summer in Okinawa was 30 days longer than average, and we had 120 days when the water temperature was around 30 degrees Celsius (86 degrees Fahrenheit),” Reimer said.

He warns that the picture is not simply one of fish and other marine life swimming steadily north in search of more comfortable temperatures, however.

Global warming is also destabilising weather patterns, making them less predictable. Waters off Kyushu, the southernmost of Japan’s main islands, that might otherwise suit certain species are increasingly prone to temperature swings that could make them unsuitable after all.

Even so, the broader direction is unmistakable. Kyushu’s waters have seen a marked rise in shark sightings in recent years, including large tiger sharks – one more sign of the changes occurring beneath the surface of Japan’s seas.

Japan-Watching: Still Dreaming: Kon Satoshi’s “Paprika” and Other Visions

by Miyamoto Yūko [宮本 裕子]

Anime (アニメ) director KON Satoshi (今 敏) died in 2010 at the age of 46, but his works remain highly influential. His final film Paprika, released 20 years ago, highlights his preoccupations with the divided self and the blurring of the lines between dreams and reality.

Dream Analysis

After starting out as a manga artist in 1985, KON Satoshi [今 敏] honed his skills in the anime production teams of OSHII Mamoru [押井 守] and ŌTOMO Katsuhiro [大友 克洋], and then made his feature-length direction debut with Perfect Blue, which was released in Japan in 1998. His fourth feature, the 2006 Paprika, is an adaptation of the novel of the same name by TSUTSUI Yasutaka [筒井 康隆]. Kon was public in his admiration of the book and he is said to have aimed to produce “something like the novel Paprika” in his previous anime. Indeed, Kon’s Paprika adaptation has many factors in common with his earlier works.

KON Satoshi [今 敏]

KON Satoshi [今 敏] in Venice in September 2006, when Paprika was showing in competition at the Venice International Film Festival. (© Reuters)

Tsutsui studied psychology at university, and motifs and ideas from Freudian and Jungian psychoanalysis feature regularly in his novels. Dream analysis plays a central role in the story in Paprika. In psychoanalysis, psychologically repressed material is thought to be banished to the unconscious before emerging in a different form in dreams. Analysis of dreams has been seen as a valuable way of resolving psychological problems by bringing the repressed matter into the open.

Paprika is set in a near-future Japan, where it is possible to monitor other people’s dreams on a screen. The main character is a therapist called Chiba Atsuko, who provides treatment via her alter ego Paprika, a dream detective. The technology is abused, however, forcing people to experience nightmares, and eventually these flood into the real world.

While Kon follows the broad outline of the original work, his adaptation incorporates numerous changes. The biggest of these is the chaotic parade of electronic goods, beckoning cats (“maneki-neko” [招き猫]), Buddhist statues, torii gates [鳥居], and other marching objects. This symbolizes nightmares spilling out of control, but there is nothing like it in Tsutsui’s book. Kon explained that the parade is made up of old-fashioned appliances and forgotten religious and traditional elements.

In Freud’s The Uncanny, he describes the titular subject as something familiar that has been estranged through repression. In the film, the members of the parade have become estranged from the conscious minds of people today, but are resurrected, and symbolize the uncanny nature of nightmares.

The parade that invades the dreams of patients. (© 2006 Madhouse/Sony Pictures Entertainment Japan, Inc.)

Integrating the Self

Alongside its Freudian elements, Kon’s Paprika shows Jungian influences. Carl Jung did not think that it was best to bring repressed aspects of the psyche under control, instead emphasizing the importance of integrating them into the self. This integration process can be seen in several of the characters.

While Konakawa, a character suffering from anxiety issues, searches through his dreams together with Paprika, he realizes that a mysterious person he repeatedly encounters is an old friend with whom he once shared the ambition of becoming a film director. This friend, who died of illness, appears in Konakawa’s dreams as his other self—the one who wanted to be a director. Konakawa overcomes his anxiety by recognizing and reconciliating with the repressed and forgotten self, represented by his old friend.

The division and antagonism between Chiba Atsuko and her alter ego Paprika are similar to those seen between Konakawa and his old friend. In the original book, Paprika was Chiba in disguise as a dream detective, but in Kon’s anime, they are like entirely different characters. In the finale, when dreams are flooding into the real world, they divide completely, existing at the same time in the same space. After this split, Chiba comes together again temporarily with the uninhibited Paprika when she no longer holds back her suppressed love for her colleague Tokita Kōsaku.

Chiba Atsuko with her divided self Paprika reflected in the glass. (© 2006 Madhouse/Sony Pictures Entertainment Japan, Inc.)

Chiba and Paprika do not divide in Tsutsui’s novel, and Konakawa’s old friend does not represent another self. This aspect of the divided self, added by Kon during the adaptation process, can be taken as a Jungian motif.

Books by the late KAWAI Hayao [河合 隼雄], renowned as a Jungian psychologist, were widely read in Japan from the 1980s until the 1990s, and Kon was among his readers. He is said to have become an avid reader of the psychologist for a time because he wanted to understand the music and lyrics of HIRASAWA Susumu (平沢 進), the former vocalist of the techno-pop band P-Model, who was influenced by Kawai. Hirasawa later created soundtracks for anime by Kon, including Paprika.

Kon also stated that he was influenced by the novels of MURAKAMI Haruki (村上 春樹), who himself developed a friendly relationship with Kawai through interviews and other encounters. Kon is said to have claimed that he was the only person who could adapt A Wild Sheep Chase [羊をめぐる冒険] and The Wind-Up Bird Chronicle [ねじまき鳥クロニクル] to anime.

Kon’s Themes

The anime Paprika could be seen as a later stage in the Kawai-led Jungian psychology boom in Japan, as well as a culmination of Kon’s characteristic themes. For example, the following aspects regularly appear in Kon’s work.

First, there is the depiction of another self. These include Chiba and Paprika in Paprika, Chiyoko and the old woman who appears at key moments and symbolizes Chiyoko’s future self in Millennium Actress (2002), and idol-turned-actress Mima and the apparition of her former pop star self in Perfect Blue.

Second, there are departures from heterosexual norms. In Paprika, the title character announces the wedding of Tokita and Chiba, which maintains the existence of this free-spirited “dream detective,” so that the film deviates subtly from the typical closed ending of heterosexual marriage. The ending of Millennium Actress suggests that Chiyoko’s long search for an artist she meets in her youth is her goal in itself, rather than a romantic relationship with him. In Tokyo Godfathers [東京ゴッドファーザーズ] (2003), alongside a caricatured depiction of a transgender character, we see the struggles of heterosexual couples and their families.

The third aspect is how media and technology blur the lines between reality and the unreal world. In Paprika, the DC Mini device erodes the boundary between reality and the dreams it is used to view, while Mima’s double in Perfect Blue appears in mirrors, PC monitors, and internet browsers. In Millennium Actress, Chiyoko’s acting roles are intertwined with her real life. In Kon’s anime series Paranoia Agent [妄想代理人] (2004), rumors transform into reality through the actions of the mass media and the characters, who in themselves are a kind of media commodity.

During a scene in Paprika when Konakawa goes to the movie theater, posters for Kon’s other films are on display. This shot shows Millennium Actress and Perfect Blue. (© 2006 Madhouse/Sony Pictures Entertainment Japan, Inc.)

Robot Adventure?

While there are clearly repeating themes in Kon’s works, Dreaming Machine [夢みる機械], which remains unfinished due to his sudden death from cancer, shows signs of an apparent major change of course. At one point it was announced that another director would complete the movie, but the producer later backtracked, saying that there was no director capable of realizing Kon’s vision.

Based on the remaining materials, this appeared set to be an action-adventure story about robots hunting down precious electricity in a near-future setting when humans are extinct. Paprika was also set in the near future, but Dreaming Machine features more overtly futuristic urban landscapes. The main characters are smaller, cartoonish robots, compared with the relatively tall humans of Kon’s other films. While it seems to have been aiming for a different kind of movie in terms of both content and visuals, was this really going to be a standard adventure story, without any twists?

Kon said that one of his influences was the manga [漫画] creator MOROHOSHI Daijirō (諸星 大二郎). In a short 1974 work by Morohoshi, also called “Dreaming Machine” (“Yume miru kikai [夢みる機械]”), robots go about their daily lives in the place of humans, who dream in a form of suspended animation. Kon’s unpublished 1984 manga Toriko covered similar ground. Can it be simple coincidence that his unfinished work has the same title as Morohoshi’s manga?

Beyond what looks on the surface like a robot action adventure, in Dreaming Machine,  Kon may have planned to depict a world of cryofrozen, dreaming humans. Or perhaps the robots were intended to be controlled consciously or subconsciously by humans. This is pure speculation, but I cannot help thinking that Kon may have intended to continue his theme of technology blurring the boundaries between dreams, or fantasy, and reality.

Some people may consider it unproductive to imagine what Kon’s works may have been, but this imaginative act helps carry his vision forward. Kon’s direct and indirect influence can be found in films like Darren Aronofsky’s Requiem for a Dream (2000) and Black Swan (2010), Christopher Nolan’s Inception (2010), and Edgar Wright’s Last Night in Soho (2021). While we will never see another KON Satoshi (今 敏) film, his vision lives on.

(Originally published in Japanese on July 10, 2026. Banner image from Paprika; © 2006 Madhouse/Sony Pictures Entertainment Japan, Inc.)

Economics-Watching: Bank of Japan Updates (June 25th)

[from the Bank of Japan (日本銀行), June 25, 2026]

Economic Activity, Prices, and Monetary Policy in Japan

Speech at a Meeting with Local Leaders in Hyogo

TAMURA Naoki [田村 直樹], Member of the Policy Board, June 25, 2026

Read the full translated speech [Archived PDF]

Flow of Funds Accounts (Retroactive Revision and 1st Quarter 2026, Preliminary Figures)

The Bank released the following data today.

The Overview of Japan, US, and the Euro area is renewed once a year after the Flow of Funds Accounts is released in June.

The Bank of Japan retroactively revises data for the Flow of Funds Accounts (FFA), in principle once a year, to reflect information updates, such as newly obtained source data and institutional changes, and to incorporate revised estimation methods. The retroactive revision of 2026 was implemented on June 25 and data from the first quarter of 2005 onward has been updated accordingly. The majority of the revision contents are unchanged from the Planned Retroactive Revision to the Flow of Funds Accounts [Archived PDF] released on May 25, 2026.

To download the retroactively revised data, please use the BOJ Time-Series Data Search.

Monthly Report on the Services Producer Price Index

Read the full May report [Archived PDF]

Updates to the Bank of Japan’s statistical data are available at BOJ Time-Series Data Search.

Japan-Watching: Ministry of Finance, Japan

Preliminary determination of Anti-Dumping Duty Investigation of Nickel-added cold-rolled stainless steel coil, sheet, and strip originating in the People’s Republic of China and the Separate Customs Territory of Taiwan, Penghu, Kinmen, and Matsu

  1. Upon receipt of an application from NIPPON STEEL CORPORATION [日本製鉄株式会社], Nippon Yakin Kogyo Co., Ltd. [日本冶金工業株式会社], NAS Stainless Steel Strip MFG. Co., Ltd. [ナス鋼帯株式会社の画像] and NIPPON KINZOKU CO., LTD. [日本金属株式会社] on May 12, 2025, the Ministry of Finance (MOF) [財務省] and the Ministry of Economy, Trade and Industry (METI) [経済産業省] began conducting an investigation since July 22, 2025, to determine whether or not to impose an anti-dumping duty on Nickel-added cold-rolled stainless-steel coil, sheet, and stripa originating in the People’s Republic of Chinab and the Separate Customs Territory of Taiwan, Penghu, Kinmen, and Matsu.
    1. Note: An alloy steel containing 10.5% or more of chromium and containing by weight more than 0.6% nickel. The characteristics of this product are that it combines corrosion resistance, the functionality of steel, and a beautiful and clean design by manufacturing methods. Also, it is used in various fields of demand.
    2. Note: Excluding the regions of Hong Kong and Macau.
  2. MOF and METI have explored objective evidence collected from interested parties, including suppliers in the People’s Republic of China and the Separate Customs Territory of Taiwan, Penghu, Kinmen, and Matsu, providing opportunities for them to present evidence and to express their views. As a result, MOF and METI today made a preliminary determination in the anti-dumping investigation of the product, presuming the fact of the importation of the dumped product and the fact of the material injury to the domestic industry caused by such importation. (Public Notice on June 19, 2026)

    MOF and METI will continue the investigation in accordance with the provisions of the international rules under the WTO Agreements and related domestic laws and regulations, providing the interested parties with an appropriate opportunity to present evidence and express their views relating to the preliminary determination.

    Following the further investigation, the Government of Japan will determine whether or not the product has been imported into Japan at dumped prices and if such dumped imports have caused material injury to the domestic industry, and make a decision whether or not to impose a definitive anti-dumping duty on the product.

    The interim report on preliminary determination offers details of the investigation.
Reference

Public Notice on June 19, 2026 [Archived PDF]

Interim report on preliminary determination [Archived PDF]

[Provisional Translation, June 19, 2026, Ministry of Finance, Ministry of Economy, Trade and Industry]

Extension of the Period of Investigation of Nickel-added cold-rolled stainless steel coil, sheet and strip originating in the People’s Republic of China and the Separate Customs Territory of Taiwan, Penghu, Kinmen, and Matsu

  1. With regard to the Anti-Dumping Duty Investigation on Nickel-added cold-rolled stainless-steel coil, sheet, and stripa originating in the People’s Republic of Chinab and the Separate Customs Territory of Taiwan, Penghu, Kinmen, and Matsu, the Ministry of Finance (MOF) [財務省] and the Ministry of Economy, Trade and Industry (METI) [経済産業省] have decided to extend the period of investigation by three months until September 21, 2026. The purpose of this extension is to carefully review the evidence and relevant documents submitted by interested parties, while ensuring full transparency and fairness throughout the investigation process.
    1. Note: An alloy steel containing 10.5% or more of chromium and containing by weight more than 0.6% nickel. The characteristics of this product are that it combines corrosion resistance, the functionality of steel, and a beautiful and clean design by manufacturing methods. Also, it is used in various fields of demand.
    2. Note: Excluding the regions of Hong Kong, China, and Macau, China.
  2. MOF and METI have been conducting the investigation since July 22, 2025. The investigation was to be concluded within one year, but the period can be extended by six months at most if it is found necessary for special reasons.
Reference

Notice of the Ministry of Finance Relating to the Extension of the Period of Investigation (No. 178, June 19, 2026) [Archived PDF]

[Provisional Translation, June 19, 2026, Ministry of Finance, Ministry of Economy, Trade and Industry]

Issues Re-opened through Liquidity Enhancement Auction on June 19, 2026

SecuritiesIssue NumbersRe-opened Amounts (billion yen face value)
10-Year363133.7
10-Year3648.4
10-Year36534.8
10-Year36927.7
10-Year37048.9
20-Year12875.1
20-Year129110.6
20-Year1329.0
20-Year1332.5
20-Year1364.9
20-Year14216.0
20-Year1436.8
20-Year1532.0
20-Year1549.9
20-Year1590.7
30-Year65.0
30-Year70.1
30-Year135.0
30-Year140.1
30-Year1514.1
30-Year160.2
30-Year1725.6
30-Year194.9
30-Year2053.0
30-Year238.6
30-Year2432.4
30-Year268.9

Result of Liquidity Enhancement Auction on June 19, 2026 (For JGB Market Special Participants)

Auction DateIssue DateAmounts of Competitive Bids (billion yen)Amounts of Bids Accepted (billion yen)Highest Accepted Spread*Allotment for Bids at the Highest Accepted SpreadAverage Accepted Spread*
6/196/221,897.8648.9+0.020%98.6666%+0.016%
Note

These columns indicate the spreads from the reference rate.

Auction Result of Treasury Discount Bills on June 19, 2026

Issue NumberAuction DateIssue DateMaturity DateAmounts of Compet. Bids (billion yen)Amounts of Bids Accepted (billion yen)Lowest Accepted Price (per 100 yen)Yield at the Lowest Accepted PriceAllotment for Bids at the Lowest Accepted PriceWeighted Average Price (per 100 yen)Yield at the Average PriceAmounts of Non-price compet. Auction Ⅰ* (billion yen)
13896/196/229/249,637.503,150.3899.76300.9224%79.2411%99.76600.9107%949.60
Note

For JGB Market Special Participants.

Interest Rate (June 2026)

(%)

Date1Y2Y3Y4Y5Y6Y7Y8Y9Y10Y15Y20Y25Y30Y40Y
6/11.1231.41.5581.7751.9482.0942.2432.3972.5382.6823.2253.5673.8713.8633.8
6/21.1141.381.5221.7221.8892.0192.1572.312.4472.5773.1413.4933.8013.813.742
6/31.1261.4011.561.7671.9432.0772.2192.3732.5082.6453.1833.5213.8173.8173.748
6/41.1481.4171.5791.7871.9662.1052.2422.3952.5352.6713.2253.5543.8353.8333.749
6/51.141.4121.5741.7781.9552.0962.2332.3912.5322.6693.2223.5513.8383.8413.753
6/81.1441.421.5881.7931.9782.1282.2742.4322.5752.7153.2693.6043.8783.8763.789
6/91.1461.421.5821.7841.9622.1012.2422.3982.5372.6693.2173.5433.8243.8233.759
6/101.1471.4261.5941.7961.9712.1122.2572.4122.5492.6813.2183.5383.8063.8113.739
6/111.1491.4271.5921.7921.9632.1082.2582.4112.5512.6823.233.5543.8213.8233.774
6/121.151.4171.5791.7721.9382.0772.2182.3732.5112.6433.1893.5083.773.7673.713
6/151.1411.4091.5561.7431.9012.0392.1752.3222.462.5893.1433.4613.733.7253.674
6/161.1471.4141.5851.7831.9452.0842.2272.3822.5222.6553.2063.523.7633.7473.692
6/171.1391.3981.5521.7451.8972.0342.1822.3352.4792.6133.173.493.7413.7093.654
6/181.1461.41.5531.7461.8982.0452.1932.3532.4972.6283.193.5123.7653.7373.68

Treasury Discount Bills to Be Auctioned on June 26, 2026

1. Auction Date:June 26, 2026
2. Issue Date:June 29, 2026
3. Maturity Date:September 28, 2026
4. Offering Amount:About 4,100 billion yen
5. Others:The above offering amount may be changed. In such a case, the revised amount will be announced on the day before the auction date.

[Provisional Translation, June 19, 2026, Ministry of Finance]

Economics-Watching: BRICS Currency Creates Dilemma for the Dollar

by Christopher Whalen, from China Daily

The term “BRICS currency” typically refers to a hypothetical or proposed unified currency for the BRICS grouping. It’s not a single, physical currency currently in use, but rather a concept for a potential future monetary system that some suggest will reduce the dominance of the U.S. dollar in international trade and finance.

Is BRICS currency cooperation about immediate de-dollarization or long-term financial sovereignty? The answer is that BRICS cooperation may include reducing long-term dependence on the dollar as a means of exchange. The dollar is involved in more than half of all trade and 80 percent of all foreign exchange transactions. BRICS currency cooperation aims to gradually reduce the group’s dollar dependency, but challenges remain.

The BRICS concept came about not because the dollar is unsuitable as a means of exchange or unit of account, but rather because of the use of the dollar by Washington as a weapon. As I note in my book, Inflated: Money, Debt and the American Dream, the special role of the dollar in U.S. finance allows the U.S. government to impose harsh compliance and reporting requirements on foreign nationals and institutions. The U.S. is an arbitrary hegemon and does not follow reciprocity with other countries.

The global role of the dollar is an anomaly, the byproduct of two world wars had left the other antagonists broke by the time the Bretton Woods Agreement was signed in July 1944.

Choosing the fiat paper dollar as the default global reserve currency more than seven decades ago reflected the fact that the United States was one of the victors and possessed the wealth that gave Washington unchallenged economic leadership. Prior to World War I, the United Kingdom’s pound sterling was the global standard, but importantly, this paper currency was backed by gold — the only money that is not debt. The dollar, too, was backed by gold — until 1933, when the Franklin Roosevelt administration confiscated gold in private hands to prevent his government from collapsing.

Pound notes started to circulate in England in 1694, shortly after the establishment of the Bank of England. The paper pound helped to fuel the expansion of the British Empire, in large part because the only competing form of money was physical gold. When Britain and other nations left the gold standard in the 1930s, it was due to the deflation caused by the Great Depression rather than a deliberate choice.

The 19th-century rule attributed to English journalist and businessman Walter Bagehot says that in times of crisis, lend freely at a high rate against good collateral. Yet since the currency devaluation and gold seizures of 1933, fiat currencies and below-market interest rates have been the rule. In a global scheme in which the government occupies the prime position, the operative term remains “financial repression”, whereby governments control markets and artificially suppress rates of return on debt. For this reason, the dollar is losing its role as a store of value to gold.

The fact that the dollar continues to trade strongly versus other currencies reflects the reality that as the main means of exchange globally, the dollar cannot be easily replaced. One reason for this continued support for the dollar is that the trade in petroleum and other commodities is so large that it requires an equally large currency to accommodate it. Also, neither the Europeans nor the Japanese, the only two possible alternatives, are willing to risk the external deficits or inflation that the U.S. suffers as the host for the global currency.

What global currency will replace the fiat paper dollar? None. As this article is being written, gold is the second-largest reserve asset for central banks after the dollar. “The initiation in 2002 of the Shanghai Gold Exchange was of great strategic significance, both for gold and the global monetary system,” notes veteran gold fund manager Henry Smyth in an interview in The Institutional Risk Analyst. “Now it is completely clear what happened.”

Smyth and many other observers see the creation of the SGE in 2002 as the return of gold to the international monetary system. But while gold is growing in importance as a reserve asset for many countries, it does not mean that the role of the dollar as a global means of exchange or unit of account is about to change.

The dollar will remain the dominant asset. And even then, displacing the dollar will require a major change in the international monetary system, a change that is already underway.

The author is the chairman of Whalen Global Advisors LLC in New York and the author of Inflated: Money, Debt and the American Dream published by Wiley Global (2025).