Economics-Watching: FRBSF Economic Letter

[from the Federal Reserve Bank of San Francisco]

Are Inflation Expectations Well Anchored in Mexico?

by Remy Beauregard, Jens H.E. Christensen, Eric Fischer and Simon Zhu

Price inflation has increased sharply since early 2021 in many countries, including Mexico. If sustained, high inflation in Mexico could raise questions about the ability of its central bank to bring inflation down to its 3% inflation target. However, analyzing the difference between market prices of nominal and inflation-indexed government bonds suggests investors’ long-term inflation expectations in Mexico are close to the central bank’s inflation target and are projected to remain so in coming years.


Inflation has risen substantially in many countries, including Mexico, since early 2021, driven in part by unique factors related to the COVID-19 pandemic. Sustained elevated inflation could be particularly challenging for inflation-targeting central banks in emerging economies given their higher macroeconomic uncertainty and greater sensitivity to external shocks compared with more developed economies. To examine this risk for a representative emerging economy affected by COVID-era disruptions in much the same way as the United States, we focus on Mexico, which has conducted monetary policy since 2002 according to an inflation targeting regime with a target rate for consumer price inflation of 3% per year.

In this Economic Letter, we assess whether recent higher inflation is leading businesses and households in Mexico to expect inflation to remain high over the long run. Specifically, we focus on what rising market-based measures of inflation compensation may imply about bond investors’ outlook for inflation. The rise in inflation compensation since spring 2021 could reflect three factors: an increase in investorsinflation expectations, an uptick in the premium investors demand for assuming inflation risk, or changes in other risk and liquidity premiums. We explore the relative importance of each of these factors using a novel dynamic term structure model of nominal and inflation-adjusted yields described in Beauregard et al. (2021, henceforth BCFZ). Overall, our results for five-year inflation expectations five years from now suggest Mexican bond investors’ long-term inflation expectations have been little affected by the recent rise in inflation. Instead, the rise in inflation compensation reflects a notable uptick in the inflation risk premium to the high end of its historical range. This suggests that, despite inflation expectations being little changed on average, some investors are particularly concerned about the risk that inflation will remain above expected levels.

The recent rise in Mexican inflation

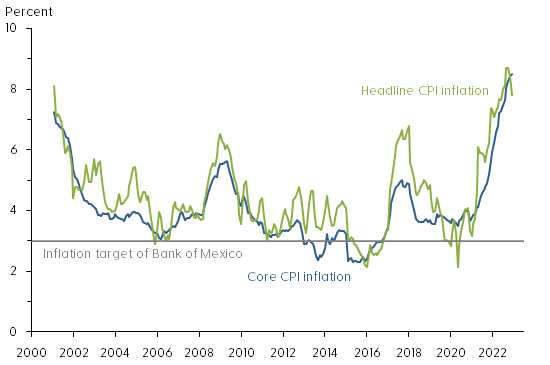
Figure 1 shows the year-over-year change in the Mexican consumer price index (CPI) measured both by the headline CPI (green line) and the more stable core CPI (blue line) that strips out volatile food and energy prices. Also shown with a horizontal gray line is the 3% inflation target of the nation’s central bank, the Bank of Mexico.

Figure 1: Mexican consumer price index inflation
Mexican consumer price index inflation
Source: Instituto Nacional de Estadística y Geografía.

We note that Mexican CPI inflation has averaged somewhat above the Bank of Mexico’s target since its adoption in 2002. More importantly, CPI inflation in Mexico appears to have become more volatile and somewhat higher over the past five years. Although previous research by De Pooter et al. (2014) found inflation expectations in Mexico to be well anchored, the significant global economic dislocations caused by the coronavirus pandemic and related inflationary pressures could impact inflation expectations of businesses and households.

To assess the persistence of the recent rise in Mexican inflation, we turn to financial market data, which reflect forward-looking expectations among a large and diverse group of investors and financial market participants. Specifically, we consider prices of conventional fixed-coupon bonds that pay a nominal interest rate and inflation-indexed bonds that pay a real interest rate because their cash flows are adjusted with the change in the CPI and therefore maintain their purchasing power. Both types of securities are issued and guaranteed by the Mexican government.

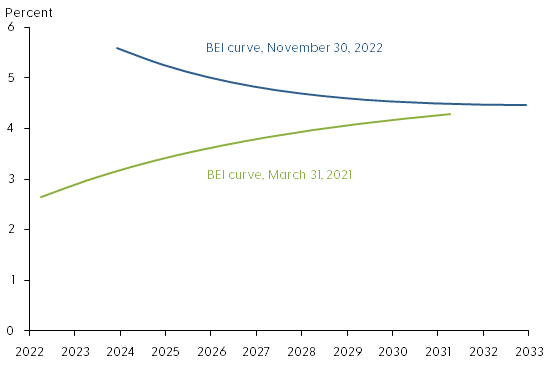
The difference between nominal and real yields for bonds of the same maturity is known as breakeven inflation (BEI). This represents a market-based measure of inflation compensation used to assess financial market participants’ inflation expectations. Figure 2 shows BEI rates at different maturities, meaning annual average rates of inflation compensation between now and maturity, from 1 to 10 years at the end of March 2021 (green line) and at the end of November 2022 (blue line). The slightly upward-sloping BEI curve of close to 3% in 2021 contrasts with the higher downward-sloping BEI curve in 2022.

Figure 2: BEI curves for 1-year to 10-year Mexican bond maturities
BEI curves for 1-year to 10-year Mexican bond maturities
Source: Authors’ calculations using bond prices from Bloomberg.

The increase for shorter maturities, the left end of the 2022 BEI curve, is closely tied to the current high level of inflation and suggests inflation may remain elevated for some time. In contrast, the increase at longer maturities, the right end of the 2022 BEI curve, suggests that investors’ longer-term inflation expectations may be drifting above the Bank of Mexico’s inflation target. To better understand the shape and sources of variation of the BEI curve we use a yield curve model.

A yield curve model of nominal and real yields

Market-based measures of inflation compensation such as BEI rates contain three components. First, they include the average CPI inflation rate expected by bond investors, which is the focus here. Second is an inflation risk premium to compensate investors for the uncertainty of future inflation. This premium is embedded in nominal yields that provide no inflation protection. Third is the difference in relative market liquidity between standard fixed-coupon and inflation-indexed bonds. As discussed in BCFZ, both of these types of Mexican bonds are less liquid than U.S. Treasuries, and their prices therefore contain a discount to compensate investors for their liquidity risk. Neither the inflation risk premium nor the liquidity premiums are directly observable and must therefore be estimated.

To adjust for these challenges, we first use the nominal and real yields model developed in BCFZ to identify liquidity premiums in standard fixed-coupon and inflation-indexed bond prices as a function of the time since issuance and the remaining time to maturity. The time since issuance serves as a proxy for declining liquidity as, over time, a larger fraction of bonds gets locked into buy-and-hold strategies. We refer to the observed BEI net of estimated liquidity premiums as the adjusted BEI. In a second step, we then separate adjusted BEI into components representing investorsinflation expectations using a formula based on the absence of bond market arbitrage opportunities and the residual inflation risk premium.

Results

To assess whether investorsinflation outlook has fundamentally changed, we follow De Pooter et al. (2014) and examine the five-year forward BEI rate that starts five years ahead, denoted 5yr5yr BEI. This is a horizon sufficiently long into the future that most transitory shocks to the economy can be expected to have vanished. Hence, the embedded inflation expectations are presumably less affected by current high inflation and pandemic-related transitory conditions and can therefore speak to the question about the anchoring of inflation expectations in Mexico.

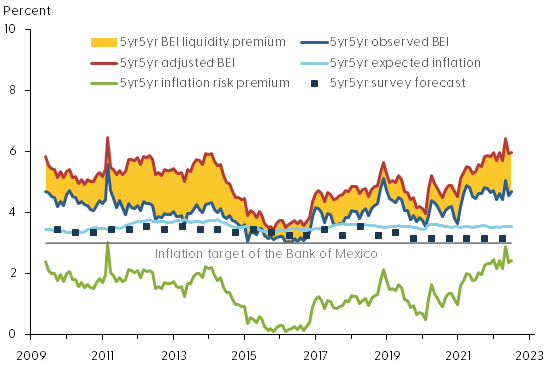
Figure 3 shows the breakdown of 5yr5yr BEI into its various components according to our model. The dark blue line is the observed BEI, and the red line is the estimated adjusted BEI without liquidity risk premiums or other residual disturbances. The difference between these two measures of BEI—the yellow shaded area—represents the model’s estimate of the net liquidity premium or distortion of the observed BEI series due to risk premiums in both nominal and inflation-indexed bond prices. The adjusted BEI is entirely above the observed BEI, suggesting the liquidity risk distortions are systematically larger in the inflation-indexed bond prices, consistent with similar evidence from the U.S. Treasury market (Andreasen and Christensen 2016). Note that the net BEI liquidity premium widened around the financial turmoil in spring 2020 at the start of the pandemic and remains elevated.

Figure 3: Components of 5yr5yr breakeven inflation for Mexico
Components of 5yr5yr breakeven inflation for Mexico
Source: Survey forecasts from Consensus Economics and authors’ calculations using bond prices from Bloomberg.

The model also allows us to break down the adjusted BEI into an expected inflation component (light blue line) and the residual inflation risk premium (green line). Also shown is the Bank of Mexico’s 3% inflation target (gray horizontal line). For comparison, the figure also shows the 5yr5yr expected CPI inflation in Mexico reported semiannually in the Consensus Forecasts surveys (dark blue squares). We note that both observed and adjusted BEI have trended higher since the start of the pandemic in early 2020. Importantly, the breakdown indicates that long-term expected inflation in Mexico has remained stable, slightly above the 3% inflation target. As a result, the increase in BEI can be attributed to the inflation risk premium, which is at the high end of its historical range towards the end of our sample. Given the elevated levels of current inflation, this suggests some investors are concerned that inflation could remain elevated for longer than currently anticipated.

This raises the question of whether long-term inflation expectations in Mexico are likely to remain anchored near their current level going forward. To assess this risk, we simulate 10,000-factor paths over a three-year horizon using the estimated factors and factor dynamics as of November 2022—that is, the simulations are conditioned on the shapes of the nominal and real yield curves and investors’ embedded forward-looking expectations as of November 2022. These simulated factor paths are then converted into forecasts of 5yr5yr expected inflation. Figure 4 shows the median projection (solid green line) and the 5th and 95th percentile values (dashed green lines) for the simulated 5yr5yr expected inflation over a three-year horizon.

Figure 4: Three-year projections of 5yr5yr expected inflation, Mexico
Three-year projections of 5yr5yr expected inflation, Mexico
Source: Authors’ calculations.

Our model projections indicate that long-term inflation expectations are likely to deviate only modestly from their current level, consistent with the variation of the historical estimates back to 2009. Overall, our findings represent tangible evidence that long-term inflation expectations remain well-anchored in Mexico despite the recent rise in inflation.

Conclusion

Global inflation pressures in the aftermath of the pandemic have raised fears about a sustained increase in the level of inflation around the world, which could be particularly challenging for developing economies with monetary policy guided by an inflation target. In this Letter, to assess this risk for a major emerging economy with an established inflation target, we examine the variation in Mexico’s nominal and inflation-indexed bond prices, while accounting for their respective liquidity risk premiums. This allows us to estimate Mexican bond investors’ inflation expectations and associated risk premiums. The results reveal that the inflation risk premium has pushed up Mexican BEI rates in recent years, while investors’ long-term inflation expectations have remained stable near the Bank of Mexico’s inflation target despite the rise in inflation.

The policy path needed to keep inflation expectations anchored in a situation with highly elevated inflation may involve tradeoffs. The Bank of Mexico responded early and forcefully to inflation pressures starting in June 2021 and has indicated further tightening of the policy rate would likely be appropriate to bring inflation back down to target over the medium term. This could lower economic growth in Mexico in both 2022 and 2023. On the other hand, history shows that it may be difficult and costly to reverse extended departures from announced inflation targets. Thus, it will be important for central banks with inflation-targeting frameworks to monitor measures of long-term inflation expectations in the current situation.

Remy Beauregard
Economics Ph.D. student, University of California at Davis

Jens H.E. Christensen
Research Advisor, Economic Research Department, Federal Reserve Bank of San Francisco

Eric Fischer
Financial modeling and quantitative analytics principal, Markets Group, Federal Reserve Bank of New York

Simon Zhu
Economics Ph.D. student, University of Texas at Austin

References

Andreasen, Martin M. and Jens H.E. Christensen. 2016. “TIPS Liquidity and the Outlook for Inflation.” [PDFFRBSF Economic Letter 2016-35 (November 21).

Beauregard, Remy, Jens H.E. Christensen, Eric Fischer, and Simon Zhu. 2021. “Inflation Expectations and Risk Premia in Emerging Bond Markets: Evidence from Mexico.” [PDF] FRB San Francisco Working Paper 2021-08.

De Pooter, Michiel, Patrice Robitaille, Ian Walker, and Michael Zdinak. 2014. “Are Long-Term Inflation Expectations Well Anchored in Brazil, Chile, and Mexico?” [PDFInternational Journal of Central Banking 10(2), pp. 337–400.
[Archived PDF]

Economics-Watching: FedViews for January 2023

[from the Federal Reserve Bank of San Francisco]

Adam Shapiro, vice president at the Federal Reserve Bank of San Francisco, stated his views on the current economy and the outlook as of January 12, 2023.

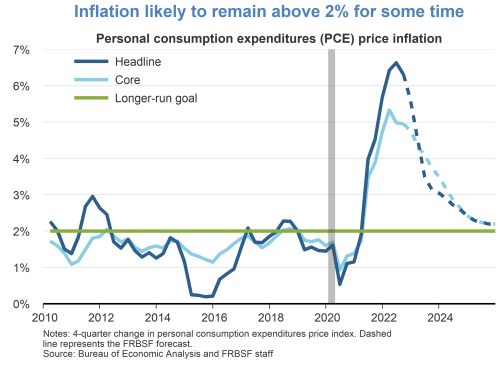
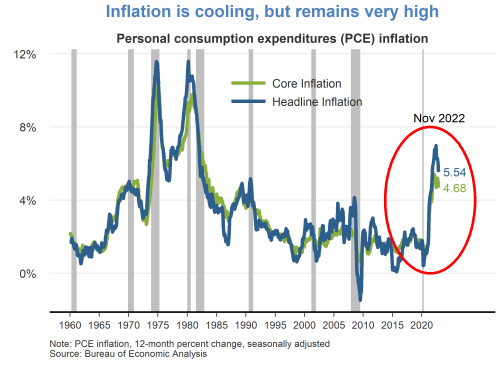
  • While continuing to cool over the last several months, 12-month inflation remains at historically high levels. The headline personal consumption expenditures (PCE) price index rose 5.5% in November 2022 from a year earlier. This marks a decline in inflation to a level last observed in October 2021, but still well above the Fed’s longer-run goal of 2%. A portion of the inflation moderation is attributable to recent declines in energy prices. Core PCE inflation, which removes food and energy prices, has shown less easing.
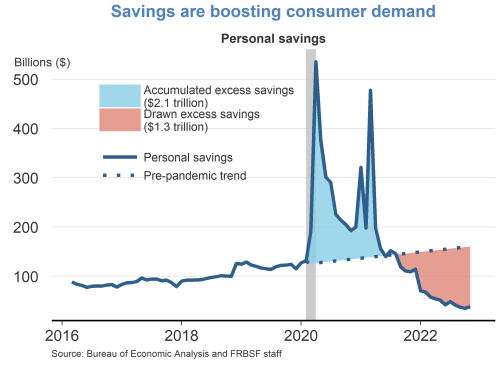
  • Owing to fiscal relief efforts and lower household spending over the course of the pandemic, consumers accumulated over $2 trillion dollars in excess savings, based on pre-pandemic trends. Since then, consumers have drawn down over half of this excess savings which has helped support recent growth in personal consumption expenditures. A considerable amount of accumulated savings remains for some consumers to support spending in 2023.
  • In the wake of the pandemic, consumer spending patterns shifted away from services towards goods. While there appears to be some normalization of spending behavior, this shift has generally persisted. Real goods spending remains significantly above its pre-pandemic trend, driven by strong demand for durables such as furniture, electronics, and recreational goods. Spending on services has shown a resurgence but remains below its pre-pandemic trend.
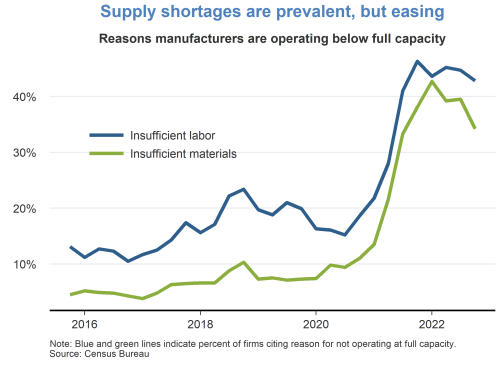
  • Supply chain bottlenecks for materials and labor remain a constraint on production, although there are some recent signs of easing. The fraction of manufacturers who reported operating below capacity due to insufficient materials peaked in late 2021 and has moderately declined over the past year. However, the fraction of manufacturers reporting insufficient labor has persisted at high levels.
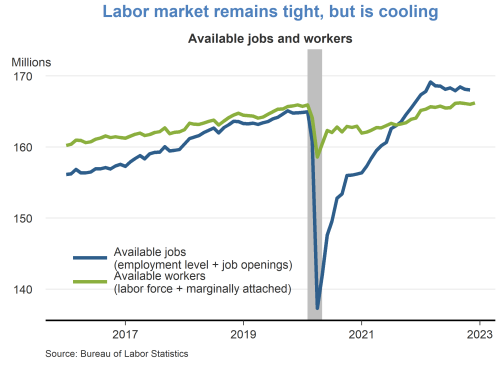
  • The labor market remains tight, despite some signs of cooling. The number of available jobs remains well above the number of available workers, although vacancy postings have been trending down in recent months. The tight labor market has put continued upward pressure on wages and labor market turnover.
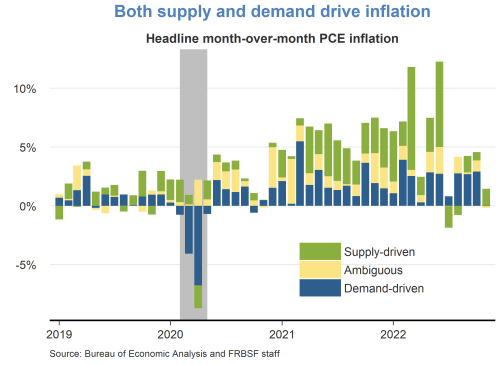
  • A decomposition of headline PCE inflation into supply– and demand-driven components shows that both supply and demand factors are responsible for the recent rise in inflation. The surge in inflation in early 2021 was mainly due to an increase in demand-driven factors. Subsequently, supply factors became more prevalent for the remainder of 2021. Supply-driven inflation has moderated significantly over recent months, while demand-driven inflation remains elevated.
  • The Federal Open Market Committee (FOMC) raised the federal funds rate by 50 basis points at the December meeting to a range of 4.25 to 4.5%. This cycle of continued rate increases since March of last year represents the fastest pace of monetary policy tightening in 40 years. The increase in the federal funds rate has been accompanied by a gradual reduction in the size of the Federal Reserve’s balance sheet.
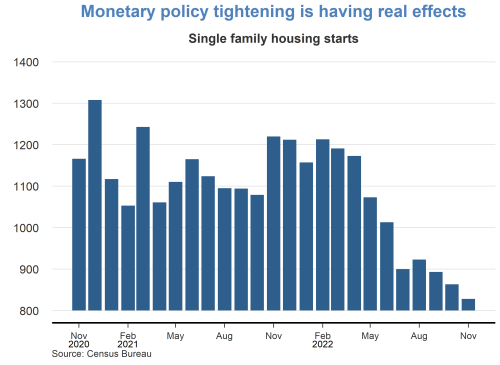
  • Economic activity in sectors such as housing, which is sensitive to rising interest rates, has slowed considerably in recent months. Housing starts have fallen steadily over the past year, as have other housing market indicators, such as existing home sales and house prices.
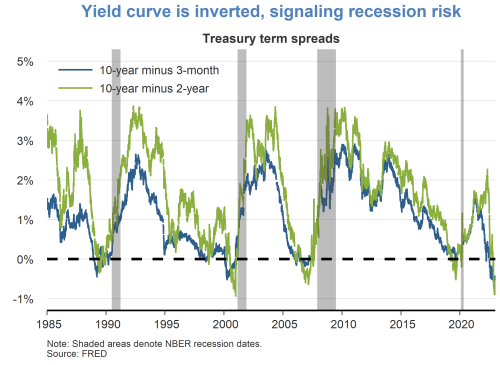
  • Although the labor market is currently very strong, financial markets are pointing to some downside risks. Namely, the difference between longer- and shorter-term interest rates has turned negative, which historically tends to occur immediately preceding recessions. It remains unclear whether lower longer-term yields are indicative of anticipated slower growth or lower inflation.
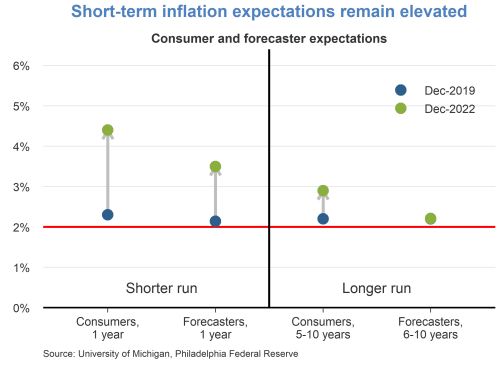
  • Short-term inflation expectations remain elevated relative to their pre-pandemic levels in December 2019. Consumers are expecting prices to rise 5% this year, while professional forecasters are expecting prices to rise 3.5%. Longer-term inflation expectations remain more subdued, indicating that both consumers and professionals believe inflation pressures will eventually dissipate.
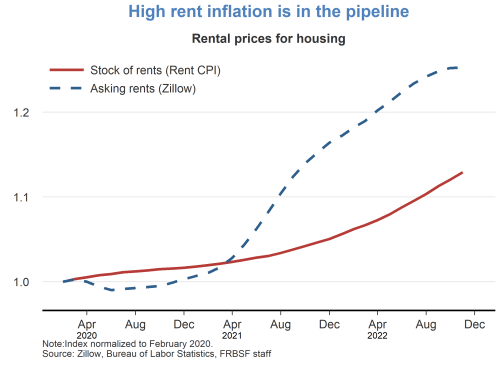
  • Rent inflation is expected to remain high over the next year. The prices for asking rents have grown quite substantially over the last two years. As new leases begin and existing leases are renewed, these higher asking rents will flow into the stock of rental units, putting upward pressure on rent inflation.
  • We are expecting inflation to moderate over the next few years as monetary policy continues to restrain demand and supply bottlenecks continue to ease. We anticipate that it will take some time for inflation to reach the Fed’s longer-run goal of 2%.
Inflation is cooling, but remains very high
Savings are boosting consumer demand
Goods consumption remains elevated
Supply shortages are prevalent, but easing
Labor market remains tight, but is cooling
Both supply and demand drive inflation
Monetary policy tightening is having real effects
Yield curve is inverted, signaling recession risk
Short-term inflation expectations remain elevated
High rent inflation is in the pipeline
Inflation likely to remain above 2% for some time

[Archived PDF]

Read other issues from FedViews.

Economics-Watching: Fourth-Quarter GDP Growth Estimate Inches Up

The growth rate of real gross domestic product (GDP) is a key indicator of economic activity, but the official estimate is released with a delay. Our GDPNow forecasting model provides a “nowcast” of the official estimate prior to its release by estimating GDP growth using a methodology similar to the one used by the U.S. Bureau of Economic Analysis.

GDPNow is not an official forecast of the Atlanta Fed. Rather, it is best viewed as a running estimate of real GDP growth based on available economic data for the current measured quarter. There are no subjective adjustments made to GDPNow—the estimate is based solely on the mathematical results of the model. In particular, it does not capture the impact of COVID-19 and social mobility beyond their impact on GDP source data and relevant economic reports that have already been released. It does not anticipate their impact on forthcoming economic reports beyond the standard internal dynamics of the model.

Recent forecasts for the GDPNow model are available here. More extensive numerical details—including underlying source data, forecasts, and model parameters—are available as a separate spreadsheet. You can also view an archive of recent commentaries from GDPNow estimates.

Please note that the Federal Reserve no longer supports the GDPNow app. Download the Federal Reserve’s EconomyNow app or go to the Atlanta Fed’s website to continue to get the latest GDP nowcast and more economic data.

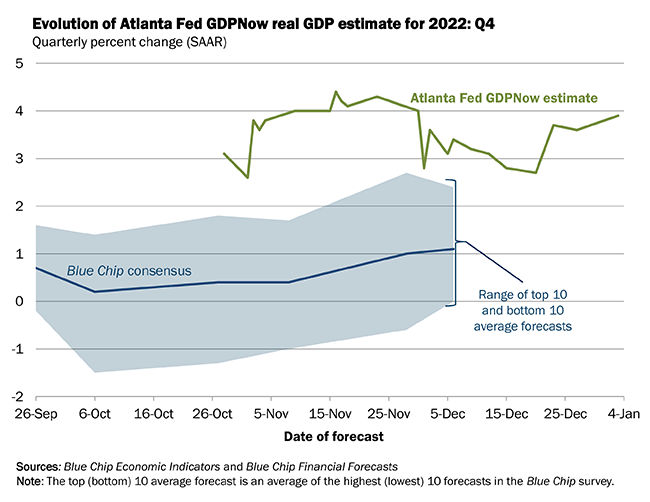
Latest estimate: 3.9 percent — January 3, 2023

The GDPNow model estimate for real GDP growth (seasonally adjusted annual rate) in the fourth quarter of 2022 is 3.9 percent on January 3, up from 3.7 percent on December 23. After last week’s Advance Economic Indicators report from the U.S. Census Bureau and this morning’s construction spending release from the U.S. Census Bureau, the nowcasts of fourth-quarter real gross private domestic investment growth and fourth-quarter real government spending growth increased from 3.8 percent and 0.8 percent, respectively, to 6.1 percent and 1.0 percent, respectively, while the nowcast of the contribution of the change in real net exports to fourth-quarter real GDP growth decreased from 0.35 percentage points to 0.17 percentage points.

Preparing for the 2020 Round: Select Topics in International Censuses

[from the U.S. Census Bureau, December 9, 2022]

The U.S. Census Bureau is pleased to announce the release of additional technical notes in the series entitled Select Topics in International Censuses. Each one highlights a new subject or method relevant to census planners in middle-to low-income countries. They complement the U.N. Principles and Recommendations for Population and Housing Censuses [archived PDF] by describing select topics in more detail.

The new notes [archived PDFs] focus on:

Sponsored by the U.S. Agency for International Development (USAID) and prepared by U.S. Census Bureau experts, the Select Topics in International Censuses series is designed to assist staff in NSOs to address some of their most pressing census issues.

Technical notes on other topics are in development and will be released in the near future.

First Clean Energy Cybersecurity Accelerator Participants Begin Technical Assessment

[From the National Renewable Energy Laboratory (NREL) News]

Program Selected Three Participants for Cohort 1

The Clean Energy Cybersecurity Accelerator™ (CECA)’s first cohort of solution providers—Blue Ridge Networks, Sierra Nevada Corporation, and Xage—recently began a technical assessment of their technologies that offer strong authentication solutions for distributed energy resources.

The selected solution providers will take part in a six-month acceleration period, where solutions will be evaluated in the Advanced Research on Integrated Energy Systems (ARIES) cyber range.

Working with its partners, CECA identified urgent security gaps, supporting emerging technologies as they build security into new technologies at the earliest stage—when security is most effective and efficient. The initiative is managed by the U.S. Department of Energy’s (DOE’s) National Renewable Energy Laboratory (NREL) and sponsored by DOE’s Office of Cybersecurity, Energy Security, and Emergency Response (CESER) and utility industry partners in collaboration with DOE’s Office of Energy Efficiency and Renewable Energy (EERE).

“We are thrilled to welcome and work with the first participants to the secure energy transformation,” said Jon White, director of NREL’s Cybersecurity Program Office. “These cyber-solution providers will work with NREL, using its world-class capabilities, to develop their ideas into real-world solutions. We are ready to build security into technologies at the early development stages when most effective and efficient.”

The selected innovators:

Blue Ridge Networks’ LinkGuard system “cloaks” critical information technology network operations from destructive and costly cyberattacks. The system overlays onto existing network infrastructure to secure network segments from external discovery or data exfiltration. Through a partnership with Schneider Electric, Blue Ridge Networks helped deploy a solution to protect supervisory control and data acquisition (SCADA) systems for the utility industry.

Sierra Nevada Corporation (SNC)’s Binary Armor® is used by the U.S. Department of Defense and utilities to protect critical assets, with the help of subject matter experts to deliver cyber solutions. SNC plans to integrate as a software solution into a communication gateway or other available edge processing to provide a scalable solution to enforce safe operation in an unauthenticated ecosystem. SNC currently helps secure heating, ventilation, and air conditioning systems; programmable logical controllers; and wildfire detection, with remote monitoring for two different utilities.

Xage uses identity-based access control to protect users, machines, apps, and data, at the edge and in the cloud, enforcing zero-trust access to secure operations and data universally. To test technology in energy sector environments, Xage provides zero-trust remote access, has demonstrated proofs of concept, and deploys local and remote access at various organizations.

Three major U.S. utilities, with more expected to join, are partners with CECA: Berkshire Hathaway Energy, Duke Energy and Xcel Energy. At the end of each cohort cycle, cyber innovators will present their solutions to the utilities with the goal to make an immediate impact.

Additionally, CECA participants benefit from access to NREL’s unique testing and evaluation capabilities, including its ARIES cyber range, developed with support from EERE. The ARIES cyber range provides one of the most advanced simulation environments with unparalleled real-time situational awareness and visualization to evaluate renewable energy system defenses.

Applications for the second CECA cohort will open in early January 2023 for providers offering solutions that uncover hidden risks due to incomplete system visibility and device security and configuration.

NREL is the U.S. Department of Energy’s primary national laboratory for renewable energy and energy efficiency research and development. NREL is operated for DOE by the Alliance for Sustainable Energy LLC.

Webinar: Creating Differentiation in an Increasingly Competitive Logistics Market

[from FreightWaves]

You can’t control what you can’t see. The market is feverishly growing as more 3PLs see visibility as a strategic advantage. Given the communications and compliance blind spots in a supply chain where double loading and double brokering have become more common and 3PLs are turning to unfamiliar carriers in a search for capacity, 3PLs with superior technology can separate themselves from the pack. 

Join FreightWaves as they partner with Overhaul for a live webinar on Thursday, August 4 at 11 AM ET (45 minutes), where they will discuss how you can win in the current market not just by being reliable—but by being transparent and proving the integrity and security of the products you’ve been trusted to move.

Featured speakers will include:
• Frankie Mossman, Chief Customer Officer, Overhaul
• Sara Lieser, Senior Vice President of Partnerships, Overhaul 

Register today to join FreightWaves & Overhaul for the live session.

UN DESA Global Policy Dialogue Series: The Future of Sustainable Development Financing

Thursday, 14 April 2022, 8:30-10:00 AM EDT

  • What should be the role of development banks in closing financing gaps?
  • What tools or guidance documents for responsible borrowing and lending exist, and how can they be useful?
  • How can the global community better support the most vulnerable countries and ease their debt burdens?

Two years into the pandemic, COVID-19 has exposed and exacerbated global inequalities and set back hard-earned progress towards achieving the Sustainable Development Goals (SDGs). It is critical that the global community work together to avoid the catastrophic situation in which one group of countries recovers, and another sinks deeper into a cycle of poverty and unsustainable debt. To support efforts to overcome the great finance divide, the United Nations Department of Economic and Social Affairs (UN DESA) will host a discussion with experts exploring ideas to improve access to affordable financing as well as how to resolve situations of unsustainable sovereign debt. Speakers will examine the latest findings from UN DESA’s new report, the 2022 Financing for Sustainable Development Report.

Register here by 13 April 2022.

More information.

The event is free and open to all, and will be streamed live on UN DESA’s Facebook page. It will be held in English with captions available in Arabic, Chinese, English, French, Russian and Spanish, and translation into American Sign Language. The event is made possible by the United Nations Peace and Development Trust Fund. All are welcome!

Bank of England Statistical Releases—February 2022

(from the Bank of England)

Money and Credit

Overview

These monthly statistics on the amount of, and interest rates on, borrowing and deposits by households and businesses are used by the Bank’s policy committees to understand economic trends and developments in the UK banking system.

Key Points
  • Net borrowing of mortgage debt by individuals amounted to £4.7 billion in February. Mortgage approvals for house purchases fell slightly to 71,000 in February, from 73,800 in January, but remains above the 12-month pre-pandemic average up to February 2020 of 66,700.
  • Consumers borrowed an additional £1.9 billion in consumer credit, on net, of which £1.5 billion was new lending on credit cards.
  • Sterling money (known as M4ex) increased by £7.2 billion in February. Households’ holdings of money weakened with net flows of £4.0 billion, compared with £7.2 billion in January.
  • The effective interest rate paid on individuals’ new time deposits with banks and building societies rose by 10 basis points to 0.77%.
  • Large businesses borrowing from banks rose to £4.0 billion in February, whilst small and medium sized businesses repaid £0.5 billion. Private non-financial companies (PNFCs) redeemed £4.1 billion in net finance from capital markets.

Read the full paper [Archived PDF].

Effective Interest Rates

Commentary on this data is now incorporated into the Money and Credit statistical release [Archived PDF, from above] to facilitate analysis.

Get the data tables [Archived Excel XLS].

BEA News: Gross Domestic Product (Third Estimate), Corporate Profits, and GDP by Industry, Fourth Quarter and Year 2021

(from the U.S. Bureau of Economic Analysis)

The U.S. Bureau of Economic Analysis (BEA) has issued the following news release today:

Real gross domestic product (GDP) increased at an annual rate of 6.9 percent in the fourth quarter of 2021, following an increase of 2.3 percent in the third quarter. The increase was revised down 0.1 percentage point from the “second” estimate released in February. The acceleration in the fourth quarter was led by an acceleration in inventory investment, upturns in exports and residential fixed investment and an acceleration in consumer spending. In the fourth quarter, COVID-19 cases resulted in continued restrictions and disruptions in the operations of establishments in some parts of the country. Government assistance payments in the form of forgivable loans to businesses, grants to state and local governments, and social benefits to households all decreased as provisions of several federal programs expired or tapered off.

Profits from current production (corporate profits with inventory valuation and capital consumption adjustments) increased $20.4 billion in the fourth quarter, compared with an increase of $96.9 billion in the third quarter.

Private goods-producing industries increased 5.4 percent, private services-producing industries increased 8.5 percent, and government increased 0.1 percent. Overall, 19 of 22 industry groups contributed to the fourth-quarter increase in real GDP.

Read the full report [Archived PDF].

European Central Bank’s Macroprudential Bulletin

The European Central Bank’s Macroprudential Bulletin provides insight into the work they are currently doing in the field of macroprudential policy. Their goal is to raise awareness of macroprudential policy issues in the euro area by making their ongoing work and thinking in this field more transparent, and to encourage broader discussion on these key issues.

January 2022, Issue 16

Reforming money market funds

Money market funds perform a key function for the financial system by linking the short-term funding and cash-management needs of various market participants. Proposals to reform the regulation of these funds and enhance the sector’s resilience are assessed in this issue of the Macroprudential Bulletin.

Assessing possible reform proposals

At the onset of the coronavirus pandemic, money market funds proved particularly vulnerable when faced with severe market disruption. This article looks at specific policies to address the liquidity risk of these funds and ensure they can deal with large and unexpected outflows under similar periods of stress.

[Archived PDF of full article]

The impact of a public debt quota on money market funds

Public debt assets tend to be easier to draw down and sell during market stress than private sector debt. Having a minimum public debt quota for private debt money market funds could increase their shock-absorbing capacity. What are the costs and benefits of such a proposal?

[Archived PDF of full article]