World-Watching: Container Shipping Financial Insight, Nov. 2023

[from Drewry Shipping Consultants]

Driven by weak 3Q23 financial results, the Drewry Container Equity Index decreased 3.7% last month (as of 22 Nov 2023). Additionally, asset prices continue to fall due to the supply-demand imbalance.

  • Container shipping companies’ 3Q23 financial results showcased a sharp dip in profits or even losses. On a group level, eleven liners (which report quarterly results) among our portfolio of 13 companies reported an average slump of 54.6% YoY in their 3Q23 topline. Operating costs declined 18.1% YoY amid falling chartering costs and lowering bunker prices. However, the cost reduction was insufficient to offset the plunge in topline; thus, EBIT contracted 94.1% YoY on average.
  • The Drewry Container Equity Index tumbled 28.1% YTD 2023 (ending 22 November), driven by lowering freight rates (WCI: -30.7% in YTD 2023), which squeezed earnings over the quarters. On the contrary, the S&P 500 posted an 18.4% growth. The Drewry Container Equity Index declined 3.4% in the month ending 22 November 2023. Talking about equity prices individually, APMM’s stock price fell 9.0% amid EBIT loss for its Ocean segment in 3Q23, staff cuts and reduced capex guidance, highlighting APMM’s efforts toward reducing costs faced with the bleak industry outlook. Hapag-Lloyd’s stock price slumped 22.2% as its EBIT margin (3Q23: 5.1%) slid below its pre-pandemic level (3Q19: 7.8%). ZIM became the first carrier to report impairment of assets worth USD 2.0bn in 3Q23, and its stock price fell 18.1%. Meanwhile, China-exposed container companies benefitted from the positive sentiment arising from the proposed fiscal stimulus by the Chinese government, possibly boosting the out-of-China and intra-Asia trades. Asian stocks in the broader index rose 2.0% to 19.4% in the month ending 22 November 2023.
  • Mainly driven by weak earnings prospects, the Drewry Container Equity Index trades at a P/B of 0.5x, a 47.5% discount to its pre-pandemic average (2013-19). We expect freight rates to fall sharply in 2024 and increasingly incur losses. Thus, we expect the multiple to remain suppressed.
  • As the fleet of container shipping companies expands, the charter market softens. For instance, 1-year TC rates declined 14.2% and 52.5% YoY in October for vessels sized 1,110 teu and 8,500 teu. Rates declined more for larger vessels as these constitute the majority of the order book and new deliveries. The YoY decline has continued since October 2022, but rates improved slightly during April-May 2023. However, this was not due to the fundamentally strong market but MSC and CMA CGM’s aggressive chartering of vessels to expand their fleets. Now that the two companies have stopped chartering in vessels, the charter market continues to decline.
  • Driven by the softening charter market, second-hand asset prices are also weakening. In October, on a YoY basis, prices for five-year-old vessels (2,700 teu and 7,200 teu) contracted 30.6% and 31.5%, and for 10-year-old ships, prices tumbled between 36.7% and 53.2%. Contrary to the sale and purchase market, newbuild prices (1,500 teu and 14,000 teu) continue to increase and rose by an average of 2.2% YoY, led by a shortage of capacity in shipyards.
  • The charter market and the S&P market have a direct impact on container shipping companies’ earnings. Costs related to chartering-in slots or vessels from other non-operating vessel owners form a significant portion of container shipping companies’ cost structure. In the 3Q23 results, this cost was reduced,
    marginally relieving downside pressure on the operating margin of container shipping companies. In line with the declining charter market, we expect this trend to continue in 4Q23. We also expect other companies to follow ZIM in reporting impairment losses as prices for older vessels continue to fall.

Read the report [archived PDF] for additional graphs.

Economics-Watching: Multivariate Core Trend Inflation

[from the Federal Reserve Bank of New York]

Overview

The Multivariate Core Trend (MCT) model measures inflation’s persistence in the seventeen core sectors of the personal consumption expenditures (PCE) price index.

Whether inflation is short-lived or persistent, concentrated in a few sectors or broad-based, is of deep relevance to policymakers. We estimate a dynamic factor model on monthly data for the major sectors of the personal consumption expenditures (PCE) price index to assess the extent of inflation persistence and its broadness. The results give a measure of trend inflation and shed light on whether inflation dynamics are dominated by a trend common across sectors or are sector-specific.

The New York Fed updates the MCT estimates and share sectoral insights at or shortly after 2 p.m. on the first Monday after the release of personal consumption expenditures (PCE) price index data from the Bureau of Economic Analysis. Data are available for download.

September 2023 Update

  • Multivariate Core Trend (MCT) inflation was 2.9 percent in September, a 0.3 percentage point increase from August (which was revised up from 2.5 percent). The 68 percent probability band is (2.4, 3.3).
  • Services ex-housing accounted for 0.54 percentage point (ppt) of the increase in the MCT estimate relative to its pre-pandemic average, while housing accounted for 0.50 ppt. Core goods had the smallest contribution, 0.03 ppt.
  • A large part of the persistence in housing and services ex-housing is explained by the sector-specific component of the trend.

Latest Release: 2:00 p.m. ET October 31, 2023

View the Multivariate Core Trend of PCE Inflation data here.

Frequently Asked Questions

What is the goal of the Multivariate Core Trend (MCT) analysis?

The New York Fed aims to provide a measure of inflation’s trend, or “persistence,” and identify where the persistence is coming from.

What data are reported?

The New York Fed’s interactive charts report monthly MCT estimates from 1960 to the present. The New York Fed also provides estimates of how much three broad sectors (core goods, core services excluding housing, and housing) are contributing to overall trend inflation over the same time span. The New York Fed further distinguishes whether the persistence owes to common or sector-specific components. Data are available for download.

What is the release schedule?

The New York Fed updates the estimate of inflation persistence and share sectoral insights following the release of PCE price data from the U.S. Bureau of Economic Analysis each month.

What is the modeling strategy?

A dynamic factor model with time-varying parameters is estimated on monthly data for the seventeen major sectors of the PCE price index. The model decomposes each sector’s inflation as the sum of a common trend, a sector-specific trend, a common transitory shock, and a sector-specific transitory shock. The trend in PCE inflation is constructed as the sum of the common and the sector-specific trends weighted by the expenditure shares.

The New York Fed uses data from all seventeen of the PCE’s sectors; however, in constructing the trend in PCE inflation, we exclude the volatile non-core sectors (that is, food and energy). The approach builds on Stock and Watson’s 2016 “Core Inflation and Trend Inflation.”

How does the MCT measure differ from the core personal consumption expenditures (PCE) inflation measure?

The core inflation measure simply removes the volatile food and energy components. The MCT model seeks to further remove the transitory variation from the core sectoral inflation rates. This has been key in understanding inflation developments in recent years because, during the pandemic, many core sectors (motor vehicles and furniture, for example) were hit by unusually large transitory shocks. An ideal measure of inflation persistence should filter those out.

PCE data are subject to revision by the Bureau of Economic Analysis (BEA). How does that affect MCT estimates?

BEA monthly revisions as well as other BEA periodic revisions to PCE price data do lead to reassessments of the estimated inflation persistence as measured by the MCT estimates. Larger revisions may lead to a more significant reassessment. A recent example of the latter case is described on Liberty Street Economics in “Inflation Persistence: Dissecting the News in January PCE Data.”

Historical estimates in our MCT data series back to 1960 are based on the latest vintage of data available and incorporate all prior revisions.

How does the MCT Inflation measure relate to other inflation measures?

The MCT model adds to the set of tools that aim at measuring the persistent component of PCE price inflation. Some approaches, such as the Cleveland Fed’s Median PCE and the Dallas Fed’s Trimmed Mean, rely on the cross-sectional distribution of price changes in each period. Other approaches, such as the New York Fed’s Underlying Inflation Gauge (UIG), rely on frequency-domain time series smoothing methods. The MCT approach shares some features with them, namely: exploiting the cross-sectional distribution of price changes and using time series smoothing techniques. But the MCT model also has some unique features that are relevant to inflation data. For example, it allows for outliers and for the noisiness of the data and for the relation with the common component to change over time.

How useful can MCT data be for policymakers?

The MCT model provides a timely measure of inflationary pressure and provides insights on how much price changes comove across sectors.

View the Multivariate Core Trend of PCE Inflation data here.

Economics-Watching: “Doing Nothing” Is Still Doing a Lot

[from the Federal Reserve Bank of Philadelphia, speech by Patrick T. Harker President and Chief Executive Officer at the National Association of Corporate Directors Webinar, Philadelphia, PA (Virtual)]

Good afternoon, everyone.

I appreciate that you’re all giving up part of the end of your workday for us to be together, if only virtually.

My thanks to my good friend, Rick Mroz, for that welcome and introduction.

I do believe we’re going to have a productive session. But just so you all know, as much as I enjoy speaking and providing my outlook, I enjoy a good conversation even more.

So, first, let’s take a few minutes so I can give you my perspective on where we are headed, and then I will be more than happy to take questions and hear what’s on your minds.

But before we get into any of that, I must begin with the standard Fed disclaimer: The views I express today are my own and do not necessarily reflect those of anyone else on the Federal Open Market Committee (FOMC) or in the Federal Reserve System.

Put simply, this is one of those times where the operative words are, “Pat said,” not “the Fed said.”

Now, to begin, I’m going to first address the two topics that I get asked about most often: interest rates and inflation. And I would guess they are the topics front and center in many of your minds as well.

After the FOMC’s last policy rate hike in July, I went on record with my view that, if economic and financial conditions evolved roughly as I expected they would, we could hold rates where they are. And I am pleased that, so far, economic and financial conditions are evolving as I expected, if not perhaps even a tad better.

Let’s look at the current dynamics. There is a steady, if slow, disinflation under way. Labor markets are coming into better balance. And, all the while, economic activity has remained resilient.

Given this, I remain today where I found myself after July’s meeting: Absent a stark turnabout in the data and in what I hear from contacts, I believe that we are at the point where we can hold rates where they are.

In barely more than a year, we increased the policy rate by more than 5 percentage points and to its highest level in more than two decades — 11 rate hikes in a span of 12 meetings prior to September. We not only did a lot, but we did it very fast.

We also turned around our balance sheet policy — and we will continue to tighten financial conditions by shrinking the balance sheet.

The workings of the economy cannot be rushed, and it will take some time for the full impact of the higher rates to be felt. In fact, I have heard a plea from countless contacts, asking to give them some time to absorb the work we have already done.

I agree with them. I am sure policy rates are restrictive, and, as long they remain so, we will steadily press down on inflation and bring markets into a better balance.

Holding rates steady will let monetary policy do its work. By doing nothing, we are still doing something. And I would argue we are doing quite a lot.

Headline PCE inflation remained elevated in August at 3.5 percent year over year, but it is down 3 percentage points from this time last year. About half of that drop is due to the volatile components of energy and food that, while basic necessities, they are typically excluded by economists in the so-called core inflation rate to give a more accurate assessment of the pace of disinflation and its likely path forward.

Well, core PCE inflation has also shown clear signs of progress, and the August monthly reading was its smallest month-over-month increase since 2020.

So, yes, a steady disinflation is under way, and I expect it to continue. My projection is that inflation will drop below 3 percent in 2024 and level out at our 2 percent target thereafter.

However, there can be challenges in assessing the trends in disinflation. For example, September’s CPI report came out modestly on the upside, driven by energy and housing.

Let me be clear about two things. First, we will not tolerate a reacceleration in prices. But second, I do not want to overreact to the normal month-to-month variability of prices. And for all the fancy techniques, the best way to separate a signal from noise remains to average data over several months. Of course, to do so, you need several months of data to start with, which, in turn, demands that, yes, we remain data-dependent but patient and cautious with the data.

Turning to the jobs picture, I do anticipate national unemployment to end the year at about 4 percent — just slightly above where we are now — and to increase slowly over the next year to peak at around 4.5 percent before heading back toward 4 percent in 2025. That is a rate in line with what economists call the natural rate of unemployment, or the theoretical level in which labor market conditions support stable inflation at 2 percent.

Now, that said, as you know, there are many factors that play into the calculation of the unemployment rate. For instance, we’ve seen recent months where, even as the economy added more jobs, the unemployment rate increased because more workers moved off the sidelines and back into the labor force. There are many other dynamics at play, too, such as technological changes or public policy issues, like child care or immigration, which directly impact employment.

And beyond the hard data, I also have to balance the soft data. For example, in my discussions with employers throughout the Third District, I hear that given how hard they’ve worked to find the workers they currently have, they are doing all they can to hold onto them.

So, to sum up the labor picture, let me say, simply, I do not expect mass layoffs.

do expect GDP gains to continue through the end of 2023, before pulling back slightly in 2024. But even as I foresee the rate of GDP growth moderating, I do not see it contracting. And, again, to put it simply, I do not anticipate a recession.

Look, this economy has been nothing if not unpredictable. It has proven itself unwilling to stick to traditional modeling and seems determined to not only bend some rules in one place, but to make up its own in another. However, as frustratingly unpredictable as it has been, it continues to move along.

And this has led me to the following thought: What has fundamentally changed in the economy from, say, 2018 or 2019? In 2018, inflation averaged 2 percent almost to the decimal point and was actually below target in 2019. Unemployment averaged below 4 percent for both years and was as low as 3.5 percent — both nationwide and in our respective states — while policy rates peaked below 2.5 percent.

Now, I’m not saying we’re going to be able to exactly replicate the prepandemic economy, but it is hard to find fundamental differences. Surely, I cannot and will not minimize the immense impacts of the pandemic on our lives and our families, nor the fact that for so many, the new normal still does not feel normal. From the cold lens of economics, I do not see underlying fundamental changes. I could also be wrong, and, trust me, that would not be the first time this economy has made me rethink some of the classic models. We just won’t know for sure until we have more data to look at over time.

And then, of course, there are the economic uncertainties — both national and global — against which we also must contend. The ongoing auto worker strike, among other labor actions. The restart of student loan payments. The potential of a government shutdown. Fast-changing events in response to the tragic attacks against Israel. Russia’s ongoing war against Ukraine. Each and every one deserves a close watch.

These are the broad economic signals we are picking up at the Philadelphia Fed, but I would note that the regional ones we follow are also pointing us forward.

First, while in the Philadelphia Fed’s most recent business outlook surveys, which survey manufacturing and nonmanufacturing firms in the Third District, month-over-month activity declined, the six-month outlooks for each remain optimistic for growth.

And we also publish a monthly summary metric of economic activity, the State Coincident Indexes. In New Jersey, the index is up slightly year over year through August, which shows generally positive conditions. However, the three-month number from June through August was down, and while both payroll employment and average hours worked in manufacturing increased during that time, so did the unemployment rate — though a good part of that increase can be explained as more residents moved back into the labor force.

And for those of you joining us from the western side of the Delaware River, Pennsylvania’s coincident index is up more than 4 percent year over year through August and 1.7 percent since June. Payroll employment was up, and the unemployment rate was down; however, the number of average hours worked in manufacturing decreased.

There are also promising signs in both states in terms of business formation. The number of applications, specifically, for high-propensity businesses — those expected to turn into firms with payroll — are remaining elevated compared with pre-pandemic levels. Again, a promising sign.

So, it is against this full backdrop that I have concluded that now is the time at which the policy rate can remain steady. But I can hear you ask: “How long will rates need to stay high.” Well, I simply cannot say at this moment. My forecasts are based on what we know as of late 2023. As time goes by, as adjustments are completed, and as we have more data and insights on the underlying trends, I may need to adjust my forecasts, and with them my time frames.

I can tell you three things about my views on future policy. First, I expect rates will need to stay high for a while.

Second, the data and what I hear from contacts and outreach will signal to me when the time comes to adjust policy either way. I really do not expect it, but if inflation were to rebound, I know I would not hesitate to support further rate increases as our objective to return inflation to target is, simply, not negotiable.

Third, I believe that a resolute, but patient, monetary policy stance will allow us to achieve the soft landing that we all wish for our economy.

Before I conclude and turn things over to Rick to kick off our Q&A, I do want to spend a moment on a topic that he and I recently discussed, and it’s something about which I know there is generally great interest: fintech. In fact, I understand there is discussion about NACD hosting a conference on fintech.

Well, last month, we at the Philadelphia Fed hosted our Seventh Annual Fintech Conference, which brought business and thought leaders together at the Bank for two days of real in-depth discussions. And I am extraordinarily proud of the fact that the Philadelphia Fed’s conference has emerged as one of the premier conferences on fintech, anywhere. Not that it’s a competition.

I had the pleasure of opening this year’s conference, which always puts a focus on shifts in the fintech landscape. Much of this year’s conference centered around developments in digital currencies and crypto — and, believe me, some of the discussions were a little, shall we say, “spirited.” However, my overarching point to attendees was the following: Regardless of one’s views, whether in favor of or against such currencies, our reality requires us to move from thinking in terms of “what if” to thinking about “what next.”

In many ways, we’re beyond the stage of thinking about crypto and digital currency and into the stage of having them as reality — just as AI has moved from being the stuff of science fiction to the stuff of everyday life. What is needed now is critical thinking about what is next. And we at the Federal Reserve, both here in Philadelphia and System-wide, are focused on being part of this discussion.

We are also focused on providing not just thought leadership but actionable leadership. For example, the Fed rolled out our new FedNow instant payment service platform in July. With FedNow, we will have a more nimble and responsive banking system.

To be sure, FedNow is not the first instant payment system — other systems, whether operated by individual banks or through third parties, have been operational for some time. But by allowing banks to interact with each other quickly and efficiently to ensure one customer’s payment becomes another’s deposit, we are fulfilling our role in providing a fair and equitable payment system.

Another area where the Fed is assuming a mantle of leadership is in quantum computing, or QC, which has the potential to revolutionize security and problem-solving methodologies throughout the banking and financial services industry. But that upside also comes with a real downside risk, should other not-so-friendly actors co-opt QC for their own purposes.

Right now, individual institutions and other central banks globally are expanding their own research in QC. But just as these institutions look to the Fed for economic leadership, so, too, are they looking to us for technological leadership. So, I am especially proud that this System-wide effort is being led from right here at the Philadelphia Fed.

I could go on and talk about fintech for much longer. After all, I’m actually an engineer more than I am an economist. But I know that Rick is interested in starting our conversation, and I am sure that many of you are ready to participate.

But one last thought on fintech — my answers today aren’t going to be generated by ChatGPT.

On that note, Rick, thanks for allowing me the time to set up our discussion, and let’s start with the Q&A.

[archived PDF of the above speech]
Economics-Watching: Third-Quarter GDP Growth Estimate Increased

[from the Federal Reserve Bank of Atlanta’s GDPNow]

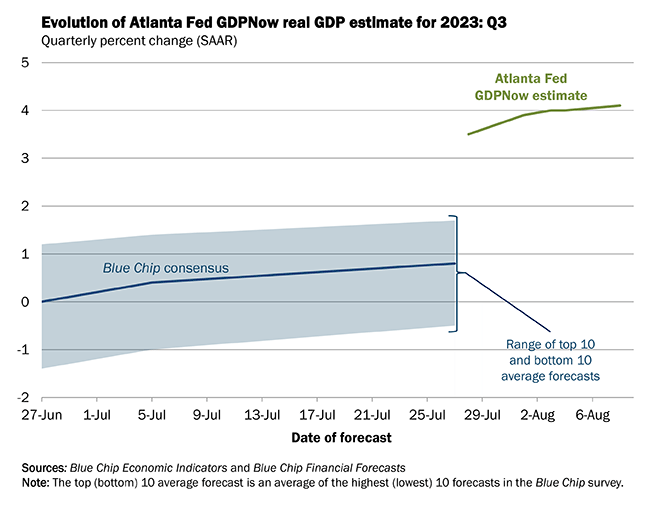
The growth rate of real gross domestic product (GDP) is a key indicator of economic activity, but the official estimate is released with a delay. The Federal Reserve Bank of Atlanta’s GDPNow forecasting model provides a “nowcast” of the official estimate prior to its release by estimating GDP growth using a methodology similar to the one used by the U.S. Bureau of Economic Analysis.

GDPNow is not an official forecast of the Atlanta Fed. Rather, it is best viewed as a running estimate of real GDP growth based on available economic data for the current measured quarter. There are no subjective adjustments made to GDPNow—the estimate is based solely on the mathematical results of the modelIn particular, it does not capture the impact of COVID-19 and social mobility beyond their impact on GDP source data and relevant economic reports that have already been released. It does not anticipate their impact on forthcoming economic reports beyond the standard internal dynamics of the model.

The GDPNow model estimate for real GDP growth (seasonally adjusted annual rate) in the third quarter of 2023 is 4.1 percent on August 8, up from 3.9 percent on August 1. After recent releases from the U.S. Census Bureau, the Institute for Supply Management, the U.S. Bureau of Economic Analysis, and the U.S. Bureau of Labor Statistics, an increase in the nowcast of third-quarter real gross private domestic investment growth from 5.2 percent to 8.1 percent was slightly offset by decreases in the nowcasts of third-quarter real personal consumption expenditures growth and third-quarter real government spending growth from 3.5 percent and 2.9 percent, respectively, to 3.2 percent and 2.7 percent, while the nowcast of the contribution of the change in real net exports to second-quarter real GDP growth increased from 0.08 percentage points to 0.11 percentage points.

The next GDPNow update is Tuesday, August 15.

Zheng Yongnian (郑永年) on How to Address Western Public Opinion on China: Facts, Science and Reason

[from Pekingology at the Center for China and Globalization (CCG)]

“Be open, open, and more open,” especially to businesses, investors, media, universities, and research institutions. And tit-for-tat doesn’t work, the professor says.

by Zichen Wang, Shuyuan Han, and Li Huiyan

Professor Zheng Yongnian (郑永年), the Founding Director of the Institute for International Affairs at the Chinese University of Hong Kong, Shenzhen, on January 28 published an article on how China should address Western public opinion on China. His advice is in the last part of the article, and below is a translation.

(Emphasis by Pekingnology.)

First, we need to understand how such narratives are formed. Historically, China held a bias due to its self-isolation and limited knowledge of the West. Despite losing the two Opium Wars, Chinese intellectuals at that time still saw Westerners as uncivilized. It was not until China was defeated by Japan, a neighboring country once considered as China’s student, that they realized their ignorance and a need for reform. Before China’s Reform and Opening up, Chinese people barely knew anything about the West. They always assumed Westerners were in deep distress, repeating the same lack of understanding of the West.

Similarly, the West’s uncertainty and fear towards China’s rise stem from a lack of understanding and even fear of the country, and their ingrained ideology would lead to misconceptions.

China is the world’s second-largest economy. The externalities and influence of its economy on the West are obvious. Upon joining the WTO, some Chinese people also felt unsettled by the externalities of the West. Some said, “the wolf is coming.” Now it is the West that is experiencing such worries.

It is crucial to recognize the significant impact of the Western hypocritical narratives against China, even if they are based on ideology rather than facts. We must also acknowledge that ideology-based public opinion from the West can exert a powerful influence on their policies toward China.

Historically, the West tended to demonize others while presenting themselves as morally superior, which enabled them to apply Social Darwinism to international politics easily and thus legitimizing conflicts and even wars with other nations. Given the Soviet Union’s failure in the ideological arena during the Cold War, we should by no means ignore any ideology-based public opinion toward China from the West.

Second, to make rational responses to the Western ideology-based criticisms, we should draw lessons from the history of the world economy, such as the lessons of the Soviet Union, as well as our practices, such as the rhetorical battle with the West in the past few years. Coming up with an externally-facing public opinion based on a different ideology is not the most effective in addressing public opinion attacks based on an ideology. Empirically, tit-for-tat is ineffective and can worsen the situation. Again, the failure of the Soviet Union is a prime example, as its battle with a Western ideology failed. When faced with China-demonizing based on ideology from the West, we need to do the simplest thing, namely resorting to facts, science, and reason.

Third, and most importantly, China needs to prioritize its sustainable development, which ultimately benefits the country itself. It is important to recognize that the foundation of the government’s governance lies in its citizens, not Western praise. The support from its people is crucial for both the nation’s longevity and stability., China’s sustainable development also benefits the world economy by boosting its growth. As mentioned above, China has been the largest contributor to the growth of the world economy since it joined the WTO.

It is crucial to prioritize the building of a knowledge system based on China’s practical experiences. Regarding global soft power, we need a knowledge system based on our experiences rather than a certain ideology. While there has been a proposal for an autonomous knowledge system, continuous effort is still required.

Fourth, given the substantial externalities of our economy, we must further communicate and coordinate with other countries on economic policies, regardless of their respective sizes. Our duty is to fulfill the responsibility as a major player in the international community, which also benefits China.

After the 1997-1998 Asian financial crisis, China promised not to devalue its currency, and that commitment became an international public good in Asia. Similarly, after the global financial crisis from 2007 to 2008, China made similar contributions. As China re-opens its economy after the pandemic, it is important not only to take note of the hypocritical comments from certain quarters in the Western world but also to recognize the positive evaluations and high expectations from many international organizations.

Fifth, we must be open, open, and more open. Despite China’s efforts, there remains a persistent ideological camp in the West that views China through an ideological lens, a situation made worse by the past three years of the pandemic. The pandemic was so severe that it hindered travel across borders; as a result, some Western media and scholars tend to assess China through ideology since they couldn’t come here to see the facts with their own eyes.

The assessment of China through a uniform ideological lens appears to have strengthened the original Western ideological camp. However, the United States and the West have more than one ideology, and not all people believe in the prevailing ideology in the public opinion sphere. China’s openness provides a “seeing is believing” opportunity for different groups in the West. China should increase its openness to Western groups, including businesses, investors, media, universities, and research institutions. The changes in their understanding could render those ideological-based public opinions less effective.

FRBSF Economic Letter: Can Monetary Policy Tame Rent Inflation?

[from the Federal Reserve Bank of San Francisco Economic Letter]

by Zheng Liu and Mollie Pepper

Rent inflation has surged since early 2021. Because the cost of housing is an important component of total U.S. consumer spending, high rent inflation has contributed to elevated levels of overall inflation. Evidence suggests that, as monetary policy tightening cools housing markets, it can also reduce rent inflation, although this tends to adjust relatively slowly. A policy tightening equivalent to a 1 percentage point increase in the federal funds rate could reduce rent inflation as much as 3.2 percentage points over 2½ years.

“We’ve had a time of red-hot housing market all over the country… Shelter inflation is going to remain high for some time. We’re looking for it to come down, but it’s not exactly clear when that will happen. Hope for the best, plan for the worst.”

Federal Reserve Chair Jerome Powell (2022)

The rapid run-up of shelter costs—both house prices and rents—during the recovery from the pandemic has raised questions about how inflation pressures might affect housing affordability. Since March 2022, the Federal Reserve has rapidly lifted its federal funds rate target from near zero to over 4%, and policymakers have signaled that they are open to keeping the monetary policy stance sufficiently restrictive to return inflation to the longer-run goal of 2% on average. The tightened financial conditions following those policy changes, especially the surge in mortgage interest rates, have helped cool house price growth. However, rent inflation remains elevated.

This Economic Letter examines the effectiveness of monetary policy tightening for reducing rent inflation. We estimate that, during the period from 1988 to 2019, a policy tightening equivalent to a 1 percentage point increase in the federal funds rate can reduce rent inflation—measured by 12-month percentage changes in the personal consumption expenditures (PCE) housing price index—by about 3.2 percentage points, but the full impact takes about 2½ years to materialize. Based on housing costs’ share in total PCE, this translates to a reduction in headline PCE inflation of about 0.5 percentage point over the same time horizon.

Rising housing costs

Following the COVID-19 recession, house prices and rents both surged in the United States. For example, the 12-month growth rate of Standard & Poor’s CoreLogic Case-Shiller Home Price Index accelerated from about 10% in December 2020 to over 20% in March 2022. After the Federal Reserve started raising the target for the federal funds rate in March, house price growth has slowed significantly, to about 9% in October 2022.

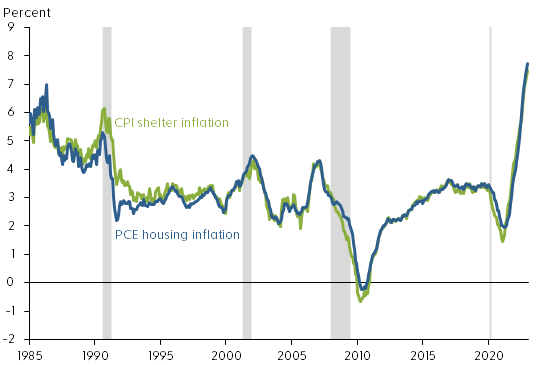
Rent inflation also accelerated during the pandemic period. Figure 1 shows that rent inflation—measured using 12-month changes in the PCE housing price index and including rents for tenant-occupied housing and imputed rents for owner-occupied housing—rose from a low point of about 2% in early 2021 to 7.7% by December 2022, the highest level since 1986. During the same period, rent inflation measured by 12-month changes in the shelter component of the consumer price index (CPI) experienced a similar increase. Thus, following the tightening of monetary policy, house price growth has slowed but rent inflation continues to rise.

Figure 1: PCE and CPI measures of rent inflation
Source: Bureau of Economic Analysis, Bureau of Labor Statistics, and Haver Analytics.
Note: Twelve-month percentage changes. Gray shading indicates NBER recession dates.

Economic theory suggests that some common forces such as changes in housing demand can drive both rents and house prices. For example, the expansion of remote work since the COVID-19 pandemic has increased demand for housing, raising both house prices and rents (Kmetz, Mondragon, and Wieland 2022). To the extent that the stream of current and future rents reflects the fundamental value of a house, house prices can be a leading indicator of future rent inflation (Lansing, Oliveira, and Shapiro 2022). Thus, monetary policy can affect both house prices and rents by cooling housing demand.

Housing demand responds to changes in financial conditions, such as increases in mortgage interest rates. However, theory suggests that house prices are more sensitive than rental prices to changes in financial conditions, because home purchases typically require longer-term mortgage financing. In addition, unlike rents, house prices can be partly driven by investor sentiments or beliefs, which explains the observed larger swings in house prices than in rents over business cycles (Dong et al. 2022). Long-term rental contracts can also contribute to slow adjustments in rent inflation.

Rent inflation is an important contributor to overall inflation because housing costs are an important component of total consumption expenditures. On average, housing expenditures represent about 15% of total PCE and 25% of the services component of PCE. In CPI, shelter costs represent an even larger share, accounting for about 30% of total consumption of all urban consumers and about 40% of core consumption expenditures excluding volatile food and energy components.

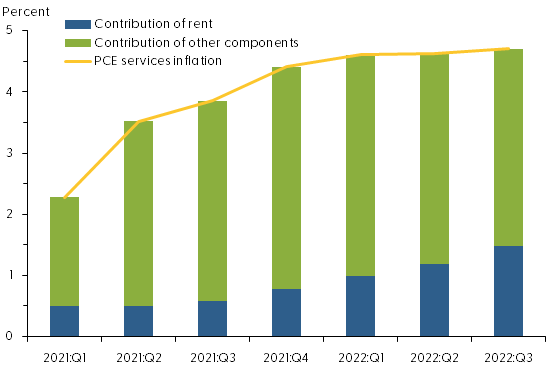
The contribution of rent inflation to overall PCE inflation has increased since early 2021. As Figure 2 shows, in the first quarter of 2021, rent inflation accounted for about 22% of the four-quarter change in the PCE services price index, excluding energy: 0.5 of the 2.3 percentage points increase in service prices was attributable to rent inflation. By the third quarter of 2022, the contribution of rent inflation had climbed to about one-third, or 1.5 of the 4.7 percentage point increase in service prices.

Figure 2: Rising contribution of rent inflation to services inflation
Source: Bureau of Economic Analysis, Haver Analytics, and authors’ calculations.
Note: Four-quarter changes in PCE services price index excluding energy.

Measuring policy effects

Given the rising contribution of rent inflation to overall inflation, it is important to assess the quantitative effects of monetary policy tightening on rent inflation.

For our analysis, we use a measure of monetary policy surprises constructed by Bauer and Swanson (2022). Their measure focuses on high-frequency changes in financial market indicators within a short period surrounding the Federal Open Market Committee (FOMC) policy announcements. If the public fully anticipates a policy change, then the financial market would not react to new policy announcements. However, if the market does react to an announcement, then the policy change must contain a surprise element. Thus, changes in financial market indicators, such as the price of Eurodollar futures, in a narrow window around an FOMC announcement can capture policy surprises. In practice, however, the data constructed this way are not complete surprises because they can be predicted by some macro and financial variables shortly before FOMC announcements. We follow the approach of Bauer and Swanson (2022) to purge the influences of those macro and financial variables from the measure of policy surprises. We use the resulting quarterly time series to measure monetary policy shocks, with a sample period from 1988 to 2019.

We then use a local projections model—a statistical tool proposed by Jordà (2005)—to project how rent inflation responds over time to a tightening of monetary policy equivalent to a 1 percentage point unanticipated increase in the federal funds rate in a given quarter. The model takes into account how monetary policy shocks interact with other macroeconomic variables, including lags of rent inflation, real GDP growth, and core PCE inflation.

In the final step, we compute the responses of rent inflation relative to its preshock level over a period up to 20 quarters after the initial increase in the federal funds rate.

Gradual impact of policy tightening on rent inflation

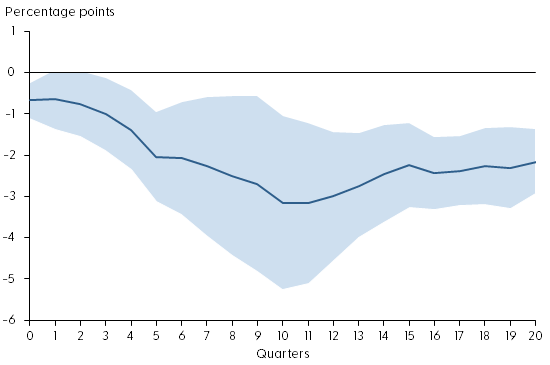
Figure 3 shows the response of rent inflation during the first 20 quarters after an unanticipated tightening of monetary policy (solid blue line). The shaded area shows the confidence band, indicating the statistical uncertainty in estimating the responses. Under the assumption that the model is correct, the shaded area contains the actual value of the rent inflation responses to the monetary policy shock roughly two-thirds of the time. The policy shock is normalized such that it is equivalent to a 1 percentage point unanticipated increase in the federal funds rate.

Figure 3: Response of rent inflation to monetary policy tightening
Source: Bureau of Economic Analysis, Bauer and Swanson (2022), and authors’ calculations.
Note: Response of rent inflation to a monetary policy shock equivalent to a 1 percentage point surprise increase in the federal funds rate. Shaded region shows 68% confidence band around the estimate.

The figure shows that monetary policy tightening has significant and gradual effects on rent inflation. On impact, a 1 percentage point increase in the federal funds rate reduces rent inflation about 0.6 percentage point relative to its preshock level. Over time, rent inflation declines gradually, falling about 3.2 percentage points in the 10 quarters following the impact. The slow adjustment in rent inflation partly reflects the stickiness in nominal rents due to long-term rental contracts. Since housing expenditures account for about 15% of total PCE, this estimate translates to a reduction in headline PCE inflation of about 0.5 percentage point, stemming from the decline in rent inflation over a period of 2½ years.

The rent component of PCE is measured based on average rents, including those locked in long-term rental contracts, which are slow to adjust to changes in economic and financial conditions. Rents on new leases, however, are more flexible. For example, the 12-month growth in Zillow’s observed rent index, which measures changes in asking rents on new leases, has slowed significantly since March 2022 (see Figure 4). Asking rents are typically a leading indicator of future average rents. Thus, the slowdown in asking rent growth could portend lower future rent inflation.

Figure 4: Year-over-year observed rent growth starting to slow
Source: Zillow and Haver Analytics.
Note: Twelve-month percentage changes in Zillow’s observed rent index. Gray shading indicates NBER recession dates.

Conclusion

Rents are an important component of consumer expenditures. Recent surges in rent inflation have led to concerns that overall inflation might stay persistently high despite tightening of monetary policy. We present evidence that monetary policy tightening is effective for reducing rent inflation, although the full impact takes time to materialize. A policy tightening equivalent to a 1 percentage point increase in the federal funds rate can reduce rent inflation up to 3.2 percentage points over the course of 2½ years. This translates to a maximum reduction in headline PCE inflation of about 0.5 percentage point over the same time horizon. Although average rents are slow to respond to policy changes, growth of asking rents on new leases has started to slow following recent monetary policy tightening. Our finding suggests that this tightening will gradually bring rent inflation down over time, thereby helping to reduce overall inflation.

Zheng Liu — Vice President and Director of the Center for Pacific Basin Studies, Economic Research Department, Federal Reserve Bank of San Francisco

Mollie Pepper — Research Associate, Economic Research Department, Federal Reserve Bank of San Francisco

[Archived PDF]

Economics-Watching: FedViews for January 2023

[from the Federal Reserve Bank of San Francisco]

Adam Shapiro, vice president at the Federal Reserve Bank of San Francisco, stated his views on the current economy and the outlook as of January 12, 2023.

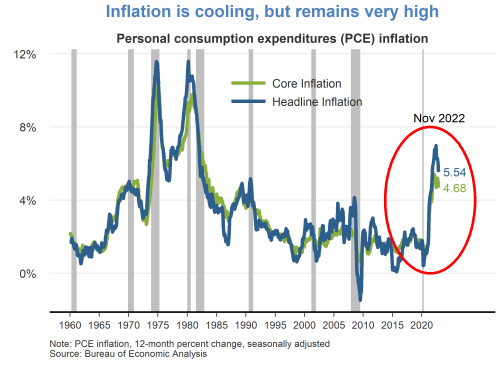
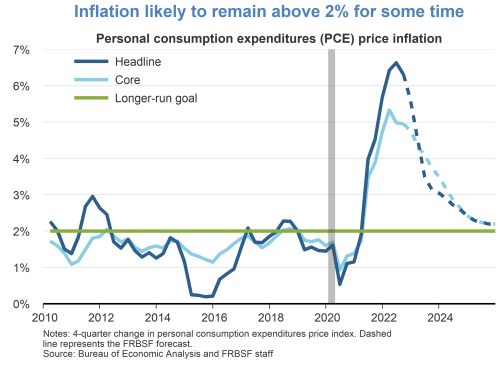
  • While continuing to cool over the last several months, 12-month inflation remains at historically high levels. The headline personal consumption expenditures (PCE) price index rose 5.5% in November 2022 from a year earlier. This marks a decline in inflation to a level last observed in October 2021, but still well above the Fed’s longer-run goal of 2%. A portion of the inflation moderation is attributable to recent declines in energy prices. Core PCE inflation, which removes food and energy prices, has shown less easing.
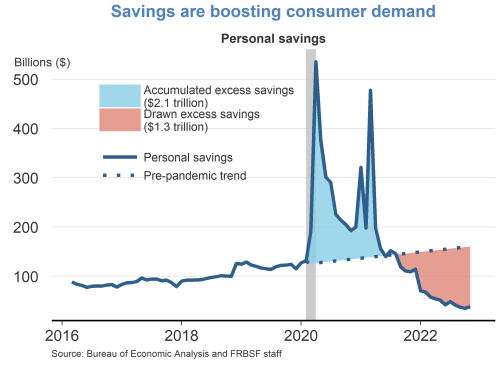
  • Owing to fiscal relief efforts and lower household spending over the course of the pandemic, consumers accumulated over $2 trillion dollars in excess savings, based on pre-pandemic trends. Since then, consumers have drawn down over half of this excess savings which has helped support recent growth in personal consumption expenditures. A considerable amount of accumulated savings remains for some consumers to support spending in 2023.
  • In the wake of the pandemic, consumer spending patterns shifted away from services towards goods. While there appears to be some normalization of spending behavior, this shift has generally persisted. Real goods spending remains significantly above its pre-pandemic trend, driven by strong demand for durables such as furniture, electronics, and recreational goods. Spending on services has shown a resurgence but remains below its pre-pandemic trend.
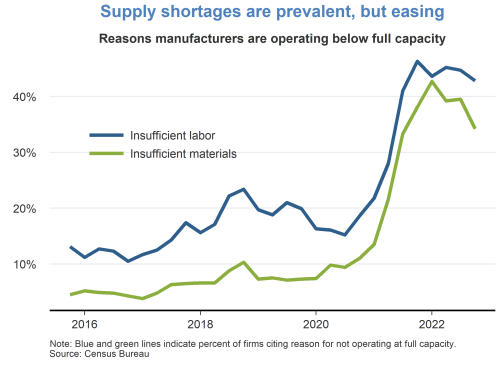
  • Supply chain bottlenecks for materials and labor remain a constraint on production, although there are some recent signs of easing. The fraction of manufacturers who reported operating below capacity due to insufficient materials peaked in late 2021 and has moderately declined over the past year. However, the fraction of manufacturers reporting insufficient labor has persisted at high levels.
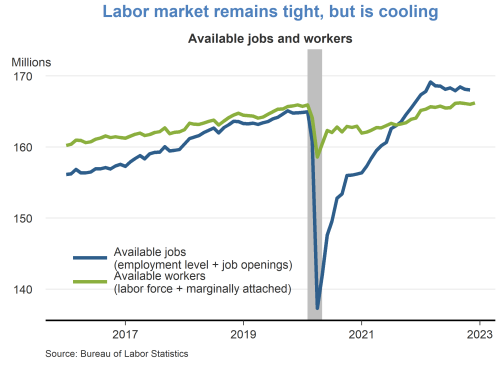
  • The labor market remains tight, despite some signs of cooling. The number of available jobs remains well above the number of available workers, although vacancy postings have been trending down in recent months. The tight labor market has put continued upward pressure on wages and labor market turnover.
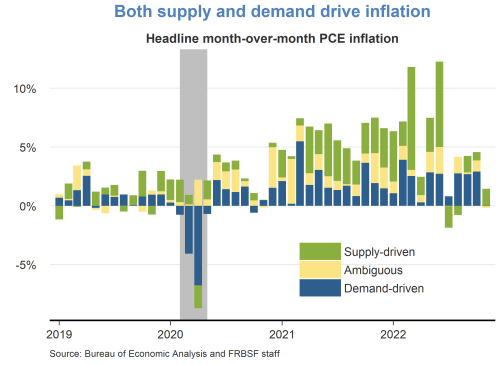
  • A decomposition of headline PCE inflation into supply– and demand-driven components shows that both supply and demand factors are responsible for the recent rise in inflation. The surge in inflation in early 2021 was mainly due to an increase in demand-driven factors. Subsequently, supply factors became more prevalent for the remainder of 2021. Supply-driven inflation has moderated significantly over recent months, while demand-driven inflation remains elevated.
  • The Federal Open Market Committee (FOMC) raised the federal funds rate by 50 basis points at the December meeting to a range of 4.25 to 4.5%. This cycle of continued rate increases since March of last year represents the fastest pace of monetary policy tightening in 40 years. The increase in the federal funds rate has been accompanied by a gradual reduction in the size of the Federal Reserve’s balance sheet.
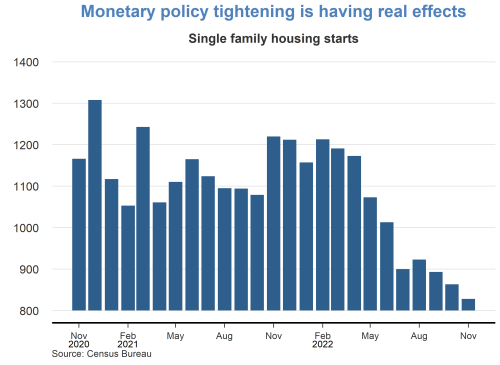
  • Economic activity in sectors such as housing, which is sensitive to rising interest rates, has slowed considerably in recent months. Housing starts have fallen steadily over the past year, as have other housing market indicators, such as existing home sales and house prices.
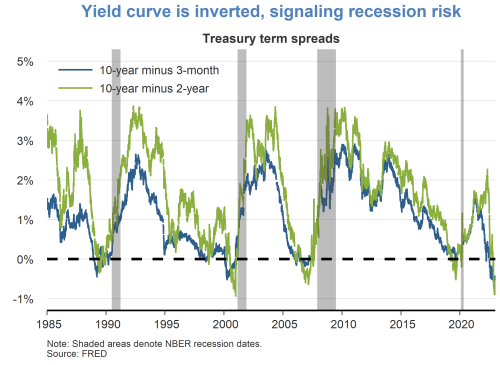
  • Although the labor market is currently very strong, financial markets are pointing to some downside risks. Namely, the difference between longer- and shorter-term interest rates has turned negative, which historically tends to occur immediately preceding recessions. It remains unclear whether lower longer-term yields are indicative of anticipated slower growth or lower inflation.
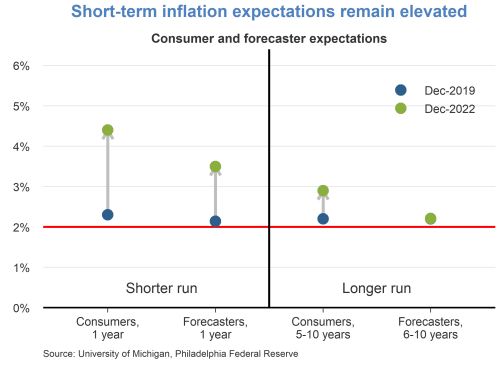
  • Short-term inflation expectations remain elevated relative to their pre-pandemic levels in December 2019. Consumers are expecting prices to rise 5% this year, while professional forecasters are expecting prices to rise 3.5%. Longer-term inflation expectations remain more subdued, indicating that both consumers and professionals believe inflation pressures will eventually dissipate.
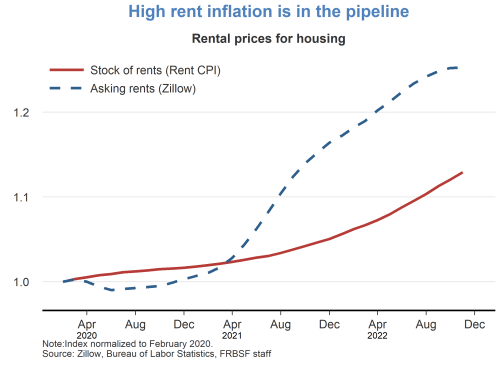
  • Rent inflation is expected to remain high over the next year. The prices for asking rents have grown quite substantially over the last two years. As new leases begin and existing leases are renewed, these higher asking rents will flow into the stock of rental units, putting upward pressure on rent inflation.
  • We are expecting inflation to moderate over the next few years as monetary policy continues to restrain demand and supply bottlenecks continue to ease. We anticipate that it will take some time for inflation to reach the Fed’s longer-run goal of 2%.
Inflation is cooling, but remains very high
Savings are boosting consumer demand
Goods consumption remains elevated
Supply shortages are prevalent, but easing
Labor market remains tight, but is cooling
Both supply and demand drive inflation
Monetary policy tightening is having real effects
Yield curve is inverted, signaling recession risk
Short-term inflation expectations remain elevated
High rent inflation is in the pipeline
Inflation likely to remain above 2% for some time

[Archived PDF]

Read other issues from FedViews.

From ASEAN and G20 to APEC, as World Leaders Meet in Person Again, 3 Reasons to Root for Multilateralism

By Wang Huiyao | Founder of the Center for China and Globalization (CCG)

Over the past two weeks, Asia has played host to the most intense sequence of multilateral summits since the pandemic began, as national leaders gathered for meetings organized by ASEAN, the G20 and APEC. Although overshadowed by geopolitical tensions, the meetings marked a welcome return to in-person summit diplomacy, and the better-than-expected outcomes show hope yet for multilateralism.

The conclaves began in Phnom Penh with the annual summit of the Association of Southeast Asian Nations. At the first of such in-person events in almost three years, ASEAN leaders took the positive step of agreeing in principle to admit East Timor as the 11th member of the organization.

As leaders moved on to Bali for the Group of 20 summit, expectations were low after ministerial meetings in the run-up had failed to produce consensus. Earlier in the year, given fractures in the wake of Russia’s invasion of Ukraine, there was a question mark over whether the G20 could even go ahead or survive in its existing form.

In the end, the summit surpassed expectations by producing a joint declaration after intense negotiations, with leaders finding the compromises necessary to unite in declaring that “today’s era must not be of war” and pledging to uphold the multilateral system.

The summit also saw a positive face-to-face meeting between China’s President Xi Jinping and U.S. President Joe Biden, their first as leaders, signaling a willingness to halt the downward trajectory of China-U.S. relations.

In Bangkok, the 21 leaders of the Asia-Pacific Economic Cooperation forum also pledged to uphold and strengthen the rules-based multilateral trading system. Importantly, the group agreed on a multi-year work plan for an Asia-Pacific free trade area.

Reflecting on these three summits, three takeaways give reason for cautious optimism that multilateralism can yet be revived and play a major role in solving our challenges.

First, and perhaps most obviously, the return of in-person summit diplomacy is a welcome uplift for global cooperation. Virtual formats played a useful interim role at the height of the pandemic but were never a substitute for getting leaders in the same room. That is especially when it comes to interactions on the sidelines, often as important as the main event.

China’s return to diplomacy at the highest level was a further boost, both for the nation and the rest of the world.

In addition to Xi’s highly anticipated meeting with Biden, the Chinese leader met over a dozen other leaders at the G20 and APEC summits, including a warmer-than-expected first meeting with Japanese Prime Minister Fumio Kishida and his first meeting with an Australian prime minister since 2016.

Leaders got to meet their new counterparts for the first time or build on existing relationships, which can only help global cooperation.

The second takeaway is that as grave as our challenges are, the threat of escalating conflict and severe economic pressures on all nations seem to be focusing minds and increasing the willingness to engage and cooperate—out of necessity if nothing else.

The G20 summit was the second major one this year to surpass expectations after the 12th World Trade Organization Ministerial Conference in June surprised observers by agreeing on a plan to reform the organization and its dispute settlement mechanism. The G20 statement reiterated support for this WTO reform plan, which will be critical to get the free trade agenda back on track and provide a much-needed boost for the global economy.

Third, and perhaps most significantly for the long term, the recent summits marked an acceleration of the trend towards multi-polarization in international diplomacy, and in particular, the rising influence of non-aligned “middle powers” to shape multilateral outcomes.

The middle powers represented at ASEAN, the G20 and APEC have huge stakes in avoiding a bifurcation of the global economy that might result from a new cold war. They don’t want to be forced to pick sides and many show a growing willingness and ability to build bridges and restore positive momentum for multilateralism.

Indonesia is a prime example. The country’s strategic heft and non-aligned credibility make it well-placed to bridge different camps. President Joko Widodo made a big political bet on the success of the G20 and has won praise for the deft diplomacy that kept the organization alive and got it to a joint statement.

The Indian delegation reportedly also played a big role in achieving consensus on language in the statement, with the BRICS group (Brazil, Russia, India, China and South Africa)—as well as Indonesia—turning out to be crucial swing voters in securing the joint statement. One Indian official said it was “the first [G20] summit where developing nations shaped the outcome.”

There is scope for this trend to continue next year as middle powers continue to rise in stature, and India and Indonesia take over the presidency of the G20 and ASEAN, respectively. Brazil will host the G20 the year after.

Over in Sharm el-Sheikh at the COP27 UN climate summit, another middle power—the host Egypt—also won praise for helping to shepherd a historic financing deal for poor countries affected by climate change. But the ultimate failure to reach a commitment to phase down fossil fuels was a sobering reminder of the huge difficulties that remain in forging the global consensus needed to overcome our shared challenges.

The Early Universe and the Future of Humanity/Xi Risks Losing the Middle Class

[from The Institute of Art and Ideas]

The Life and Philosophy of Martin Rees

An Interview with Martin Rees

Astronomer Royal and best-selling science author, Martin Rees pioneering early work led to evidence to contradict the Steady State theory of the universe and confirm the Big Bang. His influence then spread to the wider public—knighted in 1992, elevated to Baron in 2005, then giving the Reith Lectures in 2010. Most recently his attention has turned from the early universe to the future of humanity. In this interview, Lord Rees discusses the ideas and experiences which led to such an illustrious career.

Xi Risks Losing the Middle Class

The zero-COVID strategy has run its course

Kerry Brown | Professor of Chinese Studies and Director of Lau China Institute, King’s College London. He is the co-editor of the Journal of Current Chinese Affairs, and author of Xi: A Study in Power.

China is continuing with its tough zero-COVID policy. But the cracks in the economy and a discontent middle class mean that Xi’s Imperial-like governing style is under challenge, writes Kerry Brown.

China’s zero-COVID strategy operates in Chinese domestic politics a bit like Brexit does in the UK. Despite complaints from business networks and broader society about the negative impact on economic growth and citizens’ freedoms, it’s a policy commitment the government is sticking to no matter what.

Of course, no one voted for the draconian lockdowns implemented across China. And, unlike Brexit, the lockdowns are very much in line with expert advice in the country, rather than running against it. The Chinese Centre for Disease Control and Prevention (CCDC), the main governmental body advising the government over crisis response in this area, said in a weekly update last November that without comprehensive restraints on people’s movement and quarantines on anyone testing positive for the virus, the national health system would soon be overwhelmed with cases, and find itself in the same bind as those in the US or Europe did.

That the words of the experts have been taken so much in earnest is striking for a regime that previously hasn’t been shy to dismiss them. The Xi leadership may be confident in the way it speaks to the outside world, but it seems that it has the same profound wariness in the robustness of the country’s public health as everywhere else. Things have not been helped by clinical trials showing the Chinese vaccines – the only ones accepted in China – are not as effective as foreign ones where the length of protection is in question). On top of this, vaccine take-up by the elderly, the most vulnerable group, has been poor. It is easy to see therefore why the central government might be very cautious. What is harder to understand, however, is why the cautiousness has bordered on obsessiveness.

The Xi way of governing is increasingly almost imperial in style, with broad, high-level policy announcements made in Beijing, sometimes of almost Delphic succinctness.

One scenario is simply about the structures of decision-making in China. This was an issue right from the moment the variant started to appear in late 2019, and local officials in Wuhan stood accused of trying to hush the issue up, delaying reporting to the central authorities till things had already gone on too long. As a result of this, in February 2020 key officials in the city were sacked. But this is unlikely to change the fact that provincial officials are very risk averse under Xi, and that any central direction to manage the pandemic will be interpreted in the purest terms and executed to the letter.

This explains the completeness of the Xian government’s virtual incarceration of its 8 million population after just a few COVID cases at the end of 2021, the first of the more recent lockdowns. It also explains why the traditionally more free-thinking municipal authority of Shanghai and its similarly liberal approach was fiercely knocked back by Beijing last February, to make an example for any other provinces thinking of going their own way. The absolute prohibition on people moving from their homes there, in one of the most dynamic and lively cities of modern China, was perfect proof that if the government could bring about this situation there, it could do it anywhere.

This case study also reveals some important things about the Xi way of governing. It is increasingly almost imperial in style, with broad, high-level policy announcements made in Beijing, sometimes of almost Delphic succinctness, which are then handed down to various levels of government to do as they will. Exactly how and when the discussion amongst Xi and his Politburo colleagues on the best response to COVID happened is unclear. In a world where almost every political system seems to leak incessantly, the Chinese one is unique in maintaining its opacity and secretiveness – no mean achievement in the social media era.

The Communist Party is very aware of how relatively small incidents can mount up and then generate overwhelming force. It itself coined the Chinese phrase ‘a single spark can start a prairie fire.’

Rumors of clashes between Xi and his premier Li Keqiang on the effectiveness of the current response remain just that – rumors, with precious little hard evidence to back them up. Who in the current imperial system might dare to speak from the ranks and say that policy must change is unclear. Scientists should deal in hard facts – but we all know that science is susceptible to politicization. Experts in China have to offer their expertise in a highly political context. A declaration that the current approach is not fit for purpose can easily be reinterpreted as an attempt to launch an indirect attack on the core leader. With an important Congress coming up later this year, at which Xi is expected to be appointed for another five years in power, sensitivities are even more intense than normal. It is little wonder that the COVID strategy status quo settled on last year has not shifted.

Things, however, may well change, and change quickly. China is moving into tricky economic territory. The impact of the pandemic on global supply chains, along with the various stresses domestically on the housing market, and productivity, have shrunk expectations for growth. A predicted 6% in the earlier part of the year now looks overly ambitious. There is a real possibility China might experience a recession. At a moment like this, the government, which after all operates as a constant crisis and risk management entity, might do what it does best and prompt rapid, and dramatic, changes.

The handling of COVID-19 might look like further proof that Chinese politics under Xi is repressive and zero-sum. But even in an autocratic state like the current People’s Republic, the pandemic will not leave politics unchanged.

This doesn’t mean that China’s COVID-19 bind gets any easier. Like the country’s serious demographic challenges, with a rapidly aging population, the only thing the government will be picking an argument with is reality as it proceeds into the future. As with Europe and the US, being more liberal about facing COVID-19 will involve accepting some of the harsh consequences – rising fatalities, particularly for the elderly and vulnerable, and health systems put under enormous stress. In such a huge, complex country, and of enormous geopolitically importance, a misstep could easily lead to huge and unwanted consequences, generating discontent and triggering mass protests in a way reminiscent of 1989. The Communist Party is very aware of how relatively small incidents can mount up and then generate overwhelming force. It itself coined the Chinese phrase ‘a single spark can start a prairie fire.’ One such spark – the introduction of Marxism into China in the 1910s – led to its gaining of power three decades later.

The handling of COVID-19 might look like further proof that Chinese politics under Xi is repressive and zero-sum. But I suspect that even in an autocratic state like the current People’s Republic, the pandemic will not leave politics unchanged. In particular, the middle classes in cities like Shanghai have had their patience tested in recent months. This is the key group for Xi, the heart of his new innovative, more self-dependent, higher-quality service sector workers in an urbanized economy. Their support remains crucial if Xi is able to steer China towards the moment when it hopes it will become the world’s largest economy. Policies to try to placate them by addressing imbalances, critical environmental issues and improving public health are likely to only increase. Delivery however will be key.

Faced with a potentially life-threatening infectious disease, the Party can throw out injunctions and claim it has been the victim of bad luck. But an ailing economy and no clear signs of the government knowing how to manage this will prove a toxic mixture for it. Xi and his third term in office will be all about delivery. The question is whether, even with the formidable suite of powers he has, he can do this. Governing China has always been the ultimate political challenge. COVID-19 has made that even harder.

“2022 Monkeypox Outbreak: Situational Awareness” with Syra Madad [Zoom]

[from Harvard Kennedy School’s Belfer Center, part of Harvard University]

Thursday, July 21, 2:30-4:00 PM EDT

RSVP (Required)

The 2022 Monkeypox outbreak continues to expand with case counts mounting in many countries. This seminar will cover where we are in the global fight against monkeypox, where we may be headed as a nation, and what we need to do right now to mitigate the growing threat of monkeypox. Join Belfer Fellow Dr. Syra Madad in conversation with Kai Kupferschmidt, Dr. Krutika Kuppalli, Dr. Anne Rimoin, Dr. Boghuma Kabisen Titanji, and Dr. Jay K. Varma.

About the Speakers

Dr. Anne Rimoin is a Professor of Epidemiology at the UCLA Fielding School of Public Health. She is the Gordon-Levin Endowed Chair in Infectious Diseases and Public Health. Dr. Rimoin is the director of the Center for Global and Immigrant Health and is an internationally recognized expert on emerging infections, global health, surveillance systems, and vaccination.

Rimoin has been working in the DRC since 2002, where she founded the UCLA-DRC Health Research and Training Program to train U.S. and Congolese epidemiologists to conduct high-impact infectious disease research in low-resource, logistically-complex settings.

Dr. Rimoin’s research focuses on emerging and vaccine-preventable diseases. It has led to fundamental understandings of the epidemiology of human monkeypox in post-eradication of smallpox, long-term immunity to Ebola virus in survivors and durability of immune response to Ebola virus vaccine in health workers in DRC. Her current research portfolio includes studies of COVID-19, Ebola, Marburg, Monkeypox and vaccine-preventable diseases of childhood.

Boghuma Kabisen Titanji (MD, MSc., DTM&H, PhD) is a Cameroonian born physician-scientist and Assistant Professor of Medicine at Emory University in Atlanta. She obtained her MD from the University of Yaoundé I in Cameroon and worked for two years after graduation as a medical officer, before pursuing post-graduate research training in London, United Kingdom. As an awardee of the prestigious Commonwealth Scholarship program, she obtained a Masters Degree in Tropical Medicine and International Health from the London School of Hygiene and Tropical Medicine, a diploma in Tropical Medicine and Hygiene from the Royal College of Physicians and a Ph.D. in Virology from University College London. Dr. Titanji joined Emory University School of Medicine in 2016 where she completed a residency in Internal Medicine, on the ABIM research pathway and a fellowship Infectious Diseases. She has three parallel career interests: translational and clinical research in HIV and emerging virus infections, science communication, and global health. Her clinical focus is general infectious diseases and people with HIV. Her current research focuses on chronic inflammation as a mediator of cardiovascular disease in people with HIV. She is passionate about leveraging translational research to improve the care of people with HIV, global health equity and using science to influence health policy through science communication and advocacy.

Jay K. Varma, MD is a Professor of Population Health Sciences and Director of the Cornell Center for Pandemic Prevention and Response at Weill Cornell Medicine. Dr. Varma is an expert on the prevention and control of diseases, having led epidemic responses, developed global and national policies, and led large-scale programs that have saved hundreds of thousands of lives in China, Southeast Asia, Africa, and the United States. After graduating magna cum laude with highest honors from Harvard, Dr. Varma completed medical school, internal medicine residency, and chief residency at the University of California, San Diego School of Medicine. From 2001-2021, he worked for the U.S. Centers for Disease Control and Prevention with postings in Atlanta, Thailand, China, Ethiopia, and New York City. From April 2020 – May 2021, he served as the principal scientific spokesperson and lead for New York City’s COVID-19 response. Dr. Varma has authored 143 scientific manuscripts, 13 essays, and one book.

Kai Kupferschmidt is a science journalist based in Berlin, Germany. He is a contributing correspondent for Science where he often covers infectious diseases. Kai received a diploma in molecular biomedicine from the University of Bonn, Germany and later visited the Berlin Journalism School. He has won several awards for his work, including the Journalism Prize of the German AIDS Foundation. Together with two colleagues he runs a podcast on global health called Pandemia [German]. He has also written two books, one about infectious diseases and one about the science of the color blue.

Krutika Kuppalli, MD, FIDSA is a Medical Officer for Emerging Zoonotic Diseases and Clinical Management in the Health Emergencies Program at the World Health Organization where she currently supports activities for the Monkeypox outbreak and COVID-19 pandemic. She completed her Internal Medicine residency and Infectious Diseases fellowship at Emory University, a Post-Doctoral Fellowship in Global Public Health at the University of California, San Diego and the Emerging Leader in Biosecurity Fellowship at the Johns Hopkins Center for Health Security. Dr. Kuppalli currently serves on the American Society of Tropical Medicine and Hygiene (ASTMH) Trainee Committee and is the Chair of the Infectious Diseases Society of America (IDSA) Global Health Committee.

Dr. Kuppalli was previously awarded the NIH Fogarty International Clinical Research Fellowship and conducted research in Southern India to understand barriers to care and how emerging infections impacted persons living with HIV/AIDS. She was the medical director of a large Ebola Treatment Unit in Sierra Leone during the 2014 West Africa Ebola outbreak, helped lead the development and implementation of pandemic response preparedness activities in resource limited settings, and has consulted on the development of therapeutics for emerging pathogens. Her clinical and research interests focus on health systems strengthening in resource limited settings, research and clinical care for emerging infections, outbreak preparedness and response, and policy. She has worked in numerous countries including Ethiopia, India, Sierra Leone, Uganda, and Haiti.

During the COVID-19 pandemic Dr. Kuppalli served as a consultant for the San Francisco Department of Health and helped develop and operationalize a field hospital. She served as an expert witness to the U.S. Congress, Financial Services Committee Task Force on Artificial Intelligence (AI) about how digital technologies may be leveraged for exposure notification and contact tracing to improve the pandemic response. She also collaborated with the Brennan Center for Justice to develop guidelines to inform “Healthy in-person Voting” in advance of the 2020 U.S. election and testified before the U.S. House Select Subcommittee regarding these recommendations. Prior to her position at WHO, she was the medical lead for COVID-19 vaccine rollout at the Medical University of South Carolina (MUSC) and helped coordinate vaccine education events for the staff and community and oversaw the reporting of adverse vaccine events.

Since joining WHO in August 2021, Dr. Kuppalli has been part of the WHO headquarters incident management team (IMST) for COVID-19, the clinical characterization and management working group for COVID-19, the COVID-19 therapeutics steering committee, and is the technical focal point for the post COVID-19 condition (Long COVID) steering committee. She is a member of the secretariat on the scientific advisory group on the origins of emerging and re-emerging infectious diseases (SAGO) which was convened by the Director General to understand and investigate the origins of SARS-CoV-2 and other novel pathogens. More recently since the development of the multi-country monkeypox outbreak she has been part of the IMST at WHO as one of the clinical management focal points. In this capacity she was part of the WHO core group that helped write the recently published Clinical Management and Infection Prevention and Control guidelines for Monkeypox and advising on the clinical endpoints for the global CORE therapeutics protocol.

Dr. Kuppalli is recognized as a scientific expert in global health, biosecurity and outbreak response. She was recognized by NPR Source of The Week early in the pandemic as an expert to follow and named to Elemental’s 50 Experts to Trust in a Pandemic. She has been a frequent contributor to numerous domestic and international media outlets including The New York Times, NPR, Reuters, The Washington Post, Vox, Stat News, San Francisco Chronicle, Forbes, NBC Bay Area, BBC News.