Economics-Watching: How Green Innovation Can Stimulate Economies and Curb Emissions

[from IMF Blog, by Zeina Hasna, Florence Jaumotte & Samuel Pienknagura]

Coordinated climate policies can spur innovation in low-carbon technologies and help them spread to emerging markets and developing economies

Making low-carbon technologies cheaper and more widely available is crucial to reducing harmful emissions.

We have seen decades of progress in green innovation for mitigation and adaptation: from electric cars and clean hydrogen to renewable energy and battery storage.

More recently though, momentum in green innovation has slowed. And promising technologies aren’t spreading fast enough to lower-income countries, where they can be especially helpful to curbing emissions. Green innovation peaked at 10 percent of total patent filings in 2010 and has experienced a mild decline since. The slowdown reflects various factors, including hydraulic fracking that has lowered the price of oil and technological maturity in some initial technologies such as renewables, which slows the pace of innovation.

The slower momentum is concerning because, as we show in a new staff discussion note, green innovation is not only good for containing climate change, but for stimulating economic growth too. As the world confronts one of the weakest five-year growth outlooks in more than three decades, those dual benefits are particularly appealing. They ease concerns about the costs of pursuing more ambitious climate plans. And when countries act jointly on climate, we can speed up low-carbon innovation and its transfer to emerging markets and developing economies.

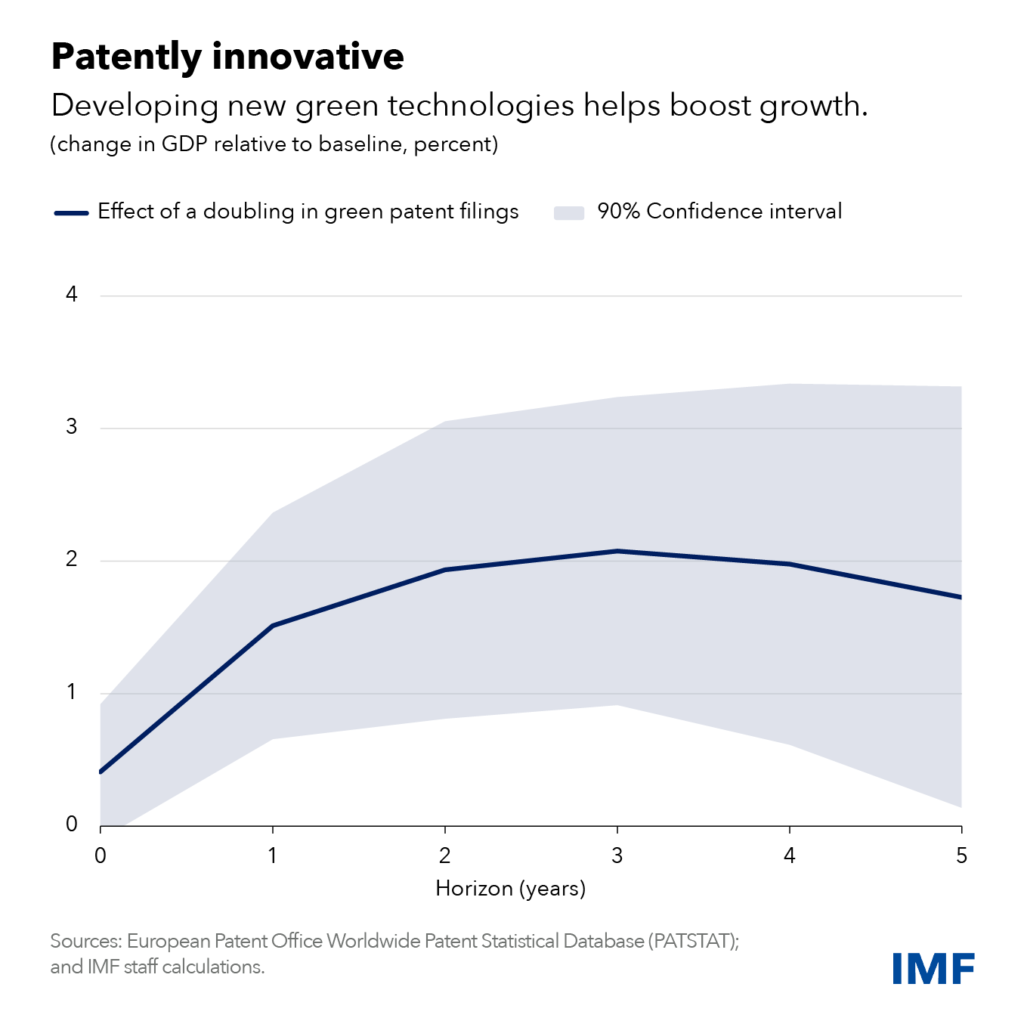
IMF research [archived PDF] shows that doubling green patent filings can boost gross domestic product by 1.7 percent after five years compared with a baseline scenario. And that’s under our most conservative estimate—other estimates show up to four times the effect.

The economic benefits of green innovation mostly flow through increased investment in the first few years. Over time, further growth benefits come from cheaper energy and production processes that are more energy efficient. Most importantly, they come from less global warming and less frequent (and less costly) climate disasters.

Green innovation is associated with more innovation overall, not just a substitution of green technologies for other kinds. This may be because green technologies often require complementary innovation. More innovation usually means more economic growth.

A key question is how countries can better foster green innovation and its deployment. We highlight how domestic and global climate policies spur green innovation. For example, a big increase in the number of climate policies tends to boost green patent filings, our preferred proxy for green innovation, by 10 percent within five years.

Some of the most effective policies to stimulate green innovation include emissions-trading schemes that cap emissions, feed-in-tariffs, which guarantee a minimum price for renewable energy producers, and government spending, such as subsidies for research and development. What’s more, global climate policies result in much larger increases in green innovation than domestic initiatives alone. International pacts like the Kyoto Protocol and the Paris Agreement amplify the impact of domestic policies on green innovation.

One reason policy synchronization has a prominent impact on domestic green innovation is what is called the market size effect. There’s more incentive to develop low-carbon technologies if innovators can expect to sell into a much larger potential market, that is, in countries which adopted similar climate policies.

Another is that climate policies in other countries generate green innovations and knowledge that can be used in the domestic economy. This is known as technology diffusion. Finally, synchronized policy action and international climate commitments create more certainty around domestic climate policies, as they boost people’s confidence in governments’ commitment to addressing climate change.

Climate policies even help spread the use of low-carbon technologies in countries that are not sources of innovation, through trade and foreign-direct investment. Countries that introduce climate policies see more imports of low-carbon technologies and higher green FDI inflows, especially in emerging markets and developing economies.

Risks of protectionism

Lowering tariffs on low-carbon technologies can further enhance trade and FDI in green technologies. This is especially important for middle- and low-income countries where such tariffs remain high. On the flipside, more protectionist measures would impede the broader spread of low-carbon technologies.

In addition, and given evidence of economies of scale, protectionism—with ultimately smaller potential markets—could stifle incentives for green innovation and lead to duplication of efforts across countries.

The risks of protectionism are exacerbated when climate policies, such as subsidies, do not abide by international rules. For example, local content requirements, whereby only locally produced green goods benefit from subsidies, undermine trust in multilateral trade rules and could result in retaliatory measures.

Beyond embracing a rules-based approach to climate policies, the advanced economies, where most green innovation occurs, have an important responsibility: sharing the technology so that emerging and developing economies can get there faster. Such direct technology transfers hold the promise of a double dividend for emerging markets and developing economies—reducing emissions and yielding economic benefits.

—This blog reflects research by Zeina Hasna, Florence Jaumotte, Jaden Kim, Samuel Pienknagura and Gregor Schwerhoff.

Economics-Watching: “Doing Nothing” Is Still Doing a Lot

[from the Federal Reserve Bank of Philadelphia, speech by Patrick T. Harker President and Chief Executive Officer at the National Association of Corporate Directors Webinar, Philadelphia, PA (Virtual)]

Good afternoon, everyone.

I appreciate that you’re all giving up part of the end of your workday for us to be together, if only virtually.

My thanks to my good friend, Rick Mroz, for that welcome and introduction.

I do believe we’re going to have a productive session. But just so you all know, as much as I enjoy speaking and providing my outlook, I enjoy a good conversation even more.

So, first, let’s take a few minutes so I can give you my perspective on where we are headed, and then I will be more than happy to take questions and hear what’s on your minds.

But before we get into any of that, I must begin with the standard Fed disclaimer: The views I express today are my own and do not necessarily reflect those of anyone else on the Federal Open Market Committee (FOMC) or in the Federal Reserve System.

Put simply, this is one of those times where the operative words are, “Pat said,” not “the Fed said.”

Now, to begin, I’m going to first address the two topics that I get asked about most often: interest rates and inflation. And I would guess they are the topics front and center in many of your minds as well.

After the FOMC’s last policy rate hike in July, I went on record with my view that, if economic and financial conditions evolved roughly as I expected they would, we could hold rates where they are. And I am pleased that, so far, economic and financial conditions are evolving as I expected, if not perhaps even a tad better.

Let’s look at the current dynamics. There is a steady, if slow, disinflation under way. Labor markets are coming into better balance. And, all the while, economic activity has remained resilient.

Given this, I remain today where I found myself after July’s meeting: Absent a stark turnabout in the data and in what I hear from contacts, I believe that we are at the point where we can hold rates where they are.

In barely more than a year, we increased the policy rate by more than 5 percentage points and to its highest level in more than two decades — 11 rate hikes in a span of 12 meetings prior to September. We not only did a lot, but we did it very fast.

We also turned around our balance sheet policy — and we will continue to tighten financial conditions by shrinking the balance sheet.

The workings of the economy cannot be rushed, and it will take some time for the full impact of the higher rates to be felt. In fact, I have heard a plea from countless contacts, asking to give them some time to absorb the work we have already done.

I agree with them. I am sure policy rates are restrictive, and, as long they remain so, we will steadily press down on inflation and bring markets into a better balance.

Holding rates steady will let monetary policy do its work. By doing nothing, we are still doing something. And I would argue we are doing quite a lot.

Headline PCE inflation remained elevated in August at 3.5 percent year over year, but it is down 3 percentage points from this time last year. About half of that drop is due to the volatile components of energy and food that, while basic necessities, they are typically excluded by economists in the so-called core inflation rate to give a more accurate assessment of the pace of disinflation and its likely path forward.

Well, core PCE inflation has also shown clear signs of progress, and the August monthly reading was its smallest month-over-month increase since 2020.

So, yes, a steady disinflation is under way, and I expect it to continue. My projection is that inflation will drop below 3 percent in 2024 and level out at our 2 percent target thereafter.

However, there can be challenges in assessing the trends in disinflation. For example, September’s CPI report came out modestly on the upside, driven by energy and housing.

Let me be clear about two things. First, we will not tolerate a reacceleration in prices. But second, I do not want to overreact to the normal month-to-month variability of prices. And for all the fancy techniques, the best way to separate a signal from noise remains to average data over several months. Of course, to do so, you need several months of data to start with, which, in turn, demands that, yes, we remain data-dependent but patient and cautious with the data.

Turning to the jobs picture, I do anticipate national unemployment to end the year at about 4 percent — just slightly above where we are now — and to increase slowly over the next year to peak at around 4.5 percent before heading back toward 4 percent in 2025. That is a rate in line with what economists call the natural rate of unemployment, or the theoretical level in which labor market conditions support stable inflation at 2 percent.

Now, that said, as you know, there are many factors that play into the calculation of the unemployment rate. For instance, we’ve seen recent months where, even as the economy added more jobs, the unemployment rate increased because more workers moved off the sidelines and back into the labor force. There are many other dynamics at play, too, such as technological changes or public policy issues, like child care or immigration, which directly impact employment.

And beyond the hard data, I also have to balance the soft data. For example, in my discussions with employers throughout the Third District, I hear that given how hard they’ve worked to find the workers they currently have, they are doing all they can to hold onto them.

So, to sum up the labor picture, let me say, simply, I do not expect mass layoffs.

do expect GDP gains to continue through the end of 2023, before pulling back slightly in 2024. But even as I foresee the rate of GDP growth moderating, I do not see it contracting. And, again, to put it simply, I do not anticipate a recession.

Look, this economy has been nothing if not unpredictable. It has proven itself unwilling to stick to traditional modeling and seems determined to not only bend some rules in one place, but to make up its own in another. However, as frustratingly unpredictable as it has been, it continues to move along.

And this has led me to the following thought: What has fundamentally changed in the economy from, say, 2018 or 2019? In 2018, inflation averaged 2 percent almost to the decimal point and was actually below target in 2019. Unemployment averaged below 4 percent for both years and was as low as 3.5 percent — both nationwide and in our respective states — while policy rates peaked below 2.5 percent.

Now, I’m not saying we’re going to be able to exactly replicate the prepandemic economy, but it is hard to find fundamental differences. Surely, I cannot and will not minimize the immense impacts of the pandemic on our lives and our families, nor the fact that for so many, the new normal still does not feel normal. From the cold lens of economics, I do not see underlying fundamental changes. I could also be wrong, and, trust me, that would not be the first time this economy has made me rethink some of the classic models. We just won’t know for sure until we have more data to look at over time.

And then, of course, there are the economic uncertainties — both national and global — against which we also must contend. The ongoing auto worker strike, among other labor actions. The restart of student loan payments. The potential of a government shutdown. Fast-changing events in response to the tragic attacks against Israel. Russia’s ongoing war against Ukraine. Each and every one deserves a close watch.

These are the broad economic signals we are picking up at the Philadelphia Fed, but I would note that the regional ones we follow are also pointing us forward.

First, while in the Philadelphia Fed’s most recent business outlook surveys, which survey manufacturing and nonmanufacturing firms in the Third District, month-over-month activity declined, the six-month outlooks for each remain optimistic for growth.

And we also publish a monthly summary metric of economic activity, the State Coincident Indexes. In New Jersey, the index is up slightly year over year through August, which shows generally positive conditions. However, the three-month number from June through August was down, and while both payroll employment and average hours worked in manufacturing increased during that time, so did the unemployment rate — though a good part of that increase can be explained as more residents moved back into the labor force.

And for those of you joining us from the western side of the Delaware River, Pennsylvania’s coincident index is up more than 4 percent year over year through August and 1.7 percent since June. Payroll employment was up, and the unemployment rate was down; however, the number of average hours worked in manufacturing decreased.

There are also promising signs in both states in terms of business formation. The number of applications, specifically, for high-propensity businesses — those expected to turn into firms with payroll — are remaining elevated compared with pre-pandemic levels. Again, a promising sign.

So, it is against this full backdrop that I have concluded that now is the time at which the policy rate can remain steady. But I can hear you ask: “How long will rates need to stay high.” Well, I simply cannot say at this moment. My forecasts are based on what we know as of late 2023. As time goes by, as adjustments are completed, and as we have more data and insights on the underlying trends, I may need to adjust my forecasts, and with them my time frames.

I can tell you three things about my views on future policy. First, I expect rates will need to stay high for a while.

Second, the data and what I hear from contacts and outreach will signal to me when the time comes to adjust policy either way. I really do not expect it, but if inflation were to rebound, I know I would not hesitate to support further rate increases as our objective to return inflation to target is, simply, not negotiable.

Third, I believe that a resolute, but patient, monetary policy stance will allow us to achieve the soft landing that we all wish for our economy.

Before I conclude and turn things over to Rick to kick off our Q&A, I do want to spend a moment on a topic that he and I recently discussed, and it’s something about which I know there is generally great interest: fintech. In fact, I understand there is discussion about NACD hosting a conference on fintech.

Well, last month, we at the Philadelphia Fed hosted our Seventh Annual Fintech Conference, which brought business and thought leaders together at the Bank for two days of real in-depth discussions. And I am extraordinarily proud of the fact that the Philadelphia Fed’s conference has emerged as one of the premier conferences on fintech, anywhere. Not that it’s a competition.

I had the pleasure of opening this year’s conference, which always puts a focus on shifts in the fintech landscape. Much of this year’s conference centered around developments in digital currencies and crypto — and, believe me, some of the discussions were a little, shall we say, “spirited.” However, my overarching point to attendees was the following: Regardless of one’s views, whether in favor of or against such currencies, our reality requires us to move from thinking in terms of “what if” to thinking about “what next.”

In many ways, we’re beyond the stage of thinking about crypto and digital currency and into the stage of having them as reality — just as AI has moved from being the stuff of science fiction to the stuff of everyday life. What is needed now is critical thinking about what is next. And we at the Federal Reserve, both here in Philadelphia and System-wide, are focused on being part of this discussion.

We are also focused on providing not just thought leadership but actionable leadership. For example, the Fed rolled out our new FedNow instant payment service platform in July. With FedNow, we will have a more nimble and responsive banking system.

To be sure, FedNow is not the first instant payment system — other systems, whether operated by individual banks or through third parties, have been operational for some time. But by allowing banks to interact with each other quickly and efficiently to ensure one customer’s payment becomes another’s deposit, we are fulfilling our role in providing a fair and equitable payment system.

Another area where the Fed is assuming a mantle of leadership is in quantum computing, or QC, which has the potential to revolutionize security and problem-solving methodologies throughout the banking and financial services industry. But that upside also comes with a real downside risk, should other not-so-friendly actors co-opt QC for their own purposes.

Right now, individual institutions and other central banks globally are expanding their own research in QC. But just as these institutions look to the Fed for economic leadership, so, too, are they looking to us for technological leadership. So, I am especially proud that this System-wide effort is being led from right here at the Philadelphia Fed.

I could go on and talk about fintech for much longer. After all, I’m actually an engineer more than I am an economist. But I know that Rick is interested in starting our conversation, and I am sure that many of you are ready to participate.

But one last thought on fintech — my answers today aren’t going to be generated by ChatGPT.

On that note, Rick, thanks for allowing me the time to set up our discussion, and let’s start with the Q&A.

[archived PDF of the above speech]
Economics-Watching: Third-Quarter GDP Growth Estimate Increased

[from the Federal Reserve Bank of Atlanta’s GDPNow]

The growth rate of real gross domestic product (GDP) is a key indicator of economic activity, but the official estimate is released with a delay. The Federal Reserve Bank of Atlanta’s GDPNow forecasting model provides a “nowcast” of the official estimate prior to its release by estimating GDP growth using a methodology similar to the one used by the U.S. Bureau of Economic Analysis.

GDPNow is not an official forecast of the Atlanta Fed. Rather, it is best viewed as a running estimate of real GDP growth based on available economic data for the current measured quarter. There are no subjective adjustments made to GDPNow—the estimate is based solely on the mathematical results of the modelIn particular, it does not capture the impact of COVID-19 and social mobility beyond their impact on GDP source data and relevant economic reports that have already been released. It does not anticipate their impact on forthcoming economic reports beyond the standard internal dynamics of the model.

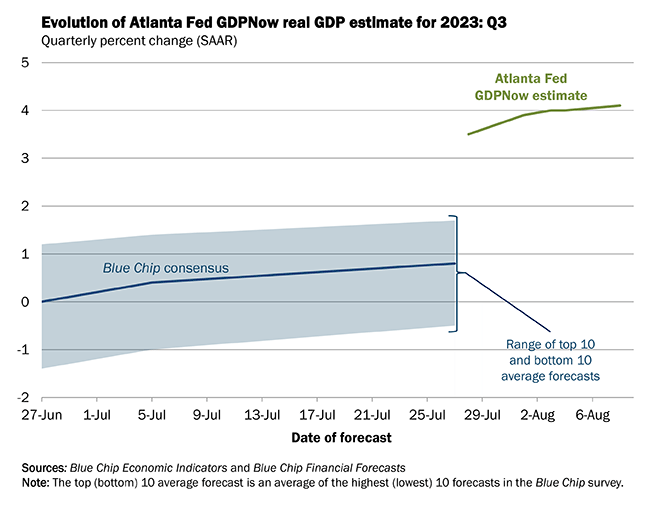
The GDPNow model estimate for real GDP growth (seasonally adjusted annual rate) in the third quarter of 2023 is 4.1 percent on August 8, up from 3.9 percent on August 1. After recent releases from the U.S. Census Bureau, the Institute for Supply Management, the U.S. Bureau of Economic Analysis, and the U.S. Bureau of Labor Statistics, an increase in the nowcast of third-quarter real gross private domestic investment growth from 5.2 percent to 8.1 percent was slightly offset by decreases in the nowcasts of third-quarter real personal consumption expenditures growth and third-quarter real government spending growth from 3.5 percent and 2.9 percent, respectively, to 3.2 percent and 2.7 percent, while the nowcast of the contribution of the change in real net exports to second-quarter real GDP growth increased from 0.08 percentage points to 0.11 percentage points.

The next GDPNow update is Tuesday, August 15.

Economy-Watching, USA: First-Quarter GDP Growth Estimate Decreased

[from the Federal Reserve Bank of Atlanta]

GDPNow

First-Quarter GDP Growth Estimate Decreased

On April 5, the GDPNow model estimate for real GDP growth in the first quarter of 2023 is 1.5 percent, down from 1.7 percent on April 3.

The next GDPNow update is Monday, April 10.

Want to see even more economic data? The Atlanta Fed’s EconomyNow app will put GDPNow and all its data tools right in your hands. Download it today to see the latest data on inflation, growth, and the labor market.

Economics-Watching: Fourth-Quarter GDP Growth Estimate Inches Up

The growth rate of real gross domestic product (GDP) is a key indicator of economic activity, but the official estimate is released with a delay. Our GDPNow forecasting model provides a “nowcast” of the official estimate prior to its release by estimating GDP growth using a methodology similar to the one used by the U.S. Bureau of Economic Analysis.

GDPNow is not an official forecast of the Atlanta Fed. Rather, it is best viewed as a running estimate of real GDP growth based on available economic data for the current measured quarter. There are no subjective adjustments made to GDPNow—the estimate is based solely on the mathematical results of the model. In particular, it does not capture the impact of COVID-19 and social mobility beyond their impact on GDP source data and relevant economic reports that have already been released. It does not anticipate their impact on forthcoming economic reports beyond the standard internal dynamics of the model.

Recent forecasts for the GDPNow model are available here. More extensive numerical details—including underlying source data, forecasts, and model parameters—are available as a separate spreadsheet. You can also view an archive of recent commentaries from GDPNow estimates.

Please note that the Federal Reserve no longer supports the GDPNow app. Download the Federal Reserve’s EconomyNow app or go to the Atlanta Fed’s website to continue to get the latest GDP nowcast and more economic data.

Latest estimate: 3.9 percent — January 3, 2023

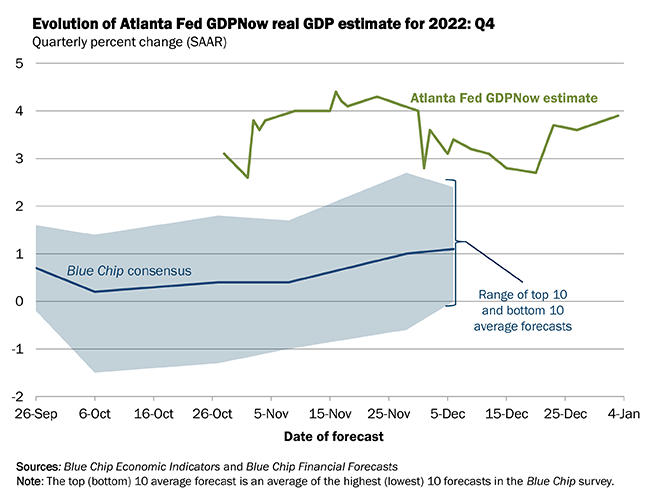
The GDPNow model estimate for real GDP growth (seasonally adjusted annual rate) in the fourth quarter of 2022 is 3.9 percent on January 3, up from 3.7 percent on December 23. After last week’s Advance Economic Indicators report from the U.S. Census Bureau and this morning’s construction spending release from the U.S. Census Bureau, the nowcasts of fourth-quarter real gross private domestic investment growth and fourth-quarter real government spending growth increased from 3.8 percent and 0.8 percent, respectively, to 6.1 percent and 1.0 percent, respectively, while the nowcast of the contribution of the change in real net exports to fourth-quarter real GDP growth decreased from 0.35 percentage points to 0.17 percentage points.

World-Watching: The Problem with the Current Russia Sanctions Regime

[from Project Syndicate, by Mohamed A. El-Erian]

There is much debate about the effectiveness of Western sanctions, the Ukraine war’s implications for markets and the global economy, and what the West’s next steps should be. While there are few good options, some are clearly worse than others.

Cambridge — It has been five months since Europe and the United States imposed tough economic and financial sanctions on Russia, a G20 country that was the world’s eleventh-largest economy on the eve of its invasion of Ukraine. While the sanctions have been gradually strengthened in the intervening months, debate rages about their effectiveness, the war’s broader implications for markets and the global economy, and what the West’s next steps should be.

On the first question, although the sanctions have been less effective than Europe and the U.S. had hoped, they also are proving more onerous than the Kremlin claims. Russia’s central bank expects GDP to contract by 8-10% this year, while other forecasters expect a larger fall, together with longer-lasting damage to growth potential. Imports and exports have been severely disrupted, and inflows of foreign investment have essentially stopped. Shortages are multiplying, pushing inflation higher. At this point, the country no longer has a properly functioning foreign-exchange market.

The sanctions would have bitten much harder had the West not opted for a carve-out of Russia’s energy sector, and had many more countries joined the U.S. and Europe in the effort. Because that didn’t happen, Russia has not felt nearly as much pressure as it would have. Moreover, it has been able to continue trading through various side and back doors that will likely become increasingly important as long as the sanctions regime, as currently designed, continues.

Nonetheless, it is only a matter of time before the Russian economy experiences a harder hit. Inventories of imported goods – including many critical technological and industrial inputs – are dwindling fast, and many sectors are becoming less resilient. The cumulative damage to Russia’s economy over time will be significant and long-lasting – a fact that has not yet been fully captured by consensus medium-term forecasts.

The second question concerns global spillovers from the war and the sanctions regime. Most observers agree that Russia’s invasion has increased not just energy insecurity but also food insecurity, highlighting the fallout from the war’s disruption to Ukrainian agricultural exports. But there is still much debate about the West’s use of the economic nuclear sanctions option: the curbs placed on Russia’s central bank and on Russia’s use of the international payments system.

These curbs are far more intrusive than the usual mix of restrictions on sanctioned government and private sector trade and on individuals’ financial dealings. Yet, because they are not subject to any internationally agreed standards, guidelines, or checks and balances, they fall outside the purview of relevant global-governance bodies such as the Bank for International Settlements, the International Monetary Fund, and the World Trade Organization.

In a time of war, such oversight might seem like a nicety. But some worry that the sanctions could significantly reduce the dollar’s role as the world’s reserve currency and the U.S. financial system’s role as the primary global intermediary for other countries’ savings and investments. After all, a growing number of countries undoubtedly now feel more vulnerable to the reach of U.S. sanctions.

But it is impossible to replace something with nothing, which means that no significant loss of dollar or U.S. financial primacy will occur in the immediate future. Rather, the sanctions will lend further momentum to the gradual process of global economic fragmentation, which was also fueled a few years ago by the tariffs imposed by the Trump administration. More countries now have even more of a reason to pursue greater financial resilience and inherently inefficient forms of self-insurance.

That brings us to the third debate. With no end in sight for the war, what should the West do next? Fearing the implications for energy prices and the supply of gas to Europe, many in the West are tempted to call for a moratorium on any new sanctions – or even for additional carve-outs. Others, however, favor additional measures to hold Russia accountable for its indiscriminate attacks on Ukrainian civilians.

In any case, maintaining the current sanctions regime is not problem-free, owing to the twin objectives of pressuring Russia and limiting the economic disruption to Europe. Moreover, as European Commission President Ursula von der Leyen recently said, it feels as if Russia is “blackmailing” Europe by threatening to disrupt gas supplies at any moment. No wonder the Commission is urging member countries to cut consumption by 15%.

Under the current sanctions regime, the West risks falling between two horses. While easing sanctions could help alleviate concerns about Europe’s economic outlook, this option is a non-starter, given the atrocities that Russian forces are committing in Ukraine. But if the West is serious about pressuring Russia through truly crippling economic and financial sanctions, it needs to bite the bullet and eliminate the carve-outs for energy.

Doing so would undoubtedly have a severe short-term economic impact on European economies and the rest of the world, amplifying the “little fires everywhere” syndrome that I warned about in May. It is therefore critical that governments use their available fiscal space to provide targeted support to vulnerable segments of the population, as well as to fragile countries; and multilateral agencies must support developing countries through aid and a more operational debt relief framework. If done properly, this option would yield better outcomes in the medium and long term than the current strategy.

Muddling through risks bringing about the worst of all possible worlds. It is insufficient to dissuade Russia from continuing its illegal war; it is fueling deeper fragmentation of the international monetary system; and it is not even protecting Europe from a winter gas disruption.

Mohamed A. El-Erian, President of Queens’ College at the University of Cambridge, is a professor at the Wharton School of the University of Pennsylvania and the author of The Only Game in Town: Central Banks, Instability, and Avoiding the Next Collapse (Random House, 2016).

Penn Wharton: U.S. Budget Model

The U.S. Fiscal Imbalance: June 2022

[from Penn Wharton, University of Pennsylvania]

We estimate that the U.S. federal government faces a permanent fiscal imbalance equal to over 10 percent of all future GDP under current law where future federal spending outpaces tax and related receipts. Federal government debt will climb to 236 percent of GDP by 2050 and to over 800 percent of GDP by year 2095 (within 75 years).

Read the full analysis [archived PDF].

View the data [archived XLSX].

Brief based on work by Agustin Diaz, Jagadeesh Gokhale and Kent Smetters. Prepared by Mariko Paulson.

U.S. Bureau of Economic Analysis: Marine Economy, 2020

[from the U.S. Bureau of Economic Analysis]

The marine economy accounted for 1.7 percent, or $361.4 billion, of current-dollar U.S. gross domestic product (GDP) in 2020 and 1.7 percent, or $610.3 billion, of current-dollar gross output. Real (inflation-adjusted) GDP for the marine economy decreased 5.8 percent from 2019 to 2020, compared with a 3.4 percent decrease for the overall U.S. economy. Real gross output for the marine economy decreased 8.5 percent, while marine economy compensation decreased 1.2 percent, and employment decreased 10.8 percent.

Read the current release [Archived PDF]

Asia-Watching: New Studies on Tariffs; FDIs and Global Value Chains

[from Asia-Pacific Economic Cooperation, May 15, 2022]

Study on Tariffs: Analysis of the
Regional Comprehensive Economic Partnership
Tariff Liberalization Schedules

prepared by Carlos Kuriyama, Sylwyn C. Calizo Jr. & Jason Carlo O. Carranceja

RCEP is the largest regional free trade agreement (FTA) in the world. Its potential is huge, as its 15 members account for about 2.2 billion people (30% of the global population), a regional gross domestic product (GDP) of about USD38,813 billion (30% of global GDP), and 28.8% of global trade. This study examines market access commitments and comparing the extent of tariff liberalization within RCEP as well as the other major regional FTA in the Asia-Pacific, the Comprehensive and Progressive Agreement for Trans-Pacific Partnership (CPTPP).

Read the full article [archived PDF].

The FDI Network, Global Value Chain Participation and Economic Upgrading

by Luna Ge Lai, Nguyen Thu Quynh & Akhmad Bayhaqi

Foreign direct investment (FDI) represents an important internationalization pathway to global value chain (GVC) participation. APEC economies as a group have dominated as FDI recipients, accounting for nearly 52% of the global inward FDI stock. This study analyses the role of FDI in economiesGVC participation.

Read the full article [archived PDF].

BEA News: Gross Domestic Product (Third Estimate), Corporate Profits, and GDP by Industry, Fourth Quarter and Year 2021

(from the U.S. Bureau of Economic Analysis)

The U.S. Bureau of Economic Analysis (BEA) has issued the following news release today:

Real gross domestic product (GDP) increased at an annual rate of 6.9 percent in the fourth quarter of 2021, following an increase of 2.3 percent in the third quarter. The increase was revised down 0.1 percentage point from the “second” estimate released in February. The acceleration in the fourth quarter was led by an acceleration in inventory investment, upturns in exports and residential fixed investment and an acceleration in consumer spending. In the fourth quarter, COVID-19 cases resulted in continued restrictions and disruptions in the operations of establishments in some parts of the country. Government assistance payments in the form of forgivable loans to businesses, grants to state and local governments, and social benefits to households all decreased as provisions of several federal programs expired or tapered off.

Profits from current production (corporate profits with inventory valuation and capital consumption adjustments) increased $20.4 billion in the fourth quarter, compared with an increase of $96.9 billion in the third quarter.

Private goods-producing industries increased 5.4 percent, private services-producing industries increased 8.5 percent, and government increased 0.1 percent. Overall, 19 of 22 industry groups contributed to the fourth-quarter increase in real GDP.

Read the full report [Archived PDF].