Federal Reserve policymakers need current information about economic conditions to make well-informed monetary policy decisions. But hard data, such as GDP and the unemployment rate, is released with a significant lag, making it difficult to get a precise, real-time read on the economy, especially during times of rapid change.
Hard data is based on precise quantitative measurements, such as sales figures or the specific prices firms are charging. By contrast, soft data is qualitative, focusing on trends, expectations, and sentiment around economic activity. And while hard data looks backward, soft data from the regional surveys can look forward—providing important information about expectations for the future and emerging trends.
The surveys are sent to over 300 business executives and managers at firms across industries during the first week of every month. While about two-thirds of participating firms have 100 or fewer employees, some have hundreds or thousands of workers.
Leaders at the firms fill out a short questionnaire asking if business activity has increased, decreased, or stayed the same compared to the prior month. The surveys ask about indicators such as prices–yielding insights into inflationary pressures–as well as employment, orders, and capital spending. Respondents answer questions about how they expect these indicators to change over the next six months, offering a forward-looking perspective on the economy’s trajectory.
From the responses, New York Fed researchers construct diffusion indexes by calculating the difference between the percentage of firms reporting increased activity and those reporting decreased activity. Positive values indicate that more firms say activity increased than decreased, suggesting activity expanded over the month. Higher positive values indicate stronger growth, while lower negative values indicate stronger declines.
The surveys include local businesses, like restaurants and car dealerships, as well as firms with national and global reach, such as software manufacturers and shipping enterprises. As a result, the economic indicators derived from the surveys are often early predictors of national economic patterns, frequently aligning with hard data released later.
In addition to providing data to track economic conditions, the regional surveys also provide a channel to hear directly from local business leaders. Every month, survey respondents are asked for their comments, offering the opportunity for businesses to share their thoughts, concerns, and experiences with the New York Fed. This helps researchers and policymakers understand how businesses are being affected by economic conditions.
The surveys act as one of the bridges between the New York Fed and the business community, ensuring the voices of regional businesses are considered in economic assessments and policy discussions as well as enhancing the ability of policymakers to make informed decisions to respond effectively to economic challenges.
Executives, owners, or managers of businesses in New York, northern New Jersey, or Fairfield County, Conn., interested in participating in the New York Fed’s monthly business surveys can find more information here. The next survey results will be released on Oct. 15 and 16.
While economic activity in the United States has remained resilient, recent data show some softening in the labor market. Swings in net exports affected GDP in the first half of 2025, with imports surging in the first quarter followed by imports declining in the second quarter. Inflation remains above the Fed’s 2% goal, and a near-term rise from tariffs appears likely. Job gains in recent months have slowed. Downward revisions for recent job growth estimates have been large, but the magnitudes of these revisions are not out of line with historical values. Job growth estimates remain reliable despite data collection challenges. With the balance of risks surrounding the Fed’s dual mandate now shifting, market participants are projecting an easing of monetary policy in coming months.
Following the inflationary surge from 2021 to 2023, which was touched off by supply chain constraints and shipping bottlenecks, we evaluate a new panel of own-firm price and unit cost growth expectations in the Atlanta Fed’s Survey of Business Uncertainty for signs that the anticipated impact from tariffs is broadening beyond directly affected firms. We find evidence for the potential of tariffs to touch off another bout of high inflation. First, firms that are directly exposed to tariffs have increased their year-ahead price growth expectations sharply (by 0.7 percentage points). Second, firms that are not directly exposed to tariffs but are operating in industries that are highly exposed to tariffs anticipate a moderately higher trajectory for year-ahead price growth (0.3 percentage points). Third, this broadening of overall price pressures—a key feature of the pandemic-era inflationary impulse—is only partially offset by lower price increases from tariff-exposed firms that are operating largely in industries not exposed to tariffs.
Key Findings
Firms, en masse, have increased their year-ahead price growth expectations since the end of 2024. This is especially true for firms directly exposed to tariffs.
We find evidence of a broadening out of the influence of tariffs beyond those directly exposed. Unexposed firms in exposed industries anticipate a moderately higher trajectory of year-ahead price growth.
The broadening of anticipated price growth is only partially offset by lower price growth expectations among tariff-exposed firms that are operating in largely unexposed industries.
by Iñaki Aldasoro, Jon Frost, Sang Hyuk Lim, Fernando Perez-Cruz & Hyun Song Shin
Key takeaways
Existing anti-money laundering (AML) approaches relying on trusted intermediaries have limited effectiveness with decentralized record-keeping in permissionless public blockchains.
The public transaction history on blockchains can enable AML and other compliance efforts, such as FX regulations, by leveraging the provenance and history of any particular unit or balance of a cryptoasset, including stablecoins.
An AML compliance score based on the likelihood that a particular cryptoasset unit or balance is linked with illicit activity may be referenced at points of contact with the banking system (“off-ramps”), preventing inflows of the proceeds of illicit activity and supporting a culture of “duty of care” among crypto market participants.
by Emanuel Kohlscheen, Phurichai Rungcharoenkitkul, Dora Xia & Fabrizio Zampolli
Key takeaways
Tariffs affect economies most directly through trade volume and prices. Tariffs lower output growth everywhere, though the magnitude varies by country and scenario. They also tend to raise inflation, most notably in the imposing countries.
Ever since new tariffs were enacted in early 2025, a key policy question has been what is the extent to which businesses will pass tariff costs through to prices, and when? The effects of a tariff are rarely straightforward, given, among other things, competitive dynamics and the challenges of implementation, but the historically large and changing nature of these tariffs have created additional levels of uncertainty over the effects.
In uncertain times, anecdotal evidence from businesses can be especially insightful. We are learning how businesses are reacting to tariffs through the Richmond Fed’s business surveys as well as through hundreds of one-on-one conversations with Fifth District businesses since the start of 2025.
These conversations showcase that navigating tariffs is a complex and sometimes protracted process for firms, particularly when there is uncertainty. Firms describe several reasons they may not have experienced the full impact of proposed tariffs yet (even when goods and countries they deal with are subject to them), as well as reasons that even when they have incurred tariff-related cost increases, there can be a delayed impact on pricing decisions.
Reasons Firms May Not Have Incurred Tariffs Yet
Business contacts describe several strategies or circumstances that can delay or reduce the tariffs on inputs or other imported items. These include the following:
Delayed ordering. In response to announced tariffs, many firms ran down existing inventories or ran inventories lean in hopes that tariffs would become lower. For example, a national retailer said everyone was “delaying all we can delay in hopes we get more clarity on trade deals” and reported meeting with procurement teams multiple times per week to discuss ports and ship capacity, evolving tariffs, and inventories to keep goods flowing and prices as low as possible. One port said they have a crane waiting to be shipped but can’t do so now due to the tariffcost.
Cost-sharing.Vendor relationships are often long term, and many firms report partnering with suppliers and customers to share costs. When tariffs first rolled out, multiple firms (a beverage distributer, supply chainlogistics company) anticipated a “rule of thirds” where the cost was split evenly among the supplier, the importer, and the customer. A national retailer reported being large enough to force suppliers to bear much of the cost, though it varied by relationship and item. Interestingly, firms also reported that cost-sharing is not necessarily a permanent solution: A steeldistributer said that with the second round of tariffs announced in June, “The ‘kumbaya’ of cost-sharing was likely to come to an end.” Similarly, a fabricmanufacturer said that upon an announced trade deal with Vietnam that took tariffs from 10 percent to 20 percent, suppliers took a new stand on cost sharing: “Most vendors said you’re on your own” for the second 10 percent, and one even clawed back cost-sharing from the first round.
Transit time. It takes up to six weeks for container ships to arrive to the East Coast from China, so even if firms are ordering goods, there is a natural delay when the tariff is incurred. Shipping time in a world of rapidly changing tariff proposals add to uncertainty around tariffcosts.
Tariff implementation delays.Richmond FedeconomistMarina Azzimonti has found that a variety of tariff implementation delays help explain why actual tariffs as of May 2025 were much lower than expected. These factors include legacy exemptions and delays in customs system updates. Azzimonti also finds that a small percentage is explained by countries substituting away from high-tariff countries. For example, one national retailer we spoke with was in the process of dropping 10 percent of products sourced from China. Whether a company can change sourcing varies dramatically by type of firm and product.
As our monthly business surveys have found, many firms report deploying more than one strategy to delay tariffs. Notably, many of these delays are only temporary.
Reasons Tariffs May Have a Delayed Impact on Prices
Even when firms have incurred tariffs, they give several reasons why tariffs may not be immediately reflected in the prices they charge for their products. These include the following:
Waiting for tariff policy to clarify. Higher prices could reduce demand for goods and services and/or lead firms to lose market share, so many firms said they are hesitant to increase prices until they’re sure tariffs will remain in place. For example, a large national retailer said if tariffs are finalized at a sufficiently low level, they’ll absorb what they’ve incurred to date, but if high tariffs stick, they’ll have to raise prices. A steel fabricator for industrial equipment described being reluctant to raise prices on the 10 percent cost increases they’d seen thus far but would have to raise prices should the increases reach 12 to 13 percent. A grocery store chain was reluctant to raise prices and instead might reduce margins, which had recovered in recent years, to maintain their customer base. Some firms explicitly noted a strategy to both raise prices over time and pursue efficiency gains to cut costs and completely restore margins within a year or two.
Elasticity testing. Firms reported testing across goods whether consumers will accept price increases. A furnituremanufacturer said he’s seen competitors pass along just 5 percentage points of the tariffs at a time so it isn’t such a huge shock to customers, though in that sector, “We all end in the same place which is the customer bearing most of it.” A national retailer said most firms are doing a version of stair-stepping tariffs through, e.g., raising prices a small amount once or twice to see if consumer demand holds, and if so, trying again two months later. This retailer said prices were going up very marginally in early summer, would increase more in July and August, and would be up by 3 to 5 percent by the end of Q4 and into 2026. Another national retailer said they would start testing the extent to which demand falls with price increases, e.g., when the first items that were subject to tariffs—in this case back to school items—hit shelves in late July.
Blind margin. Some firms reported attempting to pass through cost in less noticeable ways. While any price increase to consumers will be captured in measures of aggregate inflation, the fact that price increases may occur on non-tariffedgoods might make it difficult to directly relate price increases to tariffs. An outdoor goodsretailer said, “Unless it’s a branded item where everyone knows the price, if something goes for $18, it can also go for $19.” A national retailer plans to print new shelf labels with updated pricing, which will be less noticeable for consumers compared to multiple new price stickers layered on top. This takes time (akin to a textbook “menu cost” in economics), so it will not be reflected in prices until July and August. A grocery store said their goal was to increase average prices across the store but focus on less visible prices.
Selling out of preexisting inventory: Many firms noted they still have productioninventory from before tariffs were announced, so they do not need to raise prices as long as they still sell these lower cost goods. A national retailer noted they have at least 25 weeks of inventory on hand for most importedproducts. A firm that produces grocery items said they will decide how much to raise prices as they get closer to selling tariff-affected products. Similarly, retailers order seasonal items quarters in advance. Many were receiving items for fall and winter when the new tariffs were going into effect in the spring. They paid the tariff then, but we won’t see the price increase until those items hit the shelves in the fall or winter. One retailer speculated that seasonal décor items will look the most like a one-time increase.
Pre-established prices. Many firms face infrequent pricing due to factors like annual contracts or pre-sales. For example, a dealer of farm equipment gets half its sales through incentivized pre-sales to lock in demand and smooth around crop cycles. They noted that while it would be difficult to retroactively ask those customers to pay for part of the tariff, they will pass tariffs directly through on spare parts. A steel fabricator for industrial equipment has a contract for steel through Q3, so they haven’t been impacted yet by price increases. However, they will face new costs once that contract expires.
In general, compared to small firms, large firms have more ability to negotiate with vendors, temporarily absorb costs, burn cash, wait for strategic opportunity, and test things out. This matters because large firms often lead pricing behavior among firms, so these strategic choices may influence the response of inflation to tariffs more generally. Even within firm size, one often hears that negotiations on price vary considerably by relationship and item.
Conclusion
A key question surrounding tariffs is whether any effects on inflation will resemble a short-lived price increase—as in the simplest textbook model of tariffs—or a more sustained increase to inflation that may warrant tighter Fedmonetary policy. When asked in May what will determine the answer, Fed ChairJerome Powellcited three factors [archived PDF]: 1) the size of the tariff effects; 2) how long it takes to work their way through to prices; and 3) whether inflation expectations remain anchored. The insights shared above suggest the process from proposed tariffs to the prices set by firms is far from instantaneous or clear-cut, particularly when tariff policy is changing.
Sensing from businesses suggests that the impact of tariffs on their price-setting [archived PDF] has been lagged, but it is starting to play out. Nonetheless, it remains highly uncertain how tariffs will impact consumerinflation. The discussion above makes clear that firms are nimble and innovative in the face of challenge, and they are concerned about losing customers in the current environment, particularly consumer-facing firms. We will continue to learn from our business contacts and share their insights.
by Hamza Abdelrahman, Luiz Edgard Oliveira and Aditi Poduri
Information the San Francisco Fed collects from businesses and community sources for the Beige Book provides timely insights into economic activity at both the national and regional levels. Two new indexes based on Beige Book questionnaire responses track business sentiment across the western United States. The indexes track data on economic activity and inflation, serving as early indicators of official data releases and helping improve near-term forecasting accuracy. The latest index readings suggest weakening economic growth and intensifying inflationary pressures over the coming months.
This Economic Letter examines the economic information collected through the SF Fed’s Beige Book questionnaire over the past 10-plus years. We analyze this information by constructing sentiment indexes from the qualitative data and comparing them with quantitative measures of national and regional economic activity and inflation. We introduce two indexes—the SF Fed Business Sentiment Index and the SF Fed Inflation Gauge Index—which track our contacts’ views and expectations for economic growth and inflation, respectively. We find that these new indexes serve as reliable early indicators of official data releases and help improve near-term forecast accuracy. The SF Fed Business Sentiment Index has generally exhibited patterns similar to other recent business and household sentiment indexes, and the SF Fed Inflation Gauge Index has shown a strong uptick in expected inflation. To regularly monitor changes in these two indexes, the San Francisco Fed has launched a new Twelfth District Business Sentiment data page.
Constructing regional sentiment indexes
The San Francisco Fed sends out a Beige Book questionnaire to business and community contacts across the District eight times a year to gather regional information. In addition to answering questions regarding their organizations, respondents share their views on regional and national topics, including economic activity and inflationary pressures.
In two questions, respondents indicate whether they see national output growth and inflation rates increasing, decreasing, or staying stable over the coming year using a standard five-tiered scale. We use these responses since 2014 to formulate two business sentiment indexes, one on economic activity and another on inflation. We assign standard weights to the five-tiered qualitative scale that are symmetrical around zero. For example, we ask if activity is expected to “decrease significantly” = –2, “decrease” = –1, “remain unchanged” = 0, “increase” = 1, or “increase significantly” = 2. We add up the weighted shares of responses for each tier within each index. We then normalize each resulting series by its own average and standard deviation for ease of comparison with traditional economic indicators.
Tracking business sentiment
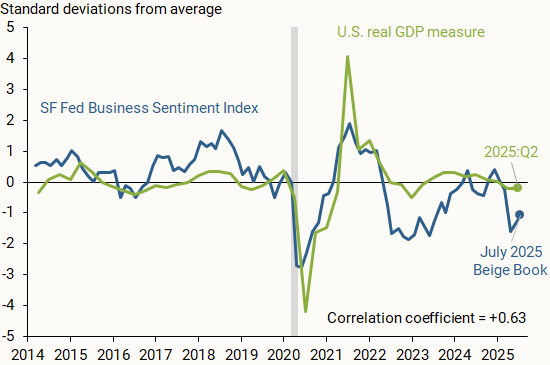
Figure 1 shows how the SF Fed Business Sentiment Index (blue line), compiled from responses to the question on national economic activity, compares with data on changes in national GDP (green line). We measure national output as the four-quarter change in inflation-adjusted, or real, GDP, normalized by its average and standard deviation so that it is centered around zero and, hence, more directly comparable to the SF Fed Business Sentiment Index. The vertical axis shows how many standard deviations away each observation is from its respective measure’s average from 2014 to mid-2025.
Figure 1 Economic growth versus business sentiment
The SF Fed Business Sentiment Index generally tracks the movements in national GDP over the past decade; a correlation coefficient of +0.63 on a scale of –1 to 1 indicates a moderately strong positive relationship between the two measures. A relatively recent exception started in 2022, when our index began showing a considerable decline relative to the national GDP measure. Respondents across the District were downbeat about economic growth and reported expectations of a sharp decline in consumer spending and overall household financial health following the depletion of pandemic-era savings (Abdelrahman and Oliveira 2023). A similar decline appeared in other measures of business and household sentiment. Nevertheless, overall economic growth continued at a solid pace. This decoupling between sentiment and hard data that began in 2022 was dubbed a “vibecession” (Daly 2024, Scanlon 2022).
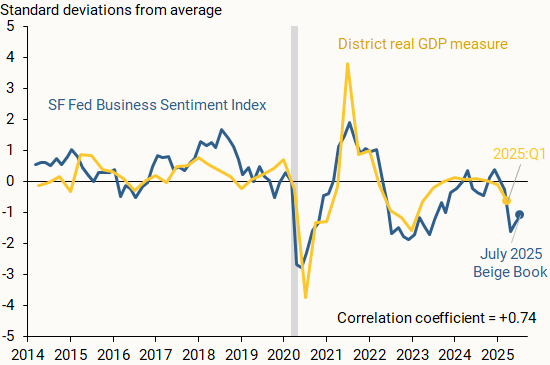
Another possible reason for the divergence between national real GDP and our Business Sentiment Index is the influence of the regional economy. Although respondents are asked about their views of national GDP, their responses may be affected by regional outcomes. Thus, our index may also reflect a regional perspective from our business and community contacts.
Figure 2 supports this rationale, showing the SF Fed Business Sentiment Index alongside a measure of regional output growth (gold line). We find that the measures closely track one another, including for 2022 and 2023, with a correlation coefficient of +0.74. We define District real GDP growth as the year-over-year percent change in the total output of the District’s nine states as reported by the Bureau of Economic Analysis (BEA). We normalize the series as described before.
Figure 2 Regional economic growth and business sentiment
Our findings indicate that the SF Fed Business Sentiment Index can serve as an accurate early indicator for national and regional output growth. Since the regional Beige Book questionnaire is collected twice each quarter, it provides particularly timely insights into economic activity during the current quarter. By contrast, the first GDP data release for any given quarter usually arrives a full month after that quarter has ended, and initial data releases for state-level output growth arrive with even more delay.
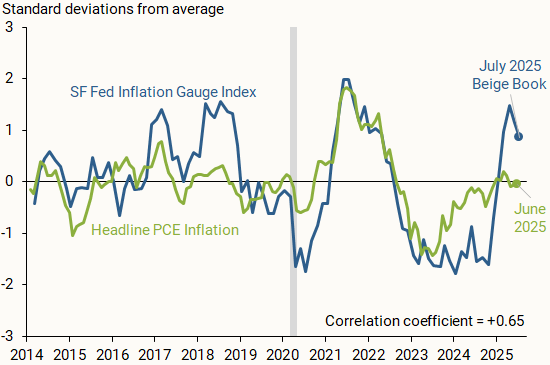
Our Beige Book questionnaire responses also provide insights into how business and community contacts in the District see national inflation evolving. Figure 3 compares the SF Fed Inflation Gauge Index (blue line) with monthly changes in the year-over-year headline personal consumption expenditures (PCE) inflation rate published by the BEA (green line). We normalize the inflation series and index as discussed earlier.
Figure 3 SF Fed Inflation Gauge Index versus realized inflation
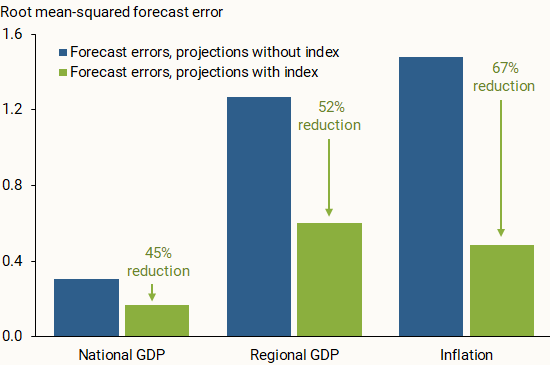
Beyond tracking data on national and regional economic conditions, we consider whether our two indexes can help improve one-year-ahead projections of output growth and overall inflation. We run linear regressions on a 2014–2022 data sample and estimate out-of-sample projections for the period starting in the first quarter of 2023. We run this analysis for the three economic measures—national GDP, regional GDP, and inflation—once with our index included on the right-hand side of the regression equation and once without the index. For this analysis, we use versions of the SF Fed Business Sentiment Index and the SF Fed Inflation Gauge Index that have been aggregated quarterly.
Figure 4 compares the out-of-sample projection accuracy of the two iterations. Across all economic measures, incorporating the SF Fed Business Sentiment Index or the SF Fed Inflation Gauge Index in the regression noticeably reduced the forecast errors for the out-of-sample period. This general result appears to hold when we project output growth and inflation one quarter ahead, in line with other studies that incorporate soft data from the Beige Book in short-term projections (Balke and Petersen 2002). The results are also consistent when using a local projections method from Jordà (2005) for one-year-ahead projections of output growth and shorter-term projections of inflation. This further supports the usefulness of our qualitative measures as early indicators of the future economic landscape over the short term.
Figure 4 Forecast errors with and without SF Fed sentiment indexes
Information collected from businesses and communities through the San Francisco Fed’s regional Beige Book questionnaire can provide valuable insights into the national and regional economies. Sentiment indexes described in this Letter use responses from Twelfth District Beige Book contacts to generally track economic activity and inflation. Our two indexes serve as reliable early indicators of official data, which could help improve near-term forecast accuracy. The SF Fed Business Sentiment Index remained negative for much of 2022 and 2023, possibly reflecting more subdued growth within the District relative to the United States. Meanwhile, the SF Fed Inflation Gauge Index spiked in recent months following adjustments to trade policy.
Therefore, the behavior and the volatility of different asset classes have been impacted, altering global financial conditions. This scenario requires particular caution from emerging market economies amid heightened geopolitical tensions.
Regarding the domestic scenario, the set of indicators on economic activity has shown some moderation in growth, as expected, but the labor market is still showing strength.
The inflation outlook remains challenging in several dimensions. Copom assessed the international scenario, economic activity, aggregate demand, inflation expectations, and current inflation. Copom then discussed inflation projections and expectations before deliberating on the current decision and future communication.
The global environment is more adverse and uncertain. If, on the one hand, the approval of certain trade agreements, along with recent inflation and economic activity data from the U.S., could suggest a reduction in global uncertainty, on the other hand, the U.S. fiscal policy—and, particularly for Brazil, the U.S. trade policy—make the outlook more uncertain and adverse. The increase of tradetariffs by the U.S. to Brazil has significant sectoral impacts and still uncertain aggregate effects that depend on the unfolding of the next steps in the negotiations and the perception of risk inherent to this process. The Committee is closely monitoring the potential impacts on the real economy and financial assets. The prevailing assessment within the Committee is the increased global outlook uncertainty, and, therefore, Copom should maintain a cautious stance. As usual, the Committee will focus on the transmission mechanisms from the external environment to the domestic inflation dynamics and their impact on the outlook.
The domestic economic activity outlook has indicated a certain moderation in growth, while also presenting mixed data across sectors and indicators.
Overall, some moderation in growth is observed, supporting the scenario outlined by the Committee. This moderation, necessary for the widening of the output gap and the convergence of inflation to the target, is aligned with a contractionary monetary policy. Monthly sectoral surveys and more timely consumption data support a gradual slowdown in growth.
The credit market, which is more sensitive to financial conditions, has shown clearer moderation. A decline in non-earmarkedcredit granting and an increase in interest and delinquency rates have been observed. Moreover, regarding householdcredit, there has been an increase in the household debt–service ratio and a deepening of the negative credit flow—that is, households repaying more debt than taking on. It was emphasized during the discussion that some recent measures, such as private payroll-deducted loans, have had less impact than many market participants expected. Given the implementation agenda in this credit line, as well as the effects of introducing and removing taxes on other credit modalities, the Committee believes it should closely monitor upcoming credit data releases.
Fiscal policy has a short-term impact, mainly through stimulating aggregate demand, and a more structural dimension, which has the potential to affect perceptions of debt sustainability and influence the term premium in the yield curve. A fiscal policy that acts counter-cyclically and contributes to reducing the risk premium favors the convergence of inflation to the target. Copom reinforced its view that the slowdown in structural reform efforts and fiscal discipline, the increase in earmarkedcredit, and uncertainties over the public debt stabilization have the potential to raise the economy’s neutral interest rate, with deleterious impacts on the power of monetary policy and, consequently, on the cost of disinflation in terms of activity. The Committee remained firmly convinced that policies must be predictable, credible, and countercyclical. In particular, the Committee’s discussion once again highlighted the need for harmonious fiscal and monetary policy.
Inflation expectations, as measured by different instruments and obtained from various groups of agents, remained above the inflation target at all horizons, maintaining the adverse inflation outlook. For shorter-term horizons, following the release of the most recent data, there has been a decline in inflation expectations. For longer-term horizons, conversely, there has been no significant change in inflation expectations between Copom meetings, even though measures of breakeven inflation extracted from financial assets have declined. The Committee reaffirmed and renewed its commitment to re-anchoring expectations and to conducting a monetary policy that supports such a movement.
De-anchored inflation expectations is a factor of discomfort shared by all Committee members and must be tamed. Copom highlighted that environments with de-anchored expectations increase the disinflation cost in terms of activity. The scenario of inflation convergence to the target becomes more challenging with de-anchored expectations for longer horizons. When discussing this topic, the main conclusion obtained and shared by all members of Copom was that, in an environment of de-anchored expectations—as currently is the case—greater monetary restriction is required for a longer period than would be otherwise appropriate.
The inflation scenario has continued to show downside surprises in recent periods compared with analysts’ forecasts, but inflation has remained above the target Industrial goods inflation, which has already been showing weaker wholesale price pressures, continued to ease in the more recent period. Food prices also displayed slightly weaker-than-expected dynamics. Finally, servicesinflation, which has greater inertia, remains above the level required to meet the inflation target, in a context of a positive output gap. Beyond the changes in items, or even short-term oscillations, the core inflation measures have remained above the value consistent with the target achievement for months, corroborating the interpretation that inflation is pressured by demand and requires a contractionary monetary policy for a very prolonged period.
Copom then addressed the projections. In the reference scenario, the interest rate path is extracted from the Focus survey, and the exchange rate starts at USD/BRL 5.552 and evolves according to the purchasing power parity (PPP). The Committee assumes that oil prices follow approximately the futures market curve for the following six months and then start increasing 2% per year onwards. Moreover, the energy tariff flag is assumed to be “green” in December of the years 2025 and 2026.
In the reference scenario, four-quarter inflation projections for 2025 and for 2026 are 4.9% and 3.6%, respectively (Table 1). For the relevant horizon for monetary policy—2027 Q1—the inflation projection based on the reference scenario extracted from the Focus survey remained at 3.4%, above the inflation target.
Regarding the balance of risks, it was assessed that the scenario of greater uncertainty continues to present higher-than-usual upside and downside inflation risks to the inflation outlook. Copom assessed that, among the upside risks for the inflation outlook and inflation expectations, it should be emphasized (i) a more prolonged period of de-anchoring of inflation expectations; (ii) a stronger-than-expected resilience of servicesinflation due to a more positive output gap; and (iii) a conjunction of internal and external economic policies with a stronger-than-expected inflationary impact, for example, through a persistently more depreciatedcurrency. Among the downside risks, it should be noted (i) a greater-than-projected deceleration of domestic economic activity, impacting the inflation scenario; (ii) a steeper global slowdown stemming from the trade shock and the scenario of heightened uncertainty; and (iii) a reduction in commodity prices with disinflationary effects.
Prospectively, the Committee will continue monitoring the pace of economic activity, which is a fundamental driver of inflation, particularly services inflation; the exchange rate pass-through to inflation, after a process of increased exchange rate volatility; and inflation expectations, which remain de-anchored and are drivers of future inflation behavior. It was emphasized that inflationary vectors remain adverse, such as the economic activity resilience and labor market pressures, de-anchored inflation expectations, and high inflation projections. This scenario prescribes a significantly contractionary monetary policy for a very prolonged period to ensure the convergence of inflation to the target.
Copom then discussed the conduct of monetary policy, considering the set of projections evaluated, as well as the balance of risks for prospective inflation.
Following a swift and firm interest rate hike cycle, the Committee anticipates, as its monetary policy strategy, continuity of the interruption of the rate hiking cycle to observe the effects of the cycle already implemented. It was emphasized that, once the appropriate interest rate is determined, it should remain at a significantly contractionary level for a very prolonged period due to de-anchored expectations. The Committee emphasizes that it will remain vigilant, that future monetary policy steps can be adjusted and that it will not hesitate to proceed with the rate hiking cycle if appropriate.
The Committee has been closely monitoring with particular attention the announcements regarding the imposition by the U.S. of tradetariffs on Brazil, reinforcing its cautious stance in a scenario of heightened uncertainty. Moreover, it continues to monitor how the developments on the fiscal side impact monetary policy and financial assets. The current scenario continues to be marked by de-anchored inflation expectations, high inflation projections, resilience on economic activity, and labor market pressures. Ensuring the convergence of inflation to the target in an environment with de-anchored expectations requires a significantly contractionary monetary policy for a very prolonged period.
Copom decided to maintain the Selic rate at 15.00% p.a., and judges that this decision is consistent with the strategy for inflation convergence to a level around its target throughout the relevant horizon for monetary policy. Without compromising its fundamental objective of ensuring price stability, this decision also implies smoothing economic fluctuations and fostering full employment.
The current scenario, marked by heightened uncertainty, requires a cautious stance in monetary policy. If the expected scenario materializes, the Committee foresees a continuation of the interruption of the rate hiking cycle to examine its yet-to-be-seen cumulative impacts, and then evaluate whether the current interest rate level, assuming it stable for a very prolonged period, will be enough to ensure the convergence of inflation to the target. The Committee emphasizes that it will remain vigilant, that future monetary policy steps can be adjusted and that it will not hesitate to resume the rate hiking cycle if appropriate.
The following members of the Committee voted for this decision: Gabriel Muricca Galípolo (Governor), Ailton de Aquino Santos, Diogo Abry Guillen, Gilneu Francisco Astolfi Vivan, Izabela Moreira Correa, Nilton José Schneider David, Paulo Picchetti, Renato Dias de Brito Gomes, and Rodrigo Alves Teixeira.
Table 1
Inflation projections in the reference scenario Year-over-year IPCA change (%)
1 Unless explicitly stated otherwise, this update considers changes since the June Copom meeting (271st meeting).
2 It corresponds to the rounded value of the average exchange rate observed over the ten working days ending on the last day of the week prior to the Copom meeting, according to the procedure adopted since the 258th meeting.
Meeting information
Date: July 29-30 2025
Place: BCB Headquarters’ meeting rooms on the 8th floor (7/29 and 7/30 on the morning) and 20th floor (7/30 on the afternoon) – Brasilia – DF – Brazil
Starting and ending times:
July 29: 10:07 AM – 11:37 AM; 2:17 PM – 5:51 PM
July 30: 10:10 AM – 11:13 AM; 2:37PM – 6:34 PM
In attendance:
Members of the Copom
Gabriel Muricca Galípolo – Governor
Ailton de Aquino Santos
Diogo Abry Guillen
Gilneu Francisco Astolfi Vivan
Izabela Moreira Correa
Nilton José Schneider David
Paulo Picchetti
Renato Dias de Brito Gomes
Rodrigo Alves Teixeira
Department Heads in charge of technical presentations (attending on July 29 and on the morning of July 30)
André de Oliveira Amante
Open Market Operations Department
Euler Pereira Gonçalves de Mello
Research Department (also attending on the afternoon of 7/30)
Fábio Martins Trajano de Arruda
Department of Banking Operations and Payments System
Luís Guilherme Siciliano Pontes
International Reserves Department
Marcelo Antonio Thomaz de Aragão
Department of International Affairs
Ricardo Sabbadini
Department of Economics
Other participants (attending on July 29 and on the morning of July 30)
Alexandre de Carvalho
Office of Economic Advisor
André Maurício Trindade da Rocha
Head of the Financial System Monitoring Department
Angelo Jose Mont Alverne Duarte
Head of Office of the Deputy Governor for Licensing and Resolution (attending on the mornings of 7/29 and 7/30)
Arnaldo José Giongo Galvão
Press Office Advisor
Cristiano de Oliveira Lopes Cozer
General Counsel
Edson Broxado de França Teixeira
Head of Office of the Deputy Governor for Supervision
Eduardo José Araújo Lima
Head of Office of the Deputy Governor for Economic Policy
Fernando Alberto G. Sampaio C. Rocha
Head of the Department of Statistics
Isabela Ribeiro Damaso Maia
Head of the Sustainability and International Portfolio Investors Unit (attending on the mornings of 7/29 and 7/30)
Julio Cesar Costa Pinto
Head of Office of the Governor
Laura Soledad Cutruffo Comparini
Deputy Head of the Department of Economics
Leonardo Martins Nogueira
Head of Office of the Deputy Governor for Monetary Policy
Marcos Ribeiro de Castro
Deputy Head of the Research Department
Mardilson Fernandes Queiroz
Head of the Financial System Regulation Department
Olavo Lins Romano Pereira
Deputy Head of the Department of International Affairs
Renata Modesto Barreto
Deputy Head of the Department of Banking Operations and Payments System
Ricardo da Costa Martinelli
Deputy Head of the International Reserves Department
Ricardo Eyer Harris
Head of Office of the Deputy Governor for Regulation
Ricardo Franco Moura
Head of the Prudential and Foreign Exchange Regulation Department
Rogerio Antonio Lucca
Executive Secretary
Simone Miranda Burello
Advisor in the Office of the Deputy Governor for Monetary Policy
Inflation expectations for 2025 and 2026 collected by the Focus survey remained above the inflation target and stand at 5.1% and 4.4%, respectively. Copom’s inflation projections for the first quarter of 2027, currently the relevant horizon for monetary policy, stand at 3.4% in the reference scenario (Table 1).
The risks to the inflation scenarios, both to the upside and to the downside, continue to be higher than usual. Among the upside risks for the inflation outlook and inflation expectations, it should be emphasized (i) a more prolonged period of de-anchoring of inflation expectations; (ii) a stronger-than-expected resilience of services inflation due to a more positive output gap; and (iii) a conjunction of internal and external economic policies with a stronger-than-expected inflationary impact, for example, through a persistently more depreciatedcurrency. Among the downside risks, it should be noted (i) a greater-than-projected deceleration of domestic economic activity, impacting the inflation scenario; (ii) a steeper global slowdown stemming from the trade shock and the scenario of heightened uncertainty; and (iii) a reduction in commodity prices with disinflationary effects.
The Committee has been closely monitoring the announcements on tariffs by the USA to Brazil, which reinforces its cautious stance in a scenario of heightened uncertainty. Moreover, it continues to monitor how the developments on the fiscal side impact monetary policy and financial assets. The current scenario continues to be marked by de-anchored inflation expectations, high inflation projections, resilience on economic activity and labormarket pressures. Ensuring the convergence of inflation to the target in an environment with de-anchored expectations requires a significantly contractionary monetary policy for a very prolonged period.
Copom decided to maintain the Selic rate at 15.00% p.a., and judges that this decision is consistent with the strategy for inflation convergence to a level around its target throughout the relevant horizon for monetary policy. Without compromising its fundamental objective of ensuring price stability, this decision also implies smoothing economic fluctuations and fostering full employment.
The current scenario, marked by heightened uncertainty, requires a cautious stance in monetary policy. If the expected scenario materializes, the Committee foresees a continuation of the interruption of the rate hiking cycle to examine its yet-to-be-seen cumulative impacts, and then evaluate whether the current interest rate level, assuming it stable for a very prolonged period, will be enough to ensure the convergence of inflation to the target. The Committee emphasizes that it will remain vigilant, that future monetary policy steps can be adjusted and that it will not hesitate to resume the rate hiking cycle if appropriate.
The following members of the Committee voted for this decision: Gabriel Muricca Galípolo (Governor), Ailton de Aquino Santos, Diogo Abry Guillen, Gilneu Francisco Astolfi Vivan, Izabela Moreira Correa, Nilton José Schneider David, Paulo Picchetti, Renato Dias de Brito Gomes, and Rodrigo Alves Teixeira.
Table 1
Inflation projections in the reference scenario Year-over-year IPCA change (%)
In the reference scenario, the interest rate path is extracted from the Focus survey, and the exchange rate starts at USD/BRL 5.55 and evolves according to the purchasing power parity (PPP). The Committee assumes that oil prices follow approximately the futures market curve for the following six months and then start increasing 2% per year onwards. Moreover, the energy tariff flag is assumed to be “green” in December of the years 2025 and 2026. The value for the exchange rate was obtained according to the usual procedure.
Note: This press release represents the Copom’s best effort to provide an English version of its policy statement. In case of any inconsistency, the original version in Portuguese prevails.
Is BRICScurrency cooperation about immediate de-dollarization or long-term financial sovereignty? The answer is that BRICS cooperation may include reducing long-term dependence on the dollar as a means of exchange. The dollar is involved in more than half of all trade and 80 percent of all foreign exchange transactions. BRICScurrency cooperation aims to gradually reduce the group’s dollar dependency, but challenges remain.
The BRICS concept came about not because the dollar is unsuitable as a means of exchange or unit of account, but rather because of the use of the dollar by Washington as a weapon. As I note in my book, Inflated: Money, Debt and the American Dream, the special role of the dollar in U.S.finance allows the U.S. government to impose harsh compliance and reporting requirements on foreign nationals and institutions. The U.S. is an arbitrary hegemon and does not follow reciprocity with other countries.
The global role of the dollar is an anomaly, the byproduct of two world wars had left the other antagonists broke by the time the Bretton Woods Agreement was signed in July 1944.
The fact that the dollar continues to trade strongly versus other currencies reflects the reality that as the main means of exchange globally, the dollar cannot be easily replaced. One reason for this continued support for the dollar is that the trade in petroleum and other commodities is so large that it requires an equally large currency to accommodate it. Also, neither the Europeans nor the Japanese, the only two possible alternatives, are willing to risk the external deficits or inflation that the U.S. suffers as the host for the global currency.
Smyth and many other observers see the creation of the SGE in 2002 as the return of gold to the international monetary system. But while gold is growing in importance as a reserve asset for many countries, it does not mean that the role of the dollar as a global means of exchange or unit of account is about to change.
The dollar will remain the dominant asset. And even then, displacing the dollar will require a major change in the international monetary system, a change that is already underway.
[from NBK Group’s Economic Research Department, 21 November, 2024]
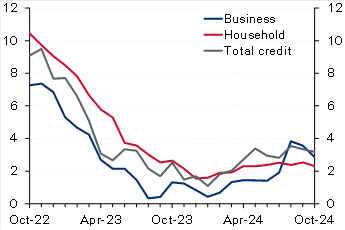
Kuwait: Solid credit growth in October driven by household credit. Domestic credit increased by a solid 0.4% in October, driving up YTD growth to 2.9% (3.2% y/y). The recovery in household credit continued, with growth in October at a solid 0.5%, resulting in a YTD increase of 2.4%. While y/y growth in household credit remains a limited 2.3%, annualized growth over the past four months is a stronger 4.7%. Businesscredit inched up by 0.2% in October, pushing YTD growth to 3.6% (2.9% y/y). Industry and trade drove businesscredit growth in October while construction and trade are the fastest growing YTD at 17% and 8%, respectively. In contrast, the oil/gas sector continued its downtrend, deepening the YTD decrease to 13%. Excluding the oil/gas sector, growth in business credit would increase to a relatively good 5% YTD. Looking ahead, the last couple of months of the year (especially December) are usually the weakest for businesscredit, likely due to increased repayments and write-offs, but it will not be surprising if the recovery in household credit is generally sustained, especially given the commencement of the interest rate-cutting cycle. Meanwhile, driven by a plunge in the volatile public-institution deposits, resident deposits decreased in October, resulting in YTD growth of 2.4% (4.2% y/y). Private-sectordeposits inched up in October driving up YTD growth to 4.5% compared with 10% for government deposits while public-institution deposits are a big drag (-14%). Within private-sector KD deposits, CASA showed further signs of stabilization as there was no decrease for the third straight month while the YTDdrawdown is a limited 1%.
Chart 1: Kuwait credit growth
(% y/y)
Source: Central Bank of Kuwait (CBK)
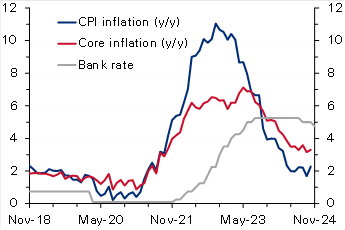
Chart 2: UK inflation
(%)
Source: Haver
Egypt: IMF concludes mission for fourth review, sees external risks. The IMF concluded its visit to Egypt after spending close to 2 weeks, holding several in-person meetings with the Egyptian authorities, private sector, and other stakeholders. The IMF released a statement mentioning that the current ongoing geopolitical tensions in the region in addition to an increasing number of refugees have affected the external sector (Suez Canal receipts down by 70%) and put severe pressure on the fiscal front. The Fund acknowledged the Central Bank of Egypt’s commitment to unify the exchange rate, maintain the flexible exchange rate regime, and keep inflation on a firm downward trend over the medium term by substantially tightening monetary policy. It also highlighted that continued policy discipline was also a key to containing fiscal risks, especially those related to the energy sector. The Fund, as always, re-iterated the need for promoting the private sector mainly through an enhanced tax system and accelerating divestment plans of the state firms. Finally, it also said that the discussions would continue over the coming days to finalize the agreement on the remaining policies and reform plans. However, the release did not provide any clear hints about the conclusion on the government’s earlier request to push the timeline of some of the subsidy moves.
Oman: IMF completes article IV with a strong outlook for the economy in 2025. Oman’s economy continued to expand with growth reaching 1.9% in the first half of 2024 (versus 1.2% in 2023), despite being weighed down by OPEC+ mandated oil production cuts as non-oil GDP grew a stronger 3.8% y/y in H1 (versus 1.8% in 2023). The fiscal and current account balances remain in a comfortable situation evident by a decline in public sectordebt and the recent rating upgrade to investment grade. The Fund expects Oman’s economic growth to see a strong rebound in 2025, supported by higher oil production. It also believes that fiscal and current account balances will remain in surplus but at lower levels. Key risks to the outlook stem from oil price volatility and intensifying geopolitical tensions. The IMF also mentioned that further efforts are needed to raise nonhydrocarbon revenues through more tax policy measures and the phasing out of untargeted subsidies which should help in freeing up resources to finance growth under the government’s diversification agenda.
UK: Inflation rises more than forecast, reinforcing BoE’s caution on rate cuts. UKCPIinflation increased to 2.3% y/y in October from 1.7% the previous month, slightly above the market and the Bank of England’s forecast of 2.2%. On a monthly basis too, inflation rose to 0.6%, a seven-month high, from September’s no change. The steep rise was mainly driven by an almost 10% rise in the household energy price cap effective from October. Core inflation also accelerated to 3.3% y/y (0.4% m/m) from 3.2% (0.1% m/m). While goods prices continued to fall (-0.3% y/y), service prices rose at a faster rate of 5% from 4.9%. Recently, the Bank of England had cautioned about inflation quickening next year (projecting a peak rate of 2.8% in Q3 2025), citing the impact of higher insurance contributions and rising minimum wages as outlined in the latest government budget. Therefore, with inflation rising above forecast, the bank will likely slow the pace of monetary easing after delivering two interest rate cuts of 25 bps earlier, with markets now seeing only two additional cuts by the end of 2025.
Eurozone: ECB warns of fiscal and growth risks in its latest Financial Stability Review [archived PDF]. In its most recent Financial Stability Review (November) [archived PDF], the European Central Bank warned that elevated debt and fiscal deficit levels and anemic long-term growth could expose sovereign debt vulnerabilities in the region, stoking concerns of a repeat of the 2011 sovereign debt crisis. Maturing debt being rolled over at much higher borrowing rates raising debt service costs poses risks to countries with little fiscal space and leaves certain governments exposed to market fluctuations. The bank also emphasized the risks of high equity valuations, low liquidity and a greater concentration of exposure among non-banks. Moreover, it sees current geopolitical uncertainties and the possibility of more trade tensions as heightening risks. The Eurozone’s current government debt-to-GDP ratio stands at 88%, but the underlying data suggest a much more precarious situation with Greece, Italy, and France’s ratios at 164%, 137% and 112%. Recently, concerns about France’s high fiscal deficit (around 5.9% of GDP) and elevated debt levels saw yields on the country’s bonds rise steeply, widening the spread gap with Germanbonds to the highest level in over a decade.
Disclaimer: While every care has been taken in preparing this publication, National Bank of Kuwait accepts no liability whatsoever for any direct or consequential losses arising from its use. Daily Economic Update is distributed on a complimentary and discretionary basis to NBK clients and associates. This report and previous issues can be found in the “News & Insight / Economic Reports” section of the National Bank of Kuwait’s web site. Please visit their web site, nbk.com, for other bank publications.