Fourth District contacts reported a slight increase in overall business activity in recent weeks and expected activity to rise modestly in the months ahead. Consumer spending was flat, with retailers noting continued affordability concerns among consumers. Manufacturers also reported flat demand for goods, citing trade policy uncertainty as the main driver. Demand for professional and business services grew moderately, albeit at a slower pace than in the past three reporting periods. Contacts generally reported flat employment levels and modest wage pressures. Nonlabor cost pressures remained robust, and selling prices continued to grow modestly.
Ever since new tariffs were enacted in early 2025, a key policy question has been what is the extent to which businesses will pass tariff costs through to prices, and when? The effects of a tariff are rarely straightforward, given, among other things, competitive dynamics and the challenges of implementation, but the historically large and changing nature of these tariffs have created additional levels of uncertainty over the effects.
In uncertain times, anecdotal evidence from businesses can be especially insightful. We are learning how businesses are reacting to tariffs through the Richmond Fed’s business surveys as well as through hundreds of one-on-one conversations with Fifth District businesses since the start of 2025.
These conversations showcase that navigating tariffs is a complex and sometimes protracted process for firms, particularly when there is uncertainty. Firms describe several reasons they may not have experienced the full impact of proposed tariffs yet (even when goods and countries they deal with are subject to them), as well as reasons that even when they have incurred tariff-related cost increases, there can be a delayed impact on pricing decisions.
Reasons Firms May Not Have Incurred Tariffs Yet
Business contacts describe several strategies or circumstances that can delay or reduce the tariffs on inputs or other imported items. These include the following:
Delayed ordering. In response to announced tariffs, many firms ran down existing inventories or ran inventories lean in hopes that tariffs would become lower. For example, a national retailer said everyone was “delaying all we can delay in hopes we get more clarity on trade deals” and reported meeting with procurement teams multiple times per week to discuss ports and ship capacity, evolving tariffs, and inventories to keep goods flowing and prices as low as possible. One port said they have a crane waiting to be shipped but can’t do so now due to the tariffcost.
Cost-sharing.Vendor relationships are often long term, and many firms report partnering with suppliers and customers to share costs. When tariffs first rolled out, multiple firms (a beverage distributer, supply chainlogistics company) anticipated a “rule of thirds” where the cost was split evenly among the supplier, the importer, and the customer. A national retailer reported being large enough to force suppliers to bear much of the cost, though it varied by relationship and item. Interestingly, firms also reported that cost-sharing is not necessarily a permanent solution: A steeldistributer said that with the second round of tariffs announced in June, “The ‘kumbaya’ of cost-sharing was likely to come to an end.” Similarly, a fabricmanufacturer said that upon an announced trade deal with Vietnam that took tariffs from 10 percent to 20 percent, suppliers took a new stand on cost sharing: “Most vendors said you’re on your own” for the second 10 percent, and one even clawed back cost-sharing from the first round.
Transit time. It takes up to six weeks for container ships to arrive to the East Coast from China, so even if firms are ordering goods, there is a natural delay when the tariff is incurred. Shipping time in a world of rapidly changing tariff proposals add to uncertainty around tariffcosts.
Tariff implementation delays.Richmond FedeconomistMarina Azzimonti has found that a variety of tariff implementation delays help explain why actual tariffs as of May 2025 were much lower than expected. These factors include legacy exemptions and delays in customs system updates. Azzimonti also finds that a small percentage is explained by countries substituting away from high-tariff countries. For example, one national retailer we spoke with was in the process of dropping 10 percent of products sourced from China. Whether a company can change sourcing varies dramatically by type of firm and product.
As our monthly business surveys have found, many firms report deploying more than one strategy to delay tariffs. Notably, many of these delays are only temporary.
Reasons Tariffs May Have a Delayed Impact on Prices
Even when firms have incurred tariffs, they give several reasons why tariffs may not be immediately reflected in the prices they charge for their products. These include the following:
Waiting for tariff policy to clarify. Higher prices could reduce demand for goods and services and/or lead firms to lose market share, so many firms said they are hesitant to increase prices until they’re sure tariffs will remain in place. For example, a large national retailer said if tariffs are finalized at a sufficiently low level, they’ll absorb what they’ve incurred to date, but if high tariffs stick, they’ll have to raise prices. A steel fabricator for industrial equipment described being reluctant to raise prices on the 10 percent cost increases they’d seen thus far but would have to raise prices should the increases reach 12 to 13 percent. A grocery store chain was reluctant to raise prices and instead might reduce margins, which had recovered in recent years, to maintain their customer base. Some firms explicitly noted a strategy to both raise prices over time and pursue efficiency gains to cut costs and completely restore margins within a year or two.
Elasticity testing. Firms reported testing across goods whether consumers will accept price increases. A furnituremanufacturer said he’s seen competitors pass along just 5 percentage points of the tariffs at a time so it isn’t such a huge shock to customers, though in that sector, “We all end in the same place which is the customer bearing most of it.” A national retailer said most firms are doing a version of stair-stepping tariffs through, e.g., raising prices a small amount once or twice to see if consumer demand holds, and if so, trying again two months later. This retailer said prices were going up very marginally in early summer, would increase more in July and August, and would be up by 3 to 5 percent by the end of Q4 and into 2026. Another national retailer said they would start testing the extent to which demand falls with price increases, e.g., when the first items that were subject to tariffs—in this case back to school items—hit shelves in late July.
Blind margin. Some firms reported attempting to pass through cost in less noticeable ways. While any price increase to consumers will be captured in measures of aggregate inflation, the fact that price increases may occur on non-tariffedgoods might make it difficult to directly relate price increases to tariffs. An outdoor goodsretailer said, “Unless it’s a branded item where everyone knows the price, if something goes for $18, it can also go for $19.” A national retailer plans to print new shelf labels with updated pricing, which will be less noticeable for consumers compared to multiple new price stickers layered on top. This takes time (akin to a textbook “menu cost” in economics), so it will not be reflected in prices until July and August. A grocery store said their goal was to increase average prices across the store but focus on less visible prices.
Selling out of preexisting inventory: Many firms noted they still have productioninventory from before tariffs were announced, so they do not need to raise prices as long as they still sell these lower cost goods. A national retailer noted they have at least 25 weeks of inventory on hand for most importedproducts. A firm that produces grocery items said they will decide how much to raise prices as they get closer to selling tariff-affected products. Similarly, retailers order seasonal items quarters in advance. Many were receiving items for fall and winter when the new tariffs were going into effect in the spring. They paid the tariff then, but we won’t see the price increase until those items hit the shelves in the fall or winter. One retailer speculated that seasonal décor items will look the most like a one-time increase.
Pre-established prices. Many firms face infrequent pricing due to factors like annual contracts or pre-sales. For example, a dealer of farm equipment gets half its sales through incentivized pre-sales to lock in demand and smooth around crop cycles. They noted that while it would be difficult to retroactively ask those customers to pay for part of the tariff, they will pass tariffs directly through on spare parts. A steel fabricator for industrial equipment has a contract for steel through Q3, so they haven’t been impacted yet by price increases. However, they will face new costs once that contract expires.
In general, compared to small firms, large firms have more ability to negotiate with vendors, temporarily absorb costs, burn cash, wait for strategic opportunity, and test things out. This matters because large firms often lead pricing behavior among firms, so these strategic choices may influence the response of inflation to tariffs more generally. Even within firm size, one often hears that negotiations on price vary considerably by relationship and item.
Conclusion
A key question surrounding tariffs is whether any effects on inflation will resemble a short-lived price increase—as in the simplest textbook model of tariffs—or a more sustained increase to inflation that may warrant tighter Fedmonetary policy. When asked in May what will determine the answer, Fed ChairJerome Powellcited three factors [archived PDF]: 1) the size of the tariff effects; 2) how long it takes to work their way through to prices; and 3) whether inflation expectations remain anchored. The insights shared above suggest the process from proposed tariffs to the prices set by firms is far from instantaneous or clear-cut, particularly when tariff policy is changing.
Sensing from businesses suggests that the impact of tariffs on their price-setting [archived PDF] has been lagged, but it is starting to play out. Nonetheless, it remains highly uncertain how tariffs will impact consumerinflation. The discussion above makes clear that firms are nimble and innovative in the face of challenge, and they are concerned about losing customers in the current environment, particularly consumer-facing firms. We will continue to learn from our business contacts and share their insights.
As programmable payments become more common, an old-school budgeting idea is making a comeback: earmarking. At its core, earmarking just means setting money aside for a specific purpose—like rent, payroll, or taxes—so it’s only used for that. It’s a simple concept, but when combined with automation, it could be the budgeting upgrade many people and businesses have been waiting for.
The word “earmark” dates to the 15th century, when farmers would notch their animals’ ears to show ownership. Over time, it came to mean setting something aside for a specific use. In personal finance, this idea lives on in the envelope system, where people divide up cash into labeled envelopes—groceries, bills, savings—and stick to those limits. It works, but let’s face it: handling cash envelopes isn’t exactly practical in a digital-first world.
That’s where programmable payments come in. These are payments that happen automatically based on rules you set. Instead of stuffing envelopes, you set up digital “buckets” for your money. Maybe 20 percent of every gig workpayment goes straight to a tax account or your weekly paycheck splits into rent, groceries, and savings buckets automatically.
Through banking apps, digital wallets, or budgeting platforms, consumers choose or create spending categories and assign rules—like percentages, spending limits, or triggers. For example, you can link your checking account to a programmable wallet that auto-transfers money into savings or investments accounts on payday, or prevents spending on dining once you hit your monthly cap.
It’s like having a personal money assistant organizing your finances, paying your bills, and keeping you on budget without you having to think about it. For businesses, this brings new efficiency to managing payroll, vendorpayments, and escrow accounts.
The upside of earmarking with programmable payments is clear: automation takes the work out of budgeting, real-time visibility helps track your money, and flexible rules let you customize how it all works. It’s also useful in more regulated settings like distributing aid or managing shared accounts because it adds accountability.
But if the rules are too rigid or confusing, that can frustrate users. Businesses may need to integrate programmable features with legacy systems, which takes time and money. And over reliance on automation poses risks—glitches, errors, or outdated settings can cause missed payments or unintended consequences.
Still, earmarking with programmable payments is a smart, modern take on a tried-and-true budgeting technique. It may not be right for every situation—and some apps already do this behind the scenes—but used intentionally, it can bring clarity, control, and purpose to the way money flows. In a complex financial world, that’s something both individuals and experts can benefit from.
In October, I wrote about the potential for standards to make business-to-business payments more efficient. Today, let’s talk about standards again, this time for money transfer businesses and the state regulations covering them.
For new and established money transfer businesses and for state regulators, the hodgepodge of state regulations creates headaches. To do business everywhere in the United States, money transfer businesses must register separately in each state and US territory and meet license requirements that can vary from state to state. They can face multiple state examinations, also with different requirements, simultaneously (and annually). During examinations, regulators review operations, financial condition, management, and compliance with anti-money laundering laws.
Fortunately, many states have acted to address this confusing and inefficient situation by adopting the Model Money Transmission Modernization Act (MTMA) [archived PDF], sample legislation developed by the Conference of State Bank Supervisors to establish nationwide standards and requirements for licensed money transmitters. Fourteen states have adopted some version of the MTMA: Arizona, Arkansas, Georgia, Hawaii, Indiana, Iowa, Minnesota, Nevada, New Hampshire, North Dakota, South Dakota, Tennessee, Texas, and West Virginia. In my home state of Massachusetts, the legislature’s Joint Committee on Financial Services heard testimony on a version of this bill just last month. For traditional money transmitters and new fintech entrants, the MTMA aims to reduce the substantive and technical differences among the various state laws and regulations. This kind of change has the potential to reduce compliance burdens, encourage innovation, and remove barriers to entry for new market participants.
The MTMA is important given the prodigious growth in person-to-person, or P2P, payments via apps. Among all USconsumers, half of P2P payments were sent using noncash methods in 2022, up from less than 30 percent in 2020 (see the chart). From Massachusetts alone, money transmitters sent $31 billion in 2022, according to the state’s Division of Banks.
Half of P2P payments were made electronically in 2022.
The MTMA also has the potential to create efficiencies for state supervisors. For example, the Conference of State Bank Supervisors (CSBS) has facilitated a collaborative exam program for nationwide payments and cryptocurrency firms to undergo one exam, each facilitated by one state overseeing a group of examiners sourced from across the country. According to the CSBS, transmitters in more than 40 states that have laws addressing core precepts can benefit from the streamlined exams.
The MTMA is another example showing that standards create efficiencies that are good for businesses, good for regulators and, by extension, good for consumers.
Complaint alleges company violated FTC Act and ROSCA with false promises targeting consumers living paycheck-to-paycheck and by failing to deliver cash advances as advertised
The Federal Trade Commission is taking action against personal financeapp provider Brigit, alleging that its promises of “instant” cash advances of up to $250 for people living paycheck-to-paycheck were deceptive and that the company locked consumers into a $9.99 monthly membership they couldn’t cancel.
Brigit, also known as Bridge It, Inc., has agreed to settle the FTC’s charges, resulting in a proposed court order that would require the company to pay $18 million in consumer refunds, stop its deceptive marketing promises, and end tactics that prevented customers from cancelling.
“Brigit trapped those consumers least able to afford it into monthly membership plans they struggled to escape from,” said Sam Levine, Director of the FTC’s Bureau of Consumer Protection. “Companies that offer cash advances and other alternative financial products have to play by the same rules as other businesses or face potential action by the FTC.”
The FTC’s complaint, however, charges that consumers were rarely able to get an advance for the promised $250, and in many cases, consumers were not able to receive a cash advance at all. Despite Brigit’s promises that advances would be available with “free instant transfers,” the complaint notes that the company began charging consumers a 99-cent fee for an instant transfer. Consumers who did not pay the fee had to wait up to three business days for their advances.
In addition, the complaint charges that while Brigit claimed to offer “non-recourse” advances with no fees or interest, the company prevented consumers who had an open advance from cancelling their subscription and continued to withdraw $9.99 monthly from their bank account until the advance was paid off. Such monthly charges created significant additional hardship for consumers already struggling to pay off a cash advance.
Even when consumers without an open cash advance attempted to cancel the paid subscription, the complaint charges that the company employed dark patterns—manipulative design tricks—to create a confusing and misleading cancellation process that prevented consumers from cancelling their subscriptions, instead of offering a simple mechanism to cancel, as required by the Restore Online Shoppers’ Confidence Act (ROSCA) [archived PDF].
The proposed settlement order [archived PDF], which must be approved by a federal judge before it can go into effect, would require Brigit to pay $18 million to the FTC to be used to provide refunds to consumers. In addition, the order would prohibit Brigit from misleading consumers about how much money is available through their advances, how fast the money would be available, any fees associated with delivery, and consumers’ ability to cancel their service. The order would also require the company to make clear disclosures about its subscription products and provide a simple mechanism for consumers to cancel.
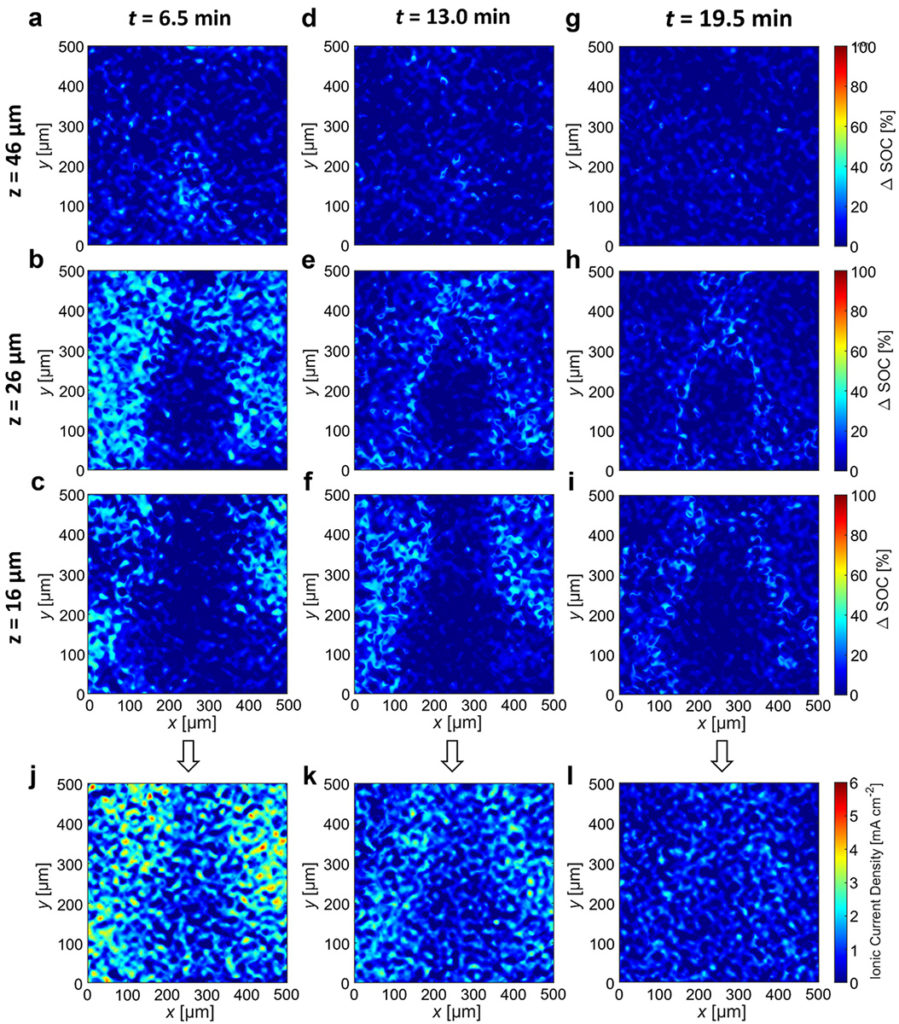
Scientists have gained new insight into why thermal runaway, while rare, could cause a resting battery to overheat and catch fire.
In order to better understand how a resting battery might undergo thermal runaway after fast charging, scientists are using a technique called “operando X-ray microtomography” to measure changes in the state of charge at the particle level inside a lithium-ion battery after it’s been charged.
Their work shows for the first time that it is possible to directly measure current inside a resting battery even when the external current measurement is zero.
Much more work is needed before the findings can be used to develop improved safety protocols.
How likely would an electric vehiclebattery self-combust and explode? The chances of that happening are actually pretty slim: Some analysts say that gasolinevehicles are nearly 30 times more likely to catch fire than electric vehicles. But recent news of EVs catching fire while parked have left many consumers – and researchers – scratching their heads over how these rare events could possibly happen.
“What’s exciting about this work is that Nitash Balsara’s group isn’t just looking at images – They’re using the images to determine how batteries work and change in a time-dependent way. This study is a culmination of many years of work,” said co-author Dilworth Y. Parkinson, staff scientist and deputy for photonscience operations at Berkeley Lab’s Advanced Light Source (ALS).
The team is also the first to measure ionic currents at the particle level inside the batteryelectrode.
“What happens after fast charging when the battery is at rest is a little mysterious,” Balsara said. But the method used for the new study revealed important clues.
Experiments led by first author Alec S. Ho at the ALS show that when graphite is “fully lithiated” or fully charged, it expands a tiny bit, about a 10% change in volume – and that current in the battery at the particle level could be determined by tracking the local lithiation in the electrode. (Ho recently completed his Ph.D. in the Balsara group at UC Berkeley.)
The researchers also learned that the measured internal currents decreased substantially in about 20 minutes. Much more work is needed before their approach can be used to develop improved safety protocols.
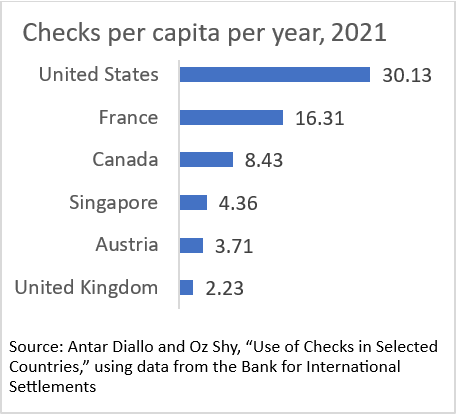
Among the 20 countries that reported the number and value of these payments to the BIS, the United States had by far the highest per capita use of checks per year in 2021: 30 checks. Only six countries reported more than two per capita (chart below), another 12 between zero and two. Belgium and South Africa reported zero.
Given the high per capita use in the United States, it makes sense that our year-over-year decline from 2012 has been slower than that for other countries. The per-year decline in the number of U.S.checks from 2012 to 2021 was slower than the decline for all the other high-use countries listed in the chart. The United States was down 6.7 percent per year from 2012 to 2021, compared to down 8.8 percent per year for Canada at the slow end and down 17.4 percent per year for Austria at the quick end.
No way around it: we love our checks, and our response to innovation has been tepid compared to that of other countries.
Conflict, supply disruption, rising prices, and shortages are all impacting food supplies globally. Just as we are nearing some form of recovery from the pandemic, we are now facing another global challenge in the form of a food crisis – and it’s likely to get worse.
This is a regional problem that cannot be solved by individual economies acting on their own. It must be looked at with a wider lens, such as through bodies, like APEC, that promote regional economic cooperation. APEC members acknowledge that all areas of the agri-food value chain are interdependent and that there is a need for a whole-system approach.
In my capacity as the Chair of APEC’s Small and Medium Enterprises Working Group, I’d like to stress the importance of the latter: inclusivity and small business. MSMEs account for over 97 percent of all business in APECeconomies and employ over half of the workforce. Any strategy for reducing food wastage will have to involve the wholesale participation of the region’s smaller businesses.
This is easier written than done. For one thing, fit-for-purpose data is scarce. No APECeconomy has food waste data that is specific to MSMEs. And while all have policies and measures to address the problem of food waste, there are no large-scale direct MSME–food waste reduction targets, policies or plans. Few have tried to reduce MSMEfood waste in the retail food and food service industries. Supermarkets, food storage facilities or warehouses in many APECeconomies aren’t required to donate excesses.
Most entrepreneurs aren’t even aware of the problem, or underestimate its true cost. Those who do understand have limited options or capital, and are unable to find cost-effective solutions to create value out of food waste, and face problems with logistics and transportation. On top of this, there are few to no regulatory frameworks to guide them. From a technology perspective, a majority of APECeconomies utilize modern technologies, including mobile applications, to reduce or manage MSMEfood waste/surplus food, but these modern technologies are used only by large companies in big cities.
Amid these challenges are an abundance of opportunities to help MSMEs reduce food waste. Training, policies and guidelines can aid them in improving profits by reducing costs and increasing the value added of food. They can reduce their carbon footprint, which enhances consumerdemand, and divert waste to new products or bioenergy.
A November study by the APEC Small and Medium Enterprises Working Group presents case studies, identifies the best available data on food waste for MSMEs, and identifies several best practices for economies in dealing with food waste through MSME policy.
In one section, the study’s authors analyze a case study of a successful MSME, and identify four key factors contributing to its successful reduction of food waste: 1) creating a network of people — e.g., a community surrounding a farm; 2) using innovation and technology to facilitate farming and save time; 3) producing knowledge and providing it through several channels — e.g., a learning and training center, friendly guide books; and 4) considering the environment at every step of the process.
“We’ve had a time of red-hot housing market all over the country… Shelter inflation is going to remain high for some time. We’re looking for it to come down, but it’s not exactly clear when that will happen. Hope for the best, plan for the worst.”
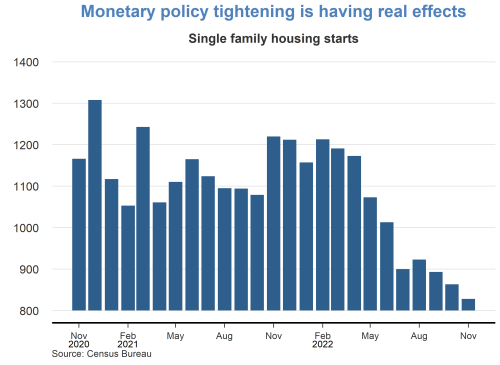
The rapid run-up of shelter costs—both house prices and rents—during the recovery from the pandemic has raised questions about how inflation pressures might affect housing affordability. Since March 2022, the Federal Reserve has rapidly lifted its federal funds rate target from near zero to over 4%, and policymakers have signaled that they are open to keeping the monetary policy stance sufficiently restrictive to return inflation to the longer-run goal of 2% on average. The tightened financial conditions following those policy changes, especially the surge in mortgageinterest rates, have helped cool house price growth. However, rentinflation remains elevated.
This Economic Letter examines the effectiveness of monetary policy tightening for reducing rentinflation. We estimate that, during the period from 1988 to 2019, a policy tightening equivalent to a 1 percentage point increase in the federal funds rate can reduce rentinflation—measured by 12-month percentage changes in the personal consumption expenditures (PCE)housing price index—by about 3.2 percentage points, but the full impact takes about 2½ years to materialize. Based on housing costs’ share in total PCE, this translates to a reduction in headline PCEinflation of about 0.5 percentage point over the same time horizon.
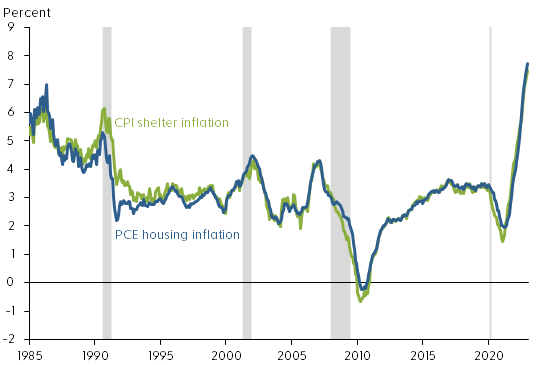
Rentinflation also accelerated during the pandemic period. Figure 1 shows that rentinflation—measured using 12-month changes in the PCEhousing price index and including rents for tenant-occupied housing and imputed rents for owner-occupied housing—rose from a low point of about 2% in early 2021 to 7.7% by December 2022, the highest level since 1986. During the same period, rentinflation measured by 12-month changes in the shelter component of the consumer price index (CPI) experienced a similar increase. Thus, following the tightening of monetary policy, house price growth has slowed but rentinflation continues to rise.
Economic theory suggests that some common forces such as changes in housing demand can drive both rents and house prices. For example, the expansion of remote work since the COVID-19 pandemic has increased demand for housing, raising both house prices and rents (Kmetz, Mondragon, and Wieland 2022). To the extent that the stream of current and future rents reflects the fundamental value of a house, house prices can be a leading indicator of future rentinflation (Lansing, Oliveira, and Shapiro 2022). Thus, monetary policy can affect both house prices and rents by cooling housing demand.
Housing demand responds to changes in financial conditions, such as increases in mortgageinterest rates. However, theory suggests that house prices are more sensitive than rental prices to changes in financial conditions, because home purchases typically require longer-term mortgage financing. In addition, unlike rents, house prices can be partly driven by investor sentiments or beliefs, which explains the observed larger swings in house prices than in rents over business cycles (Dong et al. 2022). Long-term rental contracts can also contribute to slow adjustments in rentinflation.
Rentinflation is an important contributor to overall inflation because housing costs are an important component of total consumption expenditures. On average, housing expenditures represent about 15% of total PCE and 25% of the services component of PCE. In CPI, shelter costs represent an even larger share, accounting for about 30% of total consumption of all urban consumers and about 40% of core consumption expenditures excluding volatile food and energy components.
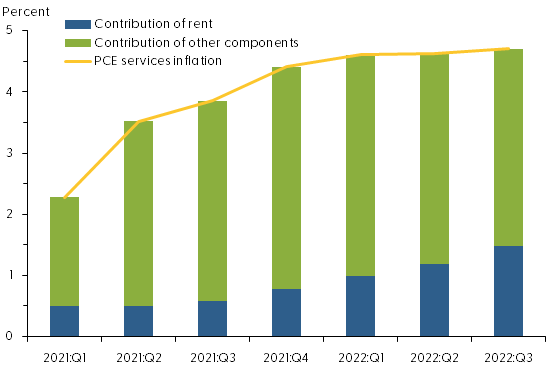
The contribution of rentinflation to overall PCEinflation has increased since early 2021. As Figure 2 shows, in the first quarter of 2021, rentinflation accounted for about 22% of the four-quarter change in the PCE services price index, excluding energy: 0.5 of the 2.3 percentage points increase in service prices was attributable to rentinflation. By the third quarter of 2022, the contribution of rentinflation had climbed to about one-third, or 1.5 of the 4.7 percentage point increase in service prices.
Figure 2: Rising contribution of rent inflation to services inflation
For our analysis, we use a measure of monetary policy surprises constructed by Bauer and Swanson (2022). Their measure focuses on high-frequency changes in financial marketindicators within a short period surrounding the Federal Open Market Committee (FOMC) policy announcements. If the public fully anticipates a policy change, then the financial market would not react to new policy announcements. However, if the market does react to an announcement, then the policy change must contain a surprise element. Thus, changes in financial marketindicators, such as the price of Eurodollar futures, in a narrow window around an FOMC announcement can capture policy surprises. In practice, however, the data constructed this way are not complete surprises because they can be predicted by some macro and financial variables shortly before FOMC announcements. We follow the approach of Bauer and Swanson (2022) to purge the influences of those macro and financial variables from the measure of policy surprises. We use the resulting quarterly time series to measure monetary policy shocks, with a sample period from 1988 to 2019.
We then use a local projections model—a statistical tool proposed by Jordà (2005)—to project how rentinflation responds over time to a tightening of monetary policy equivalent to a 1 percentage point unanticipated increase in the federal funds rate in a given quarter. The model takes into account how monetary policy shocks interact with other macroeconomic variables, including lags of rentinflation, real GDP growth, and core PCEinflation.
In the final step, we compute the responses of rentinflation relative to its preshock level over a period up to 20 quarters after the initial increase in the federal funds rate.
Gradual impact of policy tightening on rent inflation
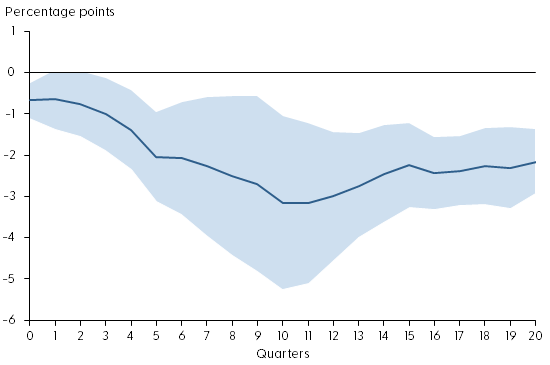
Figure 3 shows the response of rentinflation during the first 20 quarters after an unanticipated tightening of monetary policy (solid blue line). The shaded area shows the confidence band, indicating the statistical uncertainty in estimating the responses. Under the assumption that the model is correct, the shaded area contains the actual value of the rentinflation responses to the monetary policy shock roughly two-thirds of the time. The policy shock is normalized such that it is equivalent to a 1 percentage point unanticipated increase in the federal funds rate.
Figure 3: Response of rent inflation to monetary policy tightening
Source: Bureau of Economic Analysis, Bauer and Swanson (2022), and authors’ calculations. Note: Response of rentinflation to a monetary policy shock equivalent to a 1 percentage point surprise increase in the federal funds rate. Shaded region shows 68% confidence band around the estimate.
The figure shows that monetary policy tightening has significant and gradual effects on rentinflation. On impact, a 1 percentage point increase in the federal funds rate reduces rentinflation about 0.6 percentage point relative to its preshock level. Over time, rentinflation declines gradually, falling about 3.2 percentage points in the 10 quarters following the impact. The slow adjustment in rentinflation partly reflects the stickiness in nominal rents due to long-term rental contracts. Since housing expenditures account for about 15% of total PCE, this estimate translates to a reduction in headline PCEinflation of about 0.5 percentage point, stemming from the decline in rentinflation over a period of 2½ years.
The rent component of PCE is measured based on average rents, including those locked in long-term rental contracts, which are slow to adjust to changes in economic and financial conditions. Rents on new leases, however, are more flexible. For example, the 12-month growth in Zillow’s observed rent index, which measures changes in asking rents on new leases, has slowed significantly since March 2022 (see Figure 4). Asking rents are typically a leading indicator of future average rents. Thus, the slowdown in asking rent growth could portend lower future rentinflation.
Figure 4: Year-over-year observed rent growth starting to slow
Source: Zillow and Haver Analytics. Note: Twelve-month percentage changes in Zillow’s observed rent index. Gray shading indicates NBER recession dates.
Conclusion
Rents are an important component of consumer expenditures. Recent surges in rentinflation have led to concerns that overall inflation might stay persistently high despite tightening of monetary policy. We present evidence that monetary policy tightening is effective for reducing rentinflation, although the full impact takes time to materialize. A policy tightening equivalent to a 1 percentage point increase in the federal funds rate can reduce rentinflation up to 3.2 percentage points over the course of 2½ years. This translates to a maximum reduction in headline PCEinflation of about 0.5 percentage point over the same time horizon. Although average rents are slow to respond to policy changes, growth of asking rents on new leases has started to slow following recent monetary policy tightening. Our finding suggests that this tightening will gradually bring rentinflation down over time, thereby helping to reduce overall inflation.
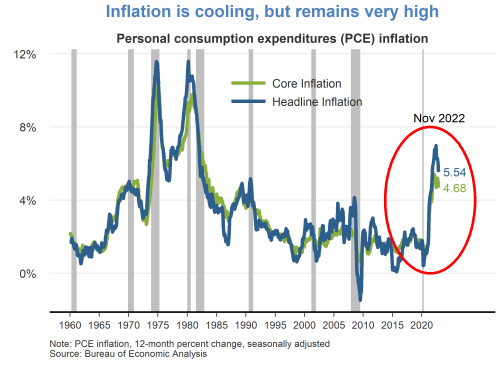
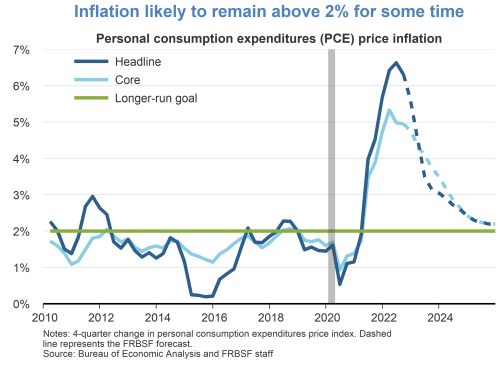
While continuing to cool over the last several months, 12-month inflation remains at historically high levels. The headline personal consumption expenditures (PCE) price index rose 5.5% in November 2022 from a year earlier. This marks a decline in inflation to a level last observed in October 2021, but still well above the Fed’s longer-run goal of 2%. A portion of the inflation moderation is attributable to recent declines in energy prices. Core PCE inflation, which removes food and energy prices, has shown less easing.
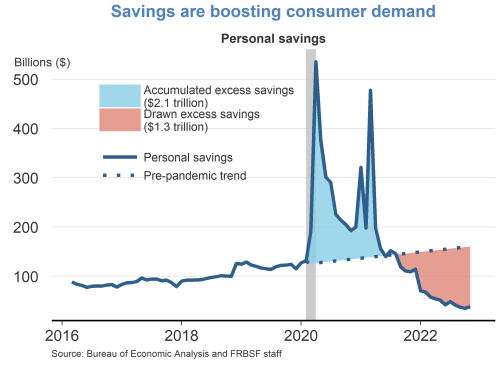
Owing to fiscal relief efforts and lower household spending over the course of the pandemic, consumers accumulated over $2 trillion dollars in excess savings, based on pre-pandemic trends. Since then, consumers have drawn down over half of this excess savings which has helped support recent growth in personal consumption expenditures. A considerable amount of accumulated savings remains for some consumers to support spending in 2023.
In the wake of the pandemic, consumer spending patterns shifted away from services towards goods. While there appears to be some normalization of spending behavior, this shift has generally persisted. Real goods spending remains significantly above its pre-pandemic trend, driven by strong demand for durables such as furniture, electronics, and recreational goods. Spending on services has shown a resurgence but remains below its pre-pandemic trend.
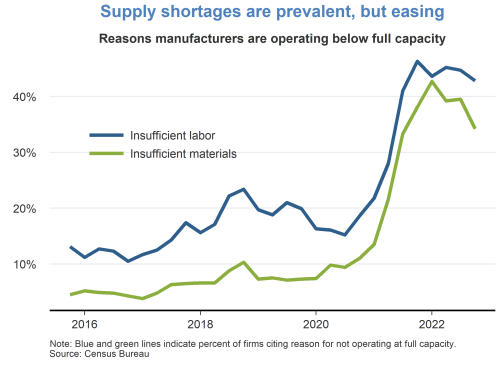
Supply chainbottlenecks for materials and labor remain a constraint on production, although there are some recent signs of easing. The fraction of manufacturers who reported operating below capacity due to insufficient materials peaked in late 2021 and has moderately declined over the past year. However, the fraction of manufacturers reporting insufficient labor has persisted at high levels.
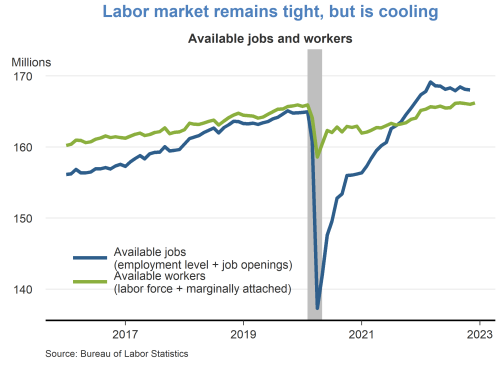
The labor market remains tight, despite some signs of cooling. The number of available jobs remains well above the number of available workers, although vacancy postings have been trending down in recent months. The tight labor market has put continued upward pressure on wages and labor market turnover.
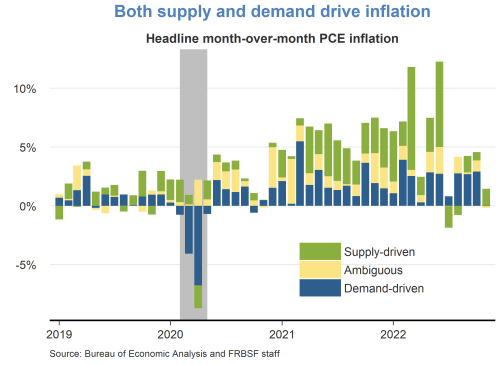
A decomposition of headline PCE inflation into supply– and demand-driven components shows that both supply and demand factors are responsible for the recent rise in inflation. The surge in inflation in early 2021 was mainly due to an increase in demand-driven factors. Subsequently, supply factors became more prevalent for the remainder of 2021. Supply-driven inflation has moderated significantly over recent months, while demand-driven inflation remains elevated.
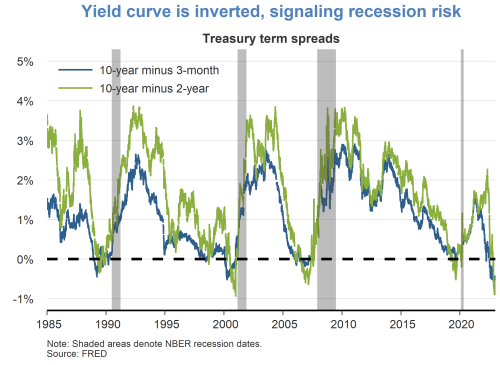
Although the labor market is currently very strong, financial markets are pointing to some downside risks. Namely, the difference between longer- and shorter-term interest rates has turned negative, which historically tends to occur immediately preceding recessions. It remains unclear whether lower longer-term yields are indicative of anticipated slower growth or lower inflation.
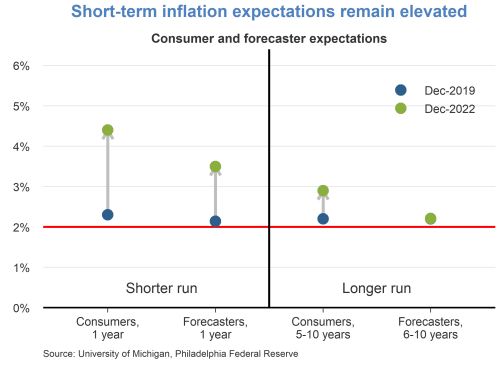
Short-term inflation expectations remain elevated relative to their pre-pandemic levels in December 2019. Consumers are expecting prices to rise 5% this year, while professional forecasters are expecting prices to rise 3.5%. Longer-term inflation expectations remain more subdued, indicating that both consumers and professionals believe inflation pressures will eventually dissipate.
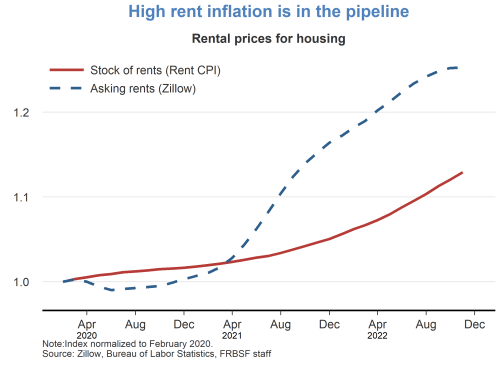
Rentinflation is expected to remain high over the next year. The prices for asking rents have grown quite substantially over the last two years. As new leases begin and existing leases are renewed, these higher asking rents will flow into the stock of rental units, putting upward pressure on rentinflation.