Japan Inc. Now Sells No Yen to Invest Abroad

Earnings on Japan’s foreign direct investment (FDI) reached 103% of new FDI in 2022–25. With dividends and retained earnings counted together, Japan Inc. now needs to sell little yen to invest abroad.

[by OKUBO Takuji]

Key takeaways

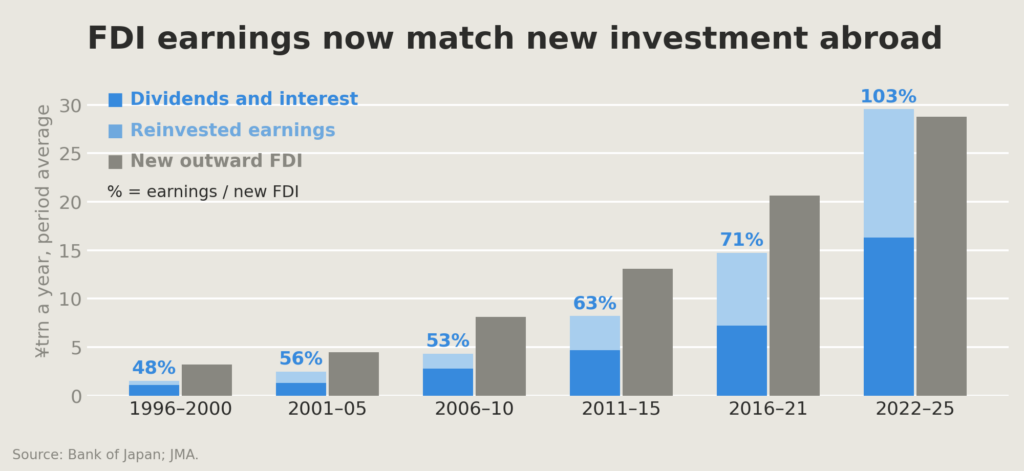
  • Foreign affiliates now earn about as much as Japan invests abroad each year. Reinvested earnings, dividends and interest together reached 103% of new outward FDI in 2022–25, against 48% in 1996–2000.
  • Dividends from foreign affiliates account for a growing share of Japanese corporate profit. We estimate that foreign affiliates contributed 13.4% of Japan Inc.’s earnings in FY2025, up from 1.7% in FY1996.
  • Corporate investment abroad now involves little net yen selling. After dividends and interest paid home, the estimated outflow has been close to zero since 2022, down from about ¥5 trillion a year, or about 1% of GDP, on average in the 2010s.

Japan’s FDI stock now earns 103% of new investment

It is often said that Japan’s ageing population and slow growth give its companies too few investment opportunities at home. A Japanese government report in 2024 included the following passages.

“Japan’s ageing and shrinking population depresses expected demand at home. Expected returns remain higher abroad, so Japanese companies have accelerated outward direct investment” (my translation). — MATSUBAYASHI Yōichi [松林 洋一], MOF PRI, chapter 8, p.136.

“Companies invested abroad because they saw no promising investments in Japan; they are unlikely to bring back every return. On a cash-flow basis, the external balance is in deficit and is one factor behind the weak yen” (my translation). — KARAKAMA Daisuke [唐鎌 大輔], MOF PRI, chapter 10, pp.178 and 175.

However, my review of recent data shows that while their premise of low growth prospects in Japan is probably still right, the direct investment Japan has accumulated abroad has reached a level where it earns enough to cover Japan’s new investment abroad. This changes the exchange-rate implication even if Japan keeps investing abroad.

As chart 1 shows, earnings on the accumulated investment stock rose from 48% of new outward FDI in 1996–2000 to 103% in 2022–25.

Chart 1
Overseas affiliates pay interest and dividends to their parent companies in Japan. Those dividends have become a sizable part of corporate Japan’s income: we estimate that they made up 13.4% of Japanese corporate profit in FY2025, up from 1.7% in FY1996.

When foreign affiliates retain their earnings on their balance sheets, Japan’s balance of payments statistics record them as FDI from Japan, even though no money crosses the border. While the companies receiving FDI dividends and the companies paying for new FDI are not necessarily the same, Japan Inc. as a whole is now financing its FDI almost entirely from the earnings of its overseas affiliates. At the current level of FDI, little new yen needs to be converted into foreign currencies as Japan goes about investing abroad.

In the rest of this report, I explain how foreign direct investment by Japanese companies evolved, and its near-term outlook. This report is the third in a series on the yen repatriation theme that I have published over the past few weeks, following “Yen Repatriation Starts with the Whale”, on capital flows through Japan’s national pension funds, and “Mrs Watanabe No More”, on Japanese households’ assets invested abroad.

A strong yen helped drive Japan’s first outward FDI boom

Japan’s outward investment was heavily restricted after WWII, requiring case-by-case permission from the government. Approvals became more and more automatic over the years until outward investment became “free in principle” in 1980. Trade friction with the US-led Japanese carmakers to restrain their exports from 1981, pushing them to build factories abroad. The rapid appreciation of the yen was also a factor. The yen strengthened from ¥242 per dollar before the Plaza Accord in September 1985 to ¥121 by the end of 1987. Japanese producers had to move lower value-added work abroad. The strong yen also gave Japanese financial institutions sizable purchasing power for a while, until the stock and property bubbles burst in 1990 and 1991.

All of these factors contributed to a rapid increase in outward FDI through the 1980s and 1990s (chart 2).

Chart 2

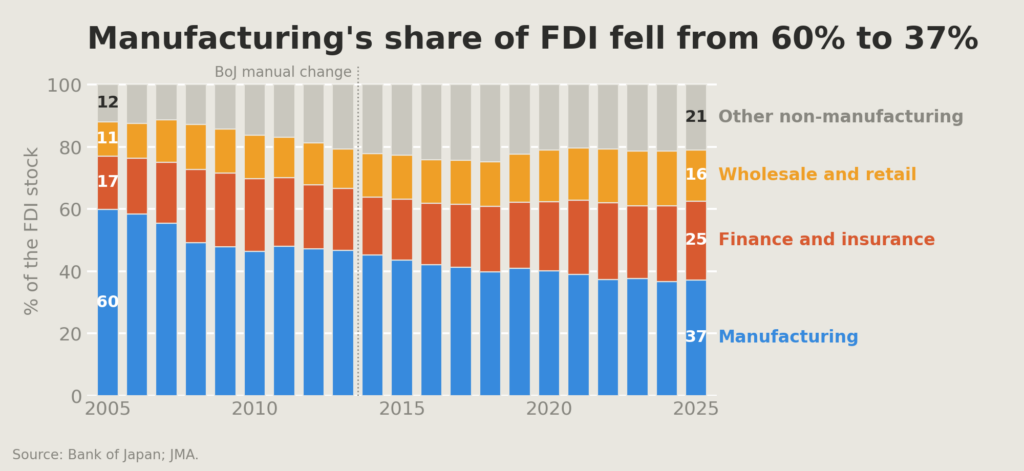
Even after the bubble burst, the strong yen kept pushing manufacturers to move abroad. In 2005, manufacturers accounted for 60% of the FDI stock. As Japanese manufacturers expanded their supply chains abroad, Asia’s share of outward FDI rose from about 12% in FY1986–90 to 19% in FY1995–99, and Asia held 23% of the FDI stock by 2005 (chart 3).

Chart 3
Japan’s outward FDI stock rose to 56% of GDP

The next phase was sustained by a different pressure. With weak growth and low interest rates at home, Japan Inc. kept investing abroad, across a broader range of industries. Between 1995 and 2025, the stock of FDI rose from 9% of Japan’s GDP to 58% (chart 4). In 2025, it is as large as about 38% of the private sector’s domestic fixed capital, on our estimate.

Chart 4

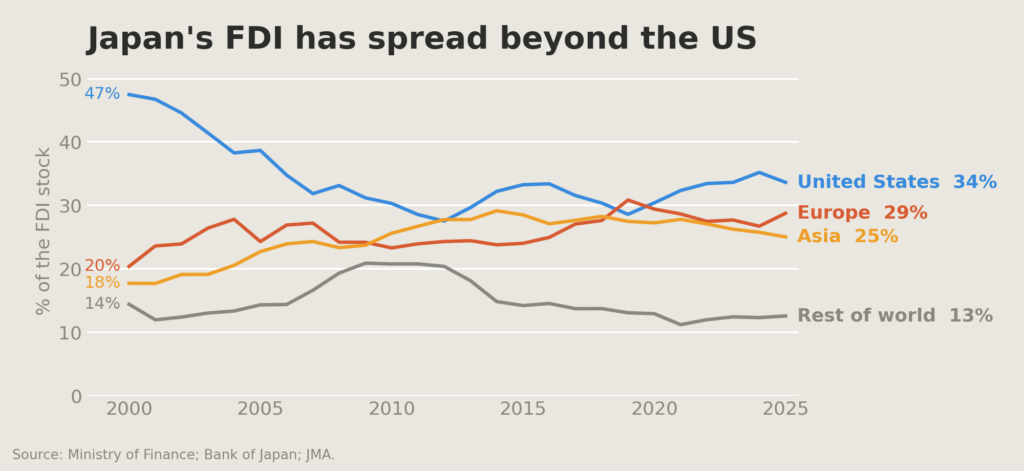
By industry composition and by destination compositions changed over time. Manufacturing’s share of the FDI stock had fallen to 37% by 2025, giving Japan’s FDI more breadth. By destination, we are seeing a revival of FDI toward the United States. It accounted for 34% of the stock in 2025, Europe 29% and Asia 25% (see earlier chart 3).
Thus, after decades of overseas investment, Japan’s FDI stock is now large enough that its earnings are sufficient to finance new investment abroad, at least for now. In the next section, I consider whether this will continue, and in particular whether Japanese companies may bring an even larger share of their overseas earnings back to Japan, given the weak yen, higher borrowing costs in yen and possibly better investment opportunities at home.

The weak yen has slowed offshoring, not reversed it

The real depreciation of the yen over the past 15 years made production in Japan more competitive. There is some evidence that manufacturers are considering bringing production back to Japan. The 2023 manufacturing white paper found more firms shifting production back from China than moving there, and they named the weak yen as one reason. We see some signs of reshoring. Japanese manufacturers’ overseas production ratio rose from 18.0% in FY2011 to 27.2% in FY2023, but it may have started to decline or at least stabilize. The ratio fell to 26.7% in FY2024. A Cabinet Office survey of listed manufacturers puts the ratio at 24.5% in FY2025, and their plan for FY2030 is broadly unchanged at 24.7%. The weak yen seems to have stabilized the wave of offshoring, but I see no firm evidence of a move back onshore yet.

Domestic investment has grown slowly despite the weak yen

There are tentative signs that domestic capital spending is starting to grow again. For three decades it grew at a very low speed. In real terms, private business investment rose only 26% between FY1997 and FY2025, less than 1% a year. In comparison, capital spending grew by about 4% a year on average in the United States. In my view, a weak currency is only one of the factors manufacturers weigh in designing their global production chains. The weak yen makes production in Japan competitive today, but they have also seen the exchange rate swing violently within short periods. Japan also has a shrinking population problem. It started to address it by opening a door to immigration, but the door is only tentatively open. Overall, my view is that the weak yen alone is unlikely to give Japan Inc. sufficient incentive to bring its capital back to Japan and to the yen.

Economic security is bringing some production home

The government is pushing harder than the currency, mostly in the name of economic security, even before the Takaichi government came along. The government currently has a ¥250 trillion domestic investment target for FY2040 and named AI and semiconductors among its 17 strategic fields. Semiconductors are where the money has gone furthest. In November 2024, under the Ishiba government, Japan committed more than ¥10 trillion of public support to AI and semiconductors by FY2030, aiming to draw more than ¥50 trillion of public and private investment over ten years. Japan managed to lure a TSMC plant to Japan, backed by a sizable subsidy. Rapidus, a government-supported Japanese semiconductor maker, has received a sizable subsidy and is building a factory in Hokkaido. Japan’s production of integrated circuits and discrete semiconductors rose from ¥2.7 trillion in 2019 to ¥4.1 trillion in 2025.

Under the name of economic security, the Japanese government is promoting other industries such as batteries, shipbuilding and pharmaceuticals. Defence spending adds to the push. Japan’s defence budget rose from about ¥5 trillion in FY2022 to ¥9.0 trillion in FY2026. Some defence contractors, such as Mitsubishi Heavy Industries, have doubled their defence revenue.

Japan’s industrial-policy record gives reason for caution

The Japanese government and the Ministry of Economy, Trade and Industry (METI), the key agency behind Japan’s industry policy, may claim some expertise in their industrial policies. Empirical studies in the past paint a poor track record, though. Rapidus, the most ambitious semiconductor project, has had no independent cost-benefit assessment (Negrine et al., 2025). While defence and economic security-driven policies have a different logic, I doubt that these industrial policies will succeed in bringing large-scale manufacturing investment back to Japan so long as macro factors such as Japan’s demography remain unfavourable.

FDI no longer appears to drive yen weakness

The weak yen and non-economic geopolitical factors do point to a halt in Japan’s four-decade offshoring trend, although it is a stabilization, rather than an economy-wide reversal of past offshoring. Japan Inc. will continue to invest more abroad, rather than within its borders. Given the sizable growth in the stock of cumulative FDI, Japan Inc. no longer needs to convert yen into overseas currency to keep investing abroad though. Net of dividends and interest paid home, Japan’s FDI sold about ¥5 trillion of yen a year, or about 1% of GDP, on average in the 2010s; since 2022 the net flow has been close to zero. There is also an interesting development in an effort to allow more share-exchange based M&A for cross-border deals that will further reduce the need for Japanese companies to spend their yen to purchase overseas assets. In my view, Japan Inc.’s FDI is no longer a factor to drive the yen weaker.

References

Japan-Watching: Yen Repatriation Starts with the Whale

GPIF, one of the largest national pension funds in the world, is likely to rebalance its assets from non-yen bonds to yen bonds, signaling a big turn in Japan’s cross-border capital flows.

[from Japan Macro Advisors, 10 September, 2026]

Key takeaways

  • In 2013, GPIF’s investment committee, chaired by UEDA Kazuo [植田和男], now the BoJ governor, saw a fair chance of a JGB crash within five to ten years. Its CEO priced the crash as the 10-year rising from 0.5% to 3%. Subsequently, GPIF cut its target weight for domestic bonds from 60% to 25% as an emergency measure against abnormally low yields.
  • The 10-year is now at 3%. On my replication of GPIF’s own allocation rule, a real return on JGBs near zero points to a 50% weight in domestic bonds, against 25% today. I expect GPIF to raise the weight, if it has not already started in the September quarter.
  • How GPIF decides its asset allocation and communicates it publicly is a very delicate and political issue. But regardless of how it communicates it, a change in asset allocation is inevitable. In my view, it signifies a big turn in Japan’s cross-border capital flows.

Japan has one of the Largest Pension Funds in the World

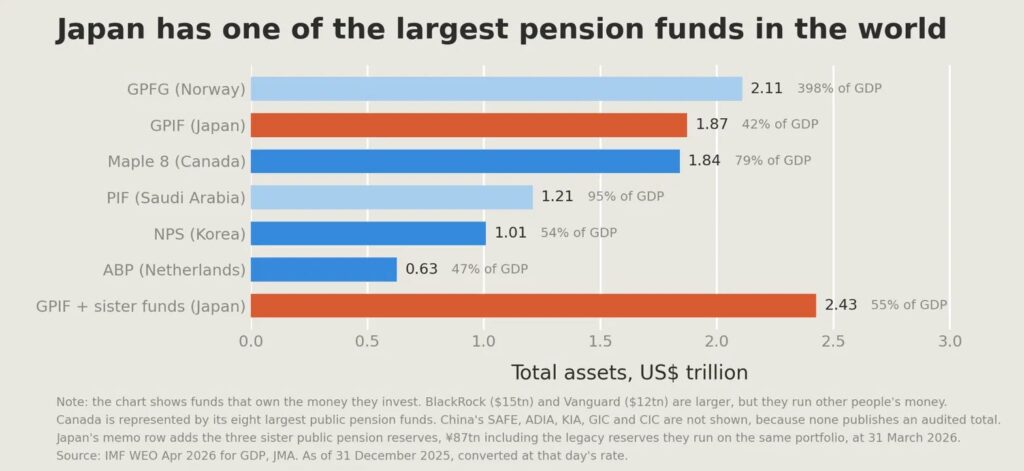
Japan has the second largest public pension fund in the world. Norway’s is the biggest, although it is not strictly a pension fund. Canada’s pension funds, when all eight of its variants are added together, come a close third.

Japan set up its first national pension fund in 1961 and it has since gone through various reforms and reorganization over the last 65 years. Its current form is called the Government Pension Investment Fund (GPIF). As explained in a later section, GPIF has a few siblings, and when we add them together, Japan’s public pension funds can be said to be the largest in the world.

Chart 1

GPIF used to invest most of its asset into JGBs

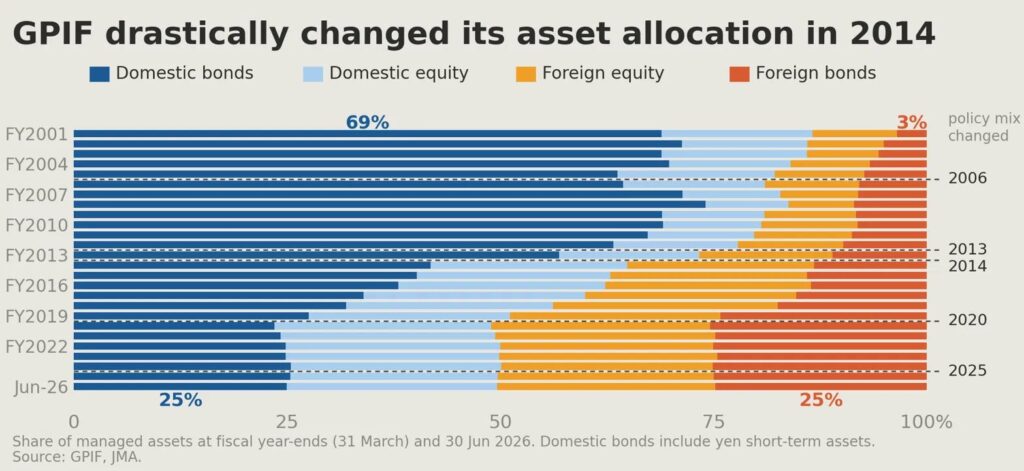
GPIF used to invest the majority of its fund as loans to the national government and into Japanese government bonds (JGBs). At the end of FY2012, 62% of its assets consisted of domestic bonds. However, in 2014 it went through a radical asset reallocation and the target weight for domestic bonds was reduced from 60% to 35%, and then further down to 25% in 2020. Its current target allocation is a clean four-way 25% split into domestic bonds, domestic equity, foreign equity and foreign bonds.

As one of the largest pension funds in the world, its asset allocations attract market attention and there is speculation that it is about to raise its allocation into domestic bonds. In my view, there is indeed a very high chance that GPIF will be raising its allocation into domestic bonds, if it has not already started to do so in the current quarter ending in September 2026.

Chart 2

UEDA in 2013 Saw a Bond Crash Coming

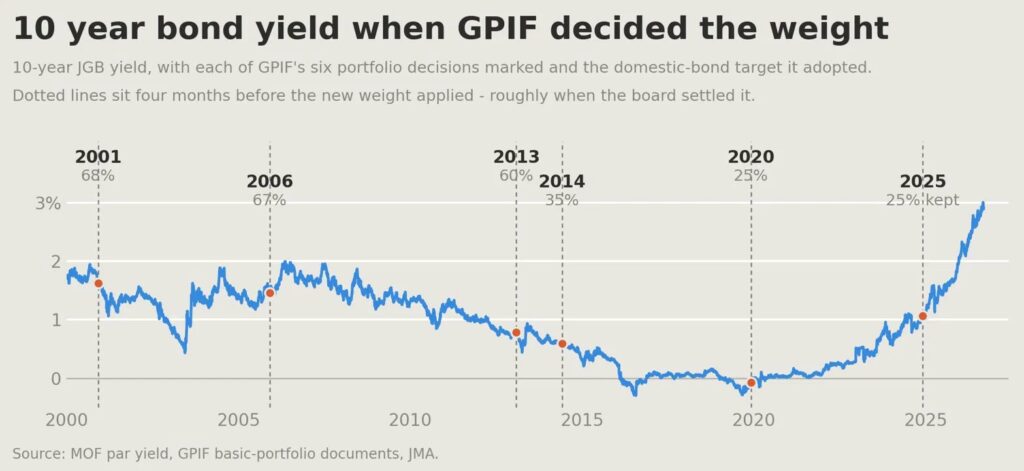
To understand why GPIF is highly likely to raise its allocation into domestic bonds, we need to go back in history to 2013. Why 2013? Of course, it is the year the Bank of Japan (BoJ) started its massive quantitative easing. The 10-year JGB yield started 2013 at 0.8% and it fell to 0.3% by the end of 2015 before briefly hitting a negative rate of -0.3% in 2016. If you were the chairperson of the GPIF investment committee, you would have been concerned about the wisdom of continuing to invest in JGBs at such a policy-driven low rate. The actual chairperson was UEDA Kazuo [植田和男], the current BoJ governor. In the minutes for October 2013, UEDA said, “I think there is a fair chance that bonds will crash at some point in the next five to ten years [unofficial translation].”

The minutes were released only seven years later; otherwise the use of the word “crash” would have been controversial.

GPIF CEO Priced the Crash at 3% in 2014. We Are There Now

If you read through the GPIF minutes between 2013 and 2014, you would see that GPIF officials were increasingly conscious of the precariousness of investing in JGBs. Long story short, as this process was highly political and a sensitive subject, they decided to radically lower the target allocation weight for JGBs to 35% in 2014, presented it as the result of a philosophical change in the way GPIF is managed and how the concept of “risk” should be considered. Investment in JGBs was no longer considered low risk in real terms. The asset allocation for domestic bonds was further lowered to 25% in 2020. The following is what MITANI Takahiro [三谷隆博], the GPIF CEO at the time and an ex-BoJ senior official, said in the October 2014 GPIF minutes.

“Yields are just under 0.5% now, so a move to near 3% would mean a loss of about ¥25 trillion. (…). So I think the clearest way to explain it is that reducing the weight on JGBs to some degree is simply unavoidable [unofficial translation]”

The 2014 cut in the weight was partly an emergency escape

As I wrote earlier, the radical asset reallocation in 2014 was part a shift in the concept of risk from “nominal” to “real”, so that JGB is no longer risk free assets. But the change was also at least partly an emergency measure to escape the abnormally low-yield environment. Then the next natural question is, now that the JGB yields are no longer abnormally low, what should happen to its asset allocation? Pensions are paid in yen, so long-duration Japanese government bonds are a natural match, while GPIF should also be holding some non-yen assets and equities to diversify its assets and protect the overall balance sheet from inflation. In the next section, I will show you a simplified replication of how GPIF decides its asset allocation and what GPIF’s asset allocation could be now that JGB yields are normal.

How GPIF decides its weights

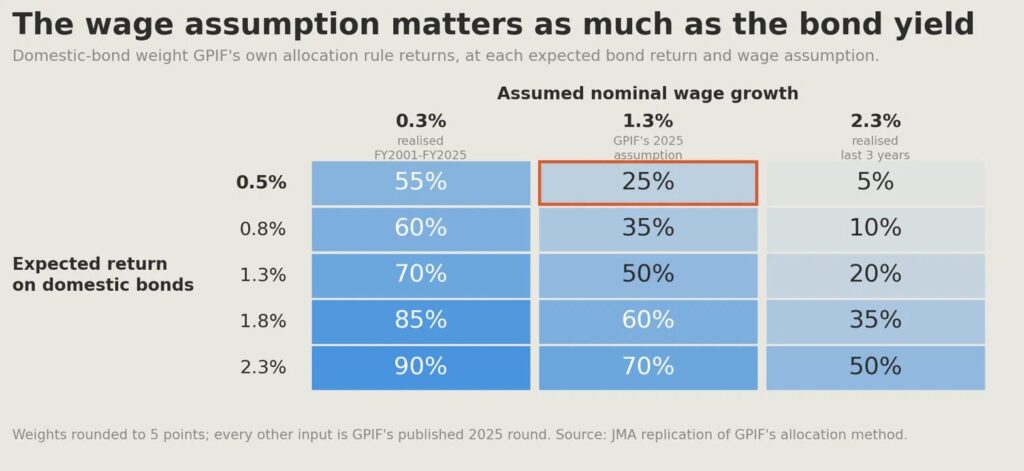
Put simply, GPIF’s target weights are the output of an optimizer with a few rules. Find the portfolio that, at the required real return, has the smallest average shortfall below wage growth in the years when it falls short, and round it to the nearest 5%.

When GPIF last decided to keep the current 25% weight for domestic bonds in 2025, JGBs were assumed to produce a nominal return of 0.5% against wage growth of 1.3%, so a real return of minus 0.8%. Exhibit 1 shows a simplified matrix of weights depending on expected nominal return on bonds and wage growth. The red box shows the assumption behind the 2025 weights decision mentioned above. If we use a higher wage growth assumption of 2.3%, an expected nominal return of 1.8% on bonds gives a weight of 35%. GPIF’s bond portfolio has an average maturity around 10 years, and the 10-year bond is yielding 3% now. A lot of thought and estimation is needed to form a view on the expected real return on domestic bonds, but in my view, it is clear that the minus 0.8% used in their last review is too low given where bond yields are.

Why GPIF kept the weight in 2025 and why circumstances changed

In late 2024 when the GPIF was reviewing the weight as part of its five-year plan, the BoJ was already in the process of exiting from QE and raising its policy rate. However, the JGB market was still in the process of adjustment and bond yields had a lot of room to rise. For example, the 10-year yield was 0.89% at the end of September 2024, rose to 2% by the end of 2025 and now, in September 2026, stands at 3%. You can understand why GPIF decided to keep its weight on domestic bonds unchanged as it would have incurred capital losses on bond purchases in 2025. But in my view, as I wrote in the report “The Long Climb in JGB Yields Is Nearly Over” [archived PDF], long bond yields are getting closer to a stability point. If the GPIF board shares my view, it is a good time to think about raising its target weight into domestic yen bonds.

The Whale Problem and the Washington Problem

How high should the new weight be for domestic bonds? The reality of determining appropriate weights and how to announce it is a lot harder than the simplified model I explained above. Other than forming a reasonable view on the expected real return on asset classes, there are a few factors that complicate the process.

Firstly, GPIF needs to think about how such an announcement would affect the market. GPIF is what financial market professionals call a whale, a massive investor whose investment decisions sway market prices. There is also a related argument that given the dominance of GPIF in the domestic market, GPIF should be increasing its asset weight abroad to reduce its impact on domestic asset markets.

Secondly, changing asset allocation weights carries political considerations. If GPIF decides to raise the target weight for domestic bonds, foreign bonds are the likely asset class whose weight will go down. More than 50% of its foreign bonds are in US dollars. With all the news circulating in the market now, Scott Bessent will not like a public announcement that one of the largest pension funds in the world is reducing its purchase of US treasuries. There are domestic political considerations as well, as the Takaichi government contemplates how best to fund its deficits.

These are the issues GPIF officials must be debating. How GPIF decides its asset allocation in the near future will be a revealing case study for those who want to study how policy-making works in Japan. Those who are interested in this topic should read the transcripts of an interesting government committee in 2014 that focused on how GPIF could shield itself from political meddling. Guess who chaired the committee? UEDA Kazuo [植田和男].

Whatever the near-term decision GPIF makes regarding its target weight, I think it is fairly clear that GPIF should be increasing its investment into domestic bonds. The following table shows how much GPIF could buy in net terms, depending on the eventual rise in the target weight.

How much GPIF buys: ¥32tn at 35%, ¥80tn at 50%

Domestic Bond TargetGPIF BuysWith the Sister Funds
30%¥16tn¥20tn
35%¥32tn¥20tn
40%¥48tn¥20tn
50%¥80tn¥20tn

Additional domestic-bond holdings from re-weighting the fund at 30 June 2026 (managed assets ·317.8tn). Foreign bonds sold first.
Source: GPIF, JMA.

Three things in this table matter for the market. GPIF is allowed to deviate its asset allocation by six points either side of 25% without any announcement, so 39% target is already possible without any public announcement. In 2014 GPIF moved inside its band first and announced the new portfolio afterwards, and I would expect the same sequence this time. Second, these are static figures, which do not account for the growth of the fund over time.

The sister funds move with the whale

As mentioned earlier, GPIF has a few siblings. The Pension Fund Association for Local Government Officials (¥35.5tn), the Federation of National Public Service Personnel Mutual Aid Associations, known as KKR (¥11.5tn), and the Promotion and Mutual Aid Corporation for Private Schools of Japan (¥4.9tn) manage the pension reserves of local government employees, national government employees and private-school teachers. These sisters run their funds on the same 25/25/25/25 model, and with the legacy reserves they also run, they hold a further ¥87tn on top of GPIF’s.

Conclusion

GPIF cut its domestic bond weight from 60% to 35% in 2014, and later to 25%, to safeguard its assets from the manipulated low JGB yields at the time and the eventual crash they foresaw. That crash, as GPIF’s CEO MITANI defined it in 2014, has now happened with the 10-year yield rising to 3%. In my view, JGB yields have largely normalized and there is no emergency reason to avoid domestic bonds. It is only natural that GPIF would raise its allocation into domestic bonds, although how GPIF communicates this publicly is a touchy issue they need to figure out. When GPIF raises its domestic bond allocation, foreign bonds are the likely asset class to take the hit. GPIF publishes quarterly results and the next publication for the end-September 2026 quarter, expected in early November 2026, will be closely watched. Judging from market movements in the last few weeks, the market has started to sense that what I described in this article is already happening and Japanese money is starting to come back to the yen. While it should be characterized as rebalancing, rather than a repatriation, it seems we are observing a big turn in Japanese cross-border capital flows.

Economics-Watching: Kuwait’s Banking Sector Posts Solid Credit Growth in October

[from NBK Group’s Economic Research Department, 21 November, 2024]

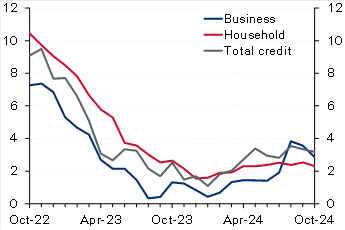
Kuwait: Solid credit growth in October driven by household credit. Domestic credit increased by a solid 0.4% in October, driving up YTD growth to 2.9% (3.2% y/y). The recovery in household credit continued, with growth in October at a solid 0.5%, resulting in a YTD increase of 2.4%. While y/y growth in household credit remains a limited 2.3%, annualized growth over the past four months is a stronger 4.7%. Business credit inched up by 0.2% in October, pushing YTD growth to 3.6% (2.9% y/y). Industry and trade drove business credit growth in October while construction and trade are the fastest growing YTD at 17% and 8%, respectively. In contrast, the oil/gas sector continued its downtrend, deepening the YTD decrease to 13%. Excluding the oil/gas sector, growth in business credit would increase to a relatively good 5% YTD. Looking ahead, the last couple of months of the year (especially December) are usually the weakest for business credit, likely due to increased repayments and write-offs, but it will not be surprising if the recovery in household credit is generally sustained, especially given the commencement of the interest rate-cutting cycle. Meanwhile, driven by a plunge in the volatile public-institution deposits, resident deposits decreased in October, resulting in YTD growth of 2.4% (4.2% y/y). Private-sector deposits inched up in October driving up YTD growth to 4.5% compared with 10% for government deposits while public-institution deposits are a big drag (-14%). Within private-sector KD deposits, CASA showed further signs of stabilization as there was no decrease for the third straight month while the YTD drawdown is a limited 1%.

Chart 1: Kuwait credit growth

(% y/y)

Source: Central Bank of Kuwait (CBK)
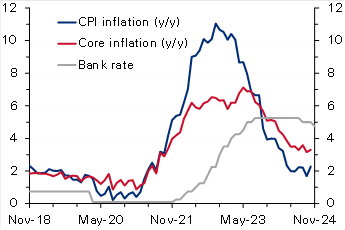
Chart 2: UK inflation

(%)

Source: Haver

Egypt: IMF concludes mission for fourth review, sees external risks. The IMF concluded its visit to Egypt after spending close to 2 weeks, holding several in-person meetings with the Egyptian authorities, private sector, and other stakeholders. The IMF released a statement mentioning that the current ongoing geopolitical tensions in the region in addition to an increasing number of refugees have affected the external sector (Suez Canal receipts down by 70%) and put severe pressure on the fiscal front. The Fund acknowledged the Central Bank of Egypt’s commitment to unify the exchange rate, maintain the flexible exchange rate regime, and keep inflation on a firm downward trend over the medium term by substantially tightening monetary policy. It also highlighted that continued policy discipline was also a key to containing fiscal risks, especially those related to the energy sector. The Fund, as always, re-iterated the need for promoting the private sector mainly through an enhanced tax system and accelerating divestment plans of the state firms. Finally, it also said that the discussions would continue over the coming days to finalize the agreement on the remaining policies and reform plans. However, the release did not provide any clear hints about the conclusion on the government’s earlier request to push the timeline of some of the subsidy moves.

Oman: IMF completes article IV with a strong outlook for the economy in 2025. Oman’s economy continued to expand with growth reaching 1.9% in the first half of 2024 (versus 1.2% in 2023), despite being weighed down by OPEC+ mandated oil production cuts as non-oil GDP grew a stronger 3.8% y/y in H1 (versus 1.8% in 2023). The fiscal and current account balances remain in a comfortable situation evident by a decline in public sector debt and the recent rating upgrade to investment grade. The Fund expects Oman’s economic growth to see a strong rebound in 2025, supported by higher oil production. It also believes that fiscal and current account balances will remain in surplus but at lower levels. Key risks to the outlook stem from oil price volatility and intensifying geopolitical tensions. The IMF also mentioned that further efforts are needed to raise nonhydrocarbon revenues through more tax policy measures and the phasing out of untargeted subsidies which should help in freeing up resources to finance growth under the government’s diversification agenda.

UK: Inflation rises more than forecast, reinforcing BoE’s caution on rate cuts. UK CPI inflation increased to 2.3% y/y in October from 1.7% the previous month, slightly above the market and the Bank of England’s forecast of 2.2%. On a monthly basis too, inflation rose to 0.6%, a seven-month high, from September’s no change. The steep rise was mainly driven by an almost 10% rise in the household energy price cap effective from October. Core inflation also accelerated to 3.3% y/y (0.4% m/m) from 3.2% (0.1% m/m). While goods prices continued to fall (-0.3% y/y), service prices rose at a faster rate of 5% from 4.9%. Recently, the Bank of England had cautioned about inflation quickening next year (projecting a peak rate of 2.8% in Q3 2025), citing the impact of higher insurance contributions and rising minimum wages as outlined in the latest government budget. Therefore, with inflation rising above forecast, the bank will likely slow the pace of monetary easing after delivering two interest rate cuts of 25 bps earlier, with markets now seeing only two additional cuts by the end of 2025.

Eurozone: ECB warns of fiscal and growth risks in its latest Financial Stability Review [archived PDF]. In its most recent Financial Stability Review (November) [archived PDF], the European Central Bank warned that elevated debt and fiscal deficit levels and anemic long-term growth could expose sovereign debt vulnerabilities in the region, stoking concerns of a repeat of the 2011 sovereign debt crisis. Maturing debt being rolled over at much higher borrowing rates raising debt service costs poses risks to countries with little fiscal space and leaves certain governments exposed to market fluctuations. The bank also emphasized the risks of high equity valuations, low liquidity and a greater concentration of exposure among non-banks. Moreover, it sees current geopolitical uncertainties and the possibility of more trade tensions as heightening risks. The Eurozone’s current government debt-to-GDP ratio stands at 88%, but the underlying data suggest a much more precarious situation with Greece, Italy, and France’s ratios at 164%, 137% and 112%. Recently, concerns about France’s high fiscal deficit (around 5.9% of GDP) and elevated debt levels saw yields on the country’s bonds rise steeply, widening the spread gap with German bonds to the highest level in over a decade.

Stock marketsIndexDaily Change (%)YTD Change (%)
Regional
Abu Dhabi (ADI)9,405-0.23-1.80
Bahrain (ASI)2,043-0.373.62
Dubai (DFMGI)4,7610.6117.26
Egypt (EGX 30)30,588-0.33 23.18
GCC (S&P GCC 40)7090.09-0.52
Kuwait (All Share)7,353-0.087.86
KSA (TASI)11,868-0.07-0.83
Oman (MSM 30)4,6090.002.10
Qatar (QE Index)10,4380.12-3.62
International
CSI 3003,9860.2216.17
DAX19,005-0.2913.45
DJIA43,4080.3215.17
Eurostoxx 504,730-0.454.60
FTSE 1008,085-0.174.55
Nikkei 22538,352-0.1614.61
S&P 5005,9170.0024.05
3m interbank rates%Daily Change (bps)YTD Change (bps)
Bahrain5.86-1.29-66.34
Kuwait3.940.00-37.50
Qatar6.000.00-25.00
UAE4.433.81-89.96
Saudi5.50-4.75-73.14
SOFR4.52-0.09-81.13
Bond yields%Daily Change (bps)YTD Change (bps)
Regional
Abu Dhabi 20274.665.0033.9
Oman 20275.496.0033.0
Qatar 20264.686.0016.1
Kuwait 20274.693.0035.0
Saudi 20284.961.0043.9
International 10-year
US Treasury4.411.7755.3
German Bund2.340.3531.2
UK Gilt4.472.6093.0
Japanese Gov’t Bond1.071.045.4
Exchange ratesRateDaily Change (%)YTD Change (%)
KWD per USD0.310.04-0.05
KWD per EUR0.32-0.46-1.98
USD per EUR1.05-0.49-4.47
JPY per USD155.430.5010.19
USD per GBP1.27-0.25-0.62
EGP per USD49.670.3461.00
Commodities$/unitDaily Change (%)YTD Change (%)
Brent crude72.81-0.68-5.49
KEC73.780.74-7.26
WTI68.87-0.75-3.88
Gold2,648.20.8028.40

Disclaimer: While every care has been taken in preparing this publication, National Bank of Kuwait accepts no liability whatsoever for any direct or consequential losses arising from its use. Daily Economic Update is distributed on a complimentary and discretionary basis to NBK clients and associates. This report and previous issues can be found in the “News & Insight / Economic Reports” section of the National Bank of Kuwait’s web site. Please visit their web site, nbk.com, for other bank publications.

Economic-Watching: Japanese Ministry of Finance Info, July 2024

[from the Ministry of Finance, Japan]

Interest Rates (July 17, 2024)

Date1Y2Y3Y4Y5Y6Y7Y8Y9Y10Y15Y20Y25Y3oY40Y
7/10.1750.360.390.4920.6150.6620.7620.8620.9621.0831.5491.8732.0582.1632.351
7/20.1760.3650.4010.5080.630.6790.7860.890.9851.1041.5731.8942.0752.1742.352
7/30.1660.350.3910.4930.6130.6640.7780.8860.9841.11.5791.9082.0882.1852.364
7/40.1480.340.3820.4820.5990.6450.7540.8630.9671.0861.5711.9082.0922.1882.364
7/50.1480.3460.3820.4830.5980.6350.7450.850.9581.0721.5661.9022.0982.22.379
7/80.150.3620.3980.4990.6160.6550.7640.8690.9741.0921.5761.9072.0992.22.385
7/90.140.3530.3910.4840.610.640.7480.8560.961.0791.5731.9112.1032.2052.398
7/100.1310.3430.3870.480.6050.6490.7560.8650.9691.0931.5861.9242.1152.222.415
7/110.1310.3430.3920.4850.6110.6540.7560.8640.9691.0891.5851.9122.1122.2212.419
7/120.1220.3330.3780.470.5860.6240.7230.8310.9361.0551.5391.8732.0732.1772.387
7/160.1110.320.3630.4560.5660.6060.7050.8090.9141.0321.5241.862.0612.1682.375
7/170.1150.330.3740.4670.5770.620.720.8240.9241.0421.5281.8612.0552.1732.376
[download CSV]

Announcement of 40-year Japanese Government Bonds to Be Issued in July 2024

[Provisional Translation]

July 17, 2024

Ministry of Finance

  1. Auction Date: July 24, 2024
  2. Issue Date: July 25, 2024
  3. Maturity Date: March 20, 2064
  4. Offering Amount: About 700 billion yen

* 40-year Japanese Government Bonds to be issued in July will be a reopening issue of the May 2024 issue. The auction method is Dutch-style-yield-competitive auction at intervals of 0.5bp.

JGB Monthly Newsletter (July 2024)

Read the full newsletter (in English) [archived PDF]