
[from Japan’s Cabinet Office (内閣府) Economic and Social Research]
Results
- The total value of machinery orders received by 280 manufacturers operating in Japan decreased by 3.7% in August from the previous month on a seasonally adjusted basis.
- Private-sector machinery orders, excluding volatile ones for ships and those from electric power companies, increased a seasonally adjusted by 5.2% in August.
Percentage change from previous quarter (month)
(%)
| 2025 Jul-Sep | Oct-Dec | 2026 Jan-Mar | Apr-Jun | Jul-Sep (forecast) | 2026 May | Jun | Jul | Aug | |
|---|---|---|---|---|---|---|---|---|---|
| Total | 3.5 | 10.2 | 10.3 | 11.3 | -0.1 | 9.5 | 0.4 | -5.5 | -3.7 |
| private sector | -1.3 | 6.2 | 2.6 | 14.6 | -3.8 | 37.4 | -26.0 | 1.5 | -4.2 |
| (exc. volatile orders) | -1.0 | 6.6 | 6.4 | 0.2 | 4.9 | -12.4 | 9.7 | -3.7 | 5.2 |
| manufacturing | 5.3 | -0.8 | 10.0 | -1.3 | 4.0 | -14.9 | 19.9 | -1.0 | 1.6 |
| non-manufacturing (exc. volatile orders) | -4.4 | 11.3 | 6.2 | -2.3 | 5.9 | -9.3 | 4.5 | -2.6 | 2.9 |
| governments | -14.7 | 57.7 | -21.3 | -17.8 | 28.5 | -5.0 | 10.5 | -9.2 | -6.1 |
| from overseas | 14.5 | 3.6 | 31.0 | 10.4 | 1.3 | -4.4 | 19.9 | -8.2 | -7.7 |
| through agencies | 0.3 | 2.6 | 4.8 | 6.7 | 11.1 | -5.8 | 7.2 | 1.3 | -6.3 |
Note
- Seasonally adjusted series. As all series are seasonally adjusted individually, a sum of seasonally adjusted individual/component series does not equal to seasonally adjusted totals.
- Volatile orders: Orders for ships and those from electric power companies.
References
Chart 1: Total Value of Machinery Orders
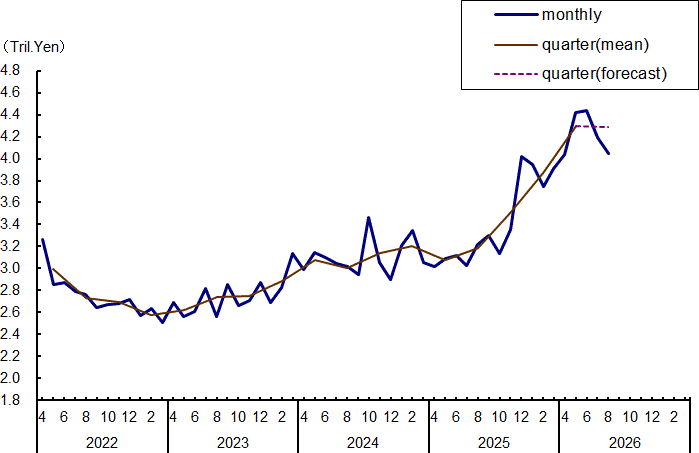
Chart 2: Private Sector (excluding volatile orders)
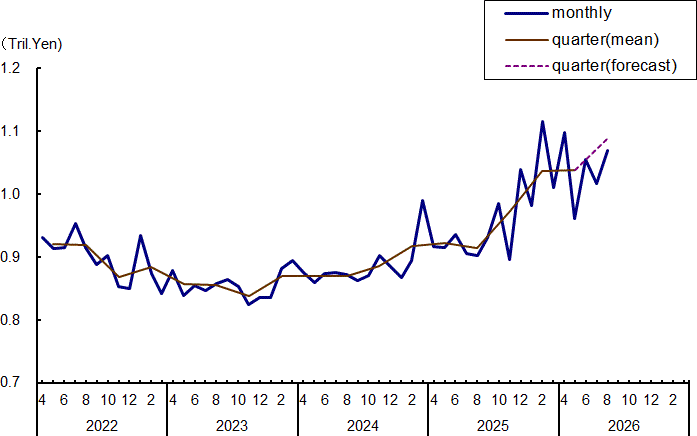
Table 1: Machinery Orders by Sectors
(billion Yen %)
| 2025 Jul-Sep | Oct-Dec | 2026 Jan-Mar | Apr-Jun | Jul-Sep (forecast) | 2026 May | Jun | Jul | Aug | |
|---|---|---|---|---|---|---|---|---|---|
| Total | 9,543.6 (3.5) [6.1] | 10,514.8 (10.2) [13.5] | 11,593.0 (10.3) [23.5] | 12,900.0 (11.3) [39.4] | 12,881.0 (-0.1) [36.7] | 4,422.2 (9.5) [40.4] | 4,439.0 (0.4) [43.7] | 4,195.7 (-5.5) [36.8] | 4,041.9 (-3.7) [26.1] |
| private sector | 3,370.6 (-1.3) [12.9] | 3,580.8 (6.2) [11.2] | 3,674.3 (2.6) [11.6] | 4,210.8 (14.6) [22.4] | 4,051.2 (-3.8) [21.0] | 1,706.2 (37.4) [40.8] | 1,262.6 (-26.0) [12.7] | 1,281.3 (1.5) [10.3] | 1,226.9 (-4.2) [13.8] |
| (exc. volatile orders) | 2,741.4 (-1.0) [6.6] | 2,921.6 (6.6) [8.1] | 3,109.2 (6.4) [12.6] | 3,116.2 (0.2) [10.8] | 3,268.6 (4.9) [19.9] | 962.0 (-12.4) [-1.9] | 1,055.8 (9.7) [16.9] | 1,016.9 (-3.7) [11.2] | 1,069.8 (5.2) [18.6] |
| manufacturing | 1,369.3 (5.3) [14.0] | 1,357.8 (-0.8) [3.9] | 1,493.7 (10.0) [14.8] | 1,474.8 (-1.3) [12.5] | 1,534.0 (4.0) [12.6] | 437.2 (-14.9) [-4.7] | 524.1 (19.9) [27.4] | 518.6 (-1.0) [20.5] | 527.0 (1.6) [23.5] |
| non-manufacturing (exc. volatile orders) | 1,409.5 (-4.4) [1.5] | 1,568.1 (11.3) [12.0] | 1,666.0 (62) [12.5] | 1,627.2 (-2.3) [9.6] | 1,723.8 (5.9) [25.6] | 516.9 (-9.3) [0.9] | 540.2 (4.5) [8.5] | 525.9 (-2.6) [5.7] | 541.3 (2.9) [10.8] |
| governments | 1,159.4 (-14.7) [-22.7] | 1,828.8 (57.7) [-4.4] | 1,439.2 (-21.3) [-18.6] | 1,183.4 (-17.8) [-13.2] | 1,521.2 (28.5) [33.4] | 374.7 (-5.0) [-24.9] | 414.2 (10.5) [-7.3] | 376.2 (-9.2) [-25.8] | 353.3 (-6.1) [8.1] |
| from overseas | 4,624.3 (14.5) [10.3] | 4,789.4 (3.6) [22.3] | 6,275.3 (31.0) [57.2] | 6.928.8 (10.4) [71.1] | 7.016.5 (1.3) [55.6] | 2,135.5 (-4.4) [62.2] | 2,559.6 (19.9) [83.8] | 2,350.2 (-8.2) [81.5] | 2,168.7 (-7.7) [36.9] |
| through agencies | 410.6 (0.3) [9.1] | 421.3 (2.6) [13.1] | 441.3 (4.8) [18.7] | 470.7 (6.7) [13.7] | 522.7 (11.1) [24.7] | 150.2 (-5.8) [0.4] | 161.0 (7.2) [16.1] | 163.1 (1.3) [12.1] | 152.8 (-6.3) [17.4] |
Notes
- Seasonally adjusted series. As all series are seasonally adjusted individually, a sum of seasonally adjusted individual/component series does not equal to seasonally adjusted totals.
- Figures in () represent the percentage change from the previous quarter (month). Figures in [] are the percentage change from the corresponding quarter (month) of the previous year in original series.
- Volatile orders: Orders for ships and those from electric power companies.
Table 2:
| 2025 Jul-Sep | Oct-Dec | 2026 Jan-Mar | Apr-Jun | 2026 May | Jun | Jul | Aug | |
|---|---|---|---|---|---|---|---|---|
| Manufacturing | 5.3 | -0.8 | 10.0 | -1.3 | -14.9 | 19.9 | -1.0 | 1.6 |
| 1. Foods and beverages | -72 | -0.9 | 11.0 | -2.1 | -13.2 | 27.3 | -11.6 | 0.1 |
| 2. Textile mill products | 12.3 | -3.1 | -12.5 | 26.1 | 3.8 | -14.3 | -7.0 | -18.6 |
| 3. Pulp, paper and paper products | 5.0 | 9.4 | -7.9 | -2.5 | 14.3 | 5.4 | 65.2 | -33.2 |
| 4. Chemical and chemical products | 9.5 | -37.5 | 42.7 | -21.7 | 19.2 | 39.0 | -12.0 | -11.5 |
| 5. Petroleum and coal products | -36.3 | 66.7 | -53.4 | -2.5 | 7.1 | 32.9 | 4.8 | 19.6 |
| 6. Ceramic, stone and clay products | 31.2 | -7.1 | 9.5 | 15.7 | -13.3 | 3.2 | 6.1 | -23.0 |
| 7. Iron and steel | 22.6 | -11.5 | 21.5 | -21.5 | -5.3 | -10.8 | 5.8 | -36.3 |
| 8. Non-ferrous metals | -5.2 | -0.2 | 26.1 | -16.0 | 19.5 | 225.3 | -82.2 | 132.6 |
| 9. Fabricated metal products | -6.9 | -5.7 | 16.4 | 48.3 | 13.8 | -46.1 | 13.2 | -10.7 |
| 10. General-purpose and production machinery | 7.1 | -4.1 | 11.0 | -0.8 | -10.3 | 18.9 | -1.4 | 9.3 |
| 11. Business-oriented machinery | -11.5 | 2.4 | 8.2 | 19.9 | -14.3 | 3.2 | -7.2 | -5.7 |
| 12. Electrical machinery | -6.3 | 10.3 | -3.0 | 20.2 | -12.0 | 2.2 | 46.1 | -5.9 |
| 13. Information and communication electronics | 22.3 | -8.6 | 11.9 | 15.1 | -23.6 | 29.7 | 4.7 | 13.0 |
| 14. Automobiles, parts and accessories | 3.8 | -0.8 | 13.6 | -0.5 | 7.4 | 6.9 | 1.5 | 13.1 |
| 15. Ship building | 18.8 | -25.7 | 65.7 | 3.9 | -80.5 | 94.9 | 88.9 | -41.0 |
| 16. Other transport equipment | -4.5 | 5.9 | 36.4 | -11.4 | 67.1 | 4.7 | -41.4 | 43.7 |
| 17. Other manufacturing | -1.5 | 9.9 | -4.2 | -4.6 | -10.2 | -0.6 | -1.3 | 6.1 |
| Non-manufacturing | -2.4 | 10.3 | -1.5 | 24.1 | 68.0 | -40.4 | 0.8 | -5.7 |
| 18. Agriculture, forestry and fishing | 10.4 | 12.2 | 0.5 | -23.2 | -24.2 | 33.0 | 11.0 | -4.0 |
| 19. Mining, quarrying of stone and gravel | -8.4 | -6.9 | 3.0 | -24.1 | 20.7 | 23.7 | 6.7 | 25.0 |
| 20. Construction | -3.1 | 8.3 | 4.0 | 9.3 | 1.6 | -8.5 | 5.8 | -17.2 |
| 21. Electricity supply | 1.0 | -1.5 | 0.2 | 91.7 | 342.9 | -75.1 | 34.2 | -34.9 |
| 22. Transportation and postal activities | 7.0 | 0.1 | -15.8 | 5.5 | -23.3 | 8.9 | 3.3 | -13.9 |
| 23. Telecommunications | -16.8 | 18.8 | -0.8 | 14.6 | -7.5 | 22.3 | -23.2 | 16.9 |
| 24. Wholesale and retail trade | 4.8 | -2.4 | 4.1 | 3.4 | -3.1 | -3.1 | -3.9 | 29.2 |
| 25. Finance and insurance | -6.3 | 9.3 | 8.5 | -2.7 | -10.6 | 17.9 | -6.8 | 0.2 |
| 26. Real estate | -20.9 | 4.7 | 14.1 | 39.7 | -69.3 | 253.1 | -26.4 | 0.7 |
| 27. Information services | -6.4 | 7.7 | 25.1 | -11.8 | -8.9 | 16.0 | -16.9 | 7.9 |
| 28. Goods leasing | 14.3 | -12.8 | 10.1 | -16.6 | -18.6 | -0.9 | -6.8 | 136.0 |
| 29. Other non-manufacturing | -2.5 | 41.5 | -2.8 | -5.2 | 34.9 | -26.6 | 20.1 | -28.0 |
Note
Percentage change from previous quarter (month) in seasonally adjusted series.