
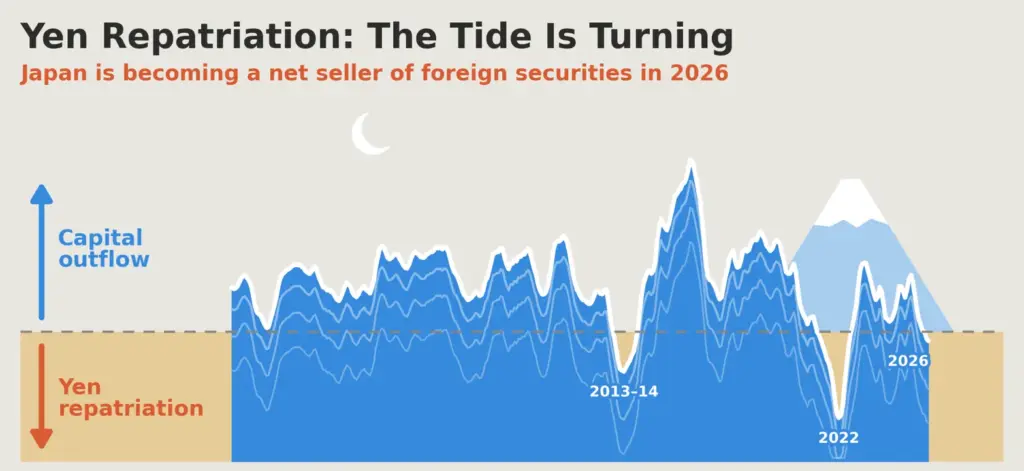
From 2014 to 2025, Japan bought foreign securities worth about 2% of GDP a year. In 2026 the tide is turning. Banks are selling foreign bonds and capital flow has turned to a small net inflow.
[by OKUBO Takuji]
Key takeaways
- Japan has been an exporter of capital since the 1980s, purchasing 2–3% of GDP worth of foreign assets every year, interrupted by episodes of yen repatriation from time to time. 2026–27 may be turning into such an episode.
- Banks are selling foreign bonds and buying JGBs. Now that yen yields are higher, their JGB purchases leave less room for duration risk in foreign bonds.
- Households keep buying foreign stocks, but pension funds are selling against them, offsetting the net purchase of foreign equities.
- Pension funds are likely to put more money into yen. On my replication of GPIF’s allocation rule, its domestic-bond weight should be much higher than today’s 25%, and foreign bonds are the likely asset class to give way.
- The weekly survey to 10 October shows foreign-bond selling continuing. In my view, yen repatriation in 2026–27 is a question of how large, not whether.
Japan’s outward flow has turned into a net sale
Japan has been a large provider of capital to the rest of the world since the 1980s. The latest wave began in 2014. From 2014 to 2025, residents bought ¥13.6trn a year on average, about 2.3% of GDP.
Chart 1 shows the flow as a rolling twelve-month sum. The one large exception was 2022, when bond yields rose sharply abroad and Japanese investors sold their holdings, realizing losses on their foreign bonds. They went right back into purchasing foreign securities in 2023 when yield curves in major foreign bond markets stabilized, while domestic bond yields remained close to zero. How Japanese investors behave now that yen yields are respectable is the big question.
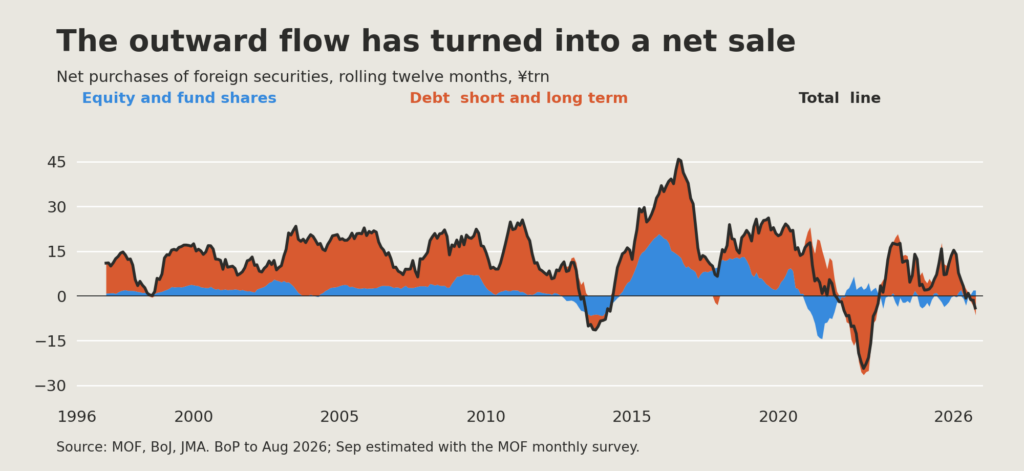
Chart 1: Rolling twelve-month flows, stacked separately above and below zero. Short- and long-term debt combined; black line is the net total. BoP through August 2026; September estimated from the MOF monthly survey. Source: MOF, BoJ, JMA.
The flow is turning again in 2026. By August 2026 the rolling total was a small net sale of ¥1.5trn (see chart 1 above). September’s balance of payments statistics are not out yet, but based on the International Transactions in Securities Survey for September, I estimate that the rolling total would be a net sale of ¥4.5trn. September itself was a small net sale; most of the drop comes from September 2025’s ¥2.8trn of buying leaving the window.
Foreign bonds and foreign equity have different investors
In the rest of the report, I discuss recent developments in Japan’s capital flows. I have organized the discussion by asset class because the investor bases differ. Banks, the FX reserves managed by the government, pensions and insurers hold foreign bonds. In foreign equity, households are now the key investors, alongside pensions and other traditional investors. GPIF and other pensions sit in both markets, so I discuss them in a part of their own.
Part 1 covers foreign bonds, where repatriation would show first. Part 2 covers foreign equity, where households keep buying while pensions sell against them. In Part 3, GPIF is the key mover in both markets. In Part 4, I discuss the most recent developments, using the weekly survey, which runs to 10 October, and what to watch. The focus of this report is return-seeking portfolio investment, so analysis of the Japanese government’s FX reserves is covered in Japan Cashes In Its National Carry Trade (31 July) and Japan Inc.’s real investment is covered in Japan Inc. Now Sells No Yen to Invest Abroad (10 October).
Japan holds 147% of GDP worth of securities abroad
Before moving to discuss recent developments, let me give you a brief historical perspective on Japan’s outward investment. Japan has been a creditor nation since the 1980s. In 1985–89, Japan invested 3–5% of GDP, as Japan was awash with bubble money. Since then, Japan has typically invested 2–3% of GDP a year in foreign securities, with some episodes of repatriation from time to time. At end-2025, Japan held ¥982trn in foreign portfolio securities and official reserve assets: ¥401trn of equity and fund shares, ¥368trn of portfolio debt and ¥214trn of reserves (chart 2). Reserves are mostly US Treasuries plus some deposits and gold. The ¥401trn in equity and fund shares actually includes some bond funds that are categorized inside “equity and fund shares” in official statistics, so we will make some adjustments when we discuss investor behavior by asset class in later parts.
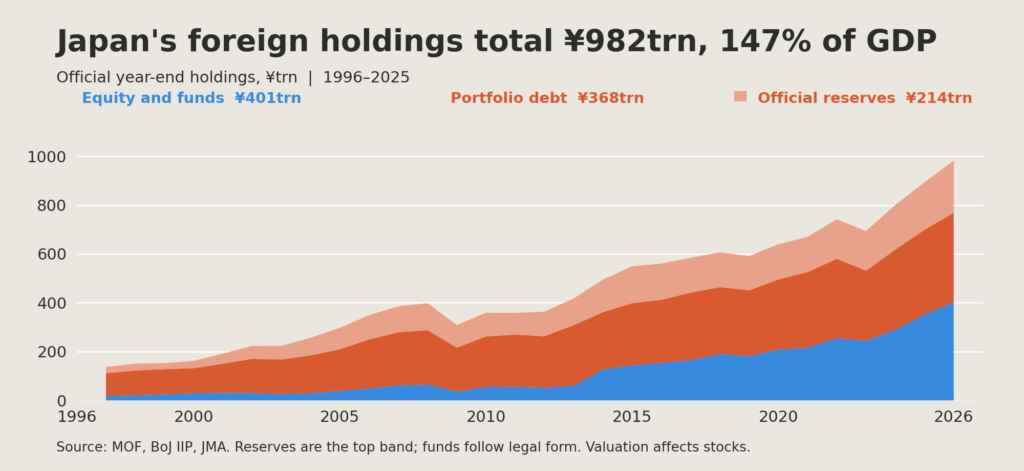
Chart 2: Official year-end holdings, 1996–2025. Equity is the bottom band, portfolio debt the middle band and official reserves the top band. Debt and reserves use related colors. Current BPM6-rearranged IIP; funds classified by legal form. Source: MOF, BoJ, JMA.
Part 1. Selling foreign bonds in 2026
Banks, reserves, pensions and insurers own the bonds
Of the ¥214trn the Japanese government holds as reserves, ¥157trn is debt securities and the rest is gold, deposits and other claims. Add this ¥157trn to the ¥368trn of private debt securities and an estimated ¥47trn of bond funds that are categorized as “equity and fund shares” in the balance of payments statistics, and you get ¥573trn of debt securities held by Japan at end-2025. By my estimate, banks held 32% of it, official FX reserves 27%, public and corporate pensions 19% and insurers 14% (chart 3).
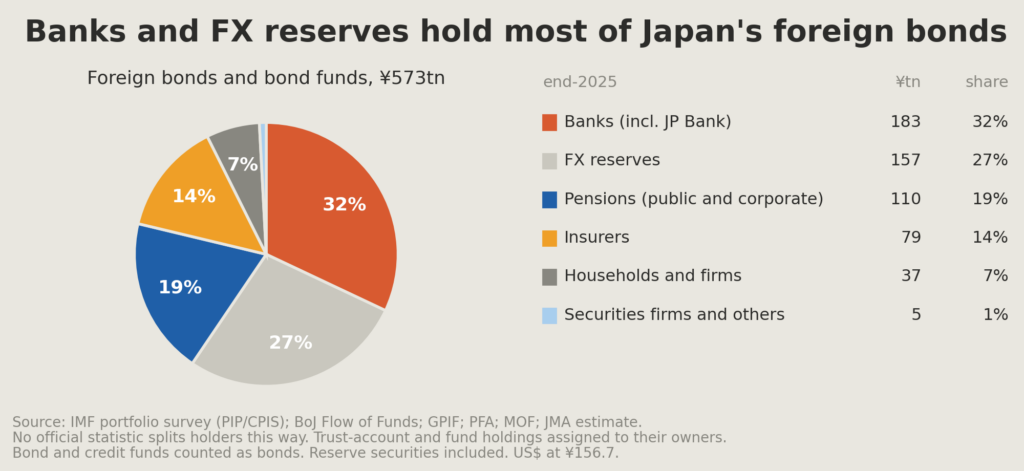
Chart 3: End-2025, JMA estimates. Bonds and bond funds, reserve securities included; trust-account and fund holdings are assigned to their owners. Source: IMF, GPIF, BoJ, MOF, PFA, JMA.
Banks are selling while pensions keep buying
Chart 4 shows movements in foreign long-term bond flows by investors since 2014. We see pension funds as the consistent buyer, with an elevated purchase in 2020 when GPIF raised its foreign-bond asset allocation target from 15% to 25% (see the Japanese Macro Advisors GPIF report for details). On the other hand, life insurers have been consistent net sellers in recent years. Banks seem to be opportunistic swing players. This year’s foreign-bond sale so far is a bank story.
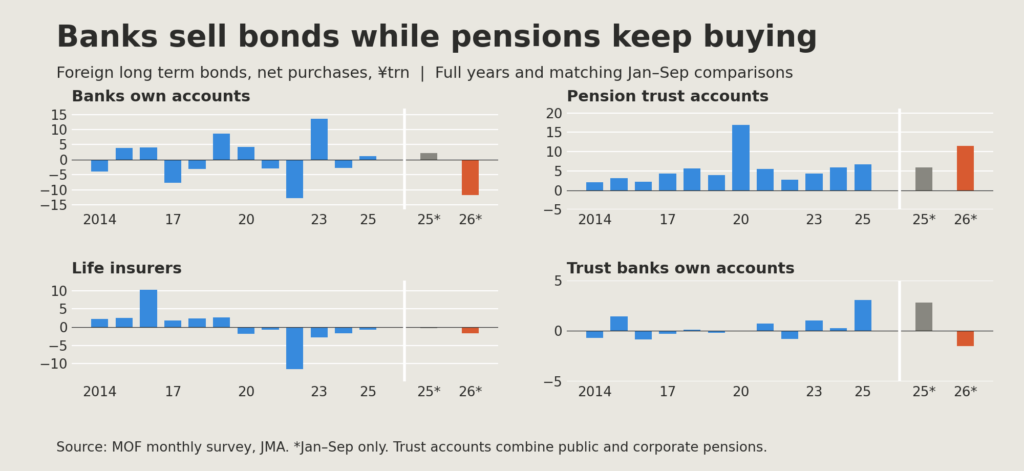
Chart 4: Foreign long-term bonds by investor. Full calendar years 2014–2025; the two separate bars at right compare January–September 2025 and 2026. MOF monthly survey throughout. Source: MOF, JMA.
The bank balance sheets show who is selling. City banks are the dominant players: their foreign securities reached about ¥53trn in late 2024, moved sideways with some swings in 2025, and then fell in 2026. Regional banks’ foreign holdings are small and little changed (chart 5).
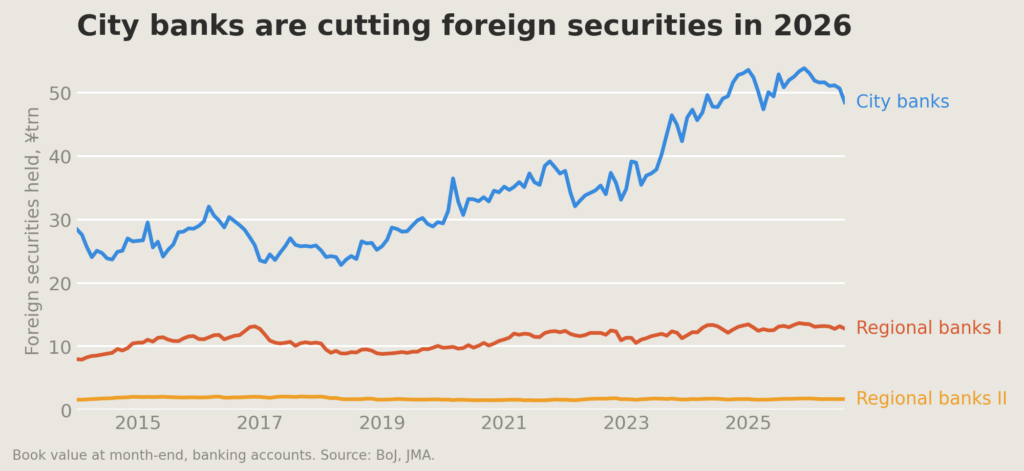
Chart 5: Foreign securities held by city banks and regional banks, month-end book value, banking accounts, through August 2026. Source: BoJ, JMA.
2026 is different from 2022: Yen rates are at 30-year highs
City banks went through a similar repatriation episode in 2022 (see chart 5), but went right back to buying foreign bonds in 2023 as soon as the overseas yield curve stabilized. 2026 offers a different environment. Both city banks and regional banks are buying JGBs, although in different parts of the yield curve. City banks are stepping up their purchases of 10-year bonds on a rolling 12-month basis (chart 6). They were selling the 2–5-year and super-long sectors in early 2026, but their rolling 12-month figures have just come back to neutral. Regional and co-operative institutions are showing strong appetite for the 2–5-year and 10-year sectors. Banks buying at home does not necessarily mean selling bonds abroad, but their JGB purchases do leave less room for duration risk in foreign bonds.
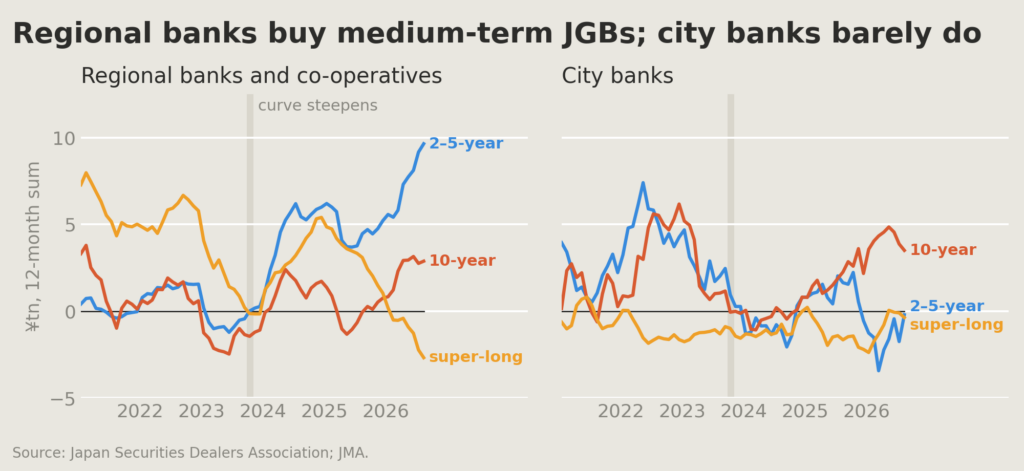
Chart 6: Net secondary-market OTC purchases, twelve months through August. Regional/co-operative group includes regional banks, shinkin and agricultural institutions; auctions and bills excluded. Source: JSDA, JMA.
Part 2. Pension funds are selling foreign equity, offsetting households’ buying
Pension funds and households are the top two owners of foreign equity (chart 7). As you can see in chart 8, households have been showing a strong appetite for foreign equity investment trusts since 2024, and they are still buying. NISA accounts, low-cost funds and retirement savings are behind it, and I expect it to continue. Mrs Watanabe No More (21 September) tells that story in full.
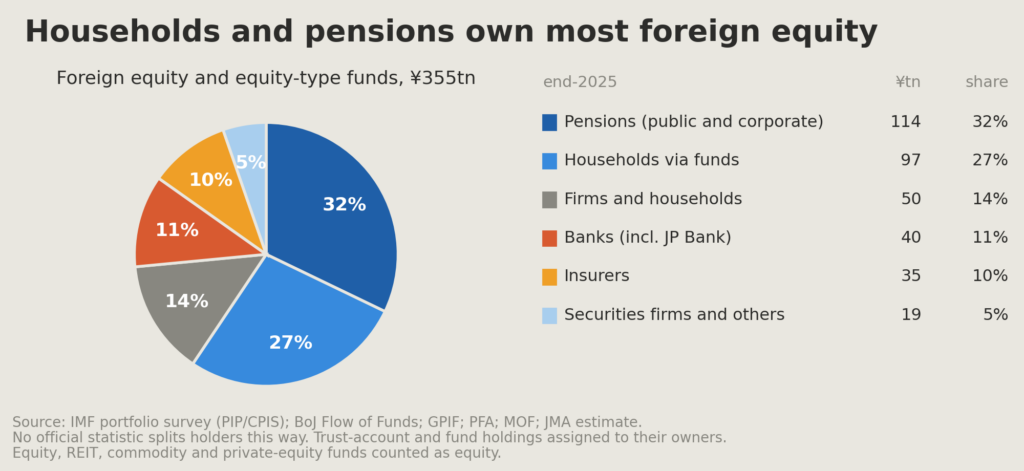
Chart 7: End-2025, JMA estimates. Equity and equity-type funds; trust-account and fund holdings are assigned to their owners. Source: IMF, GPIF, BoJ, MOF, PFA, JMA.
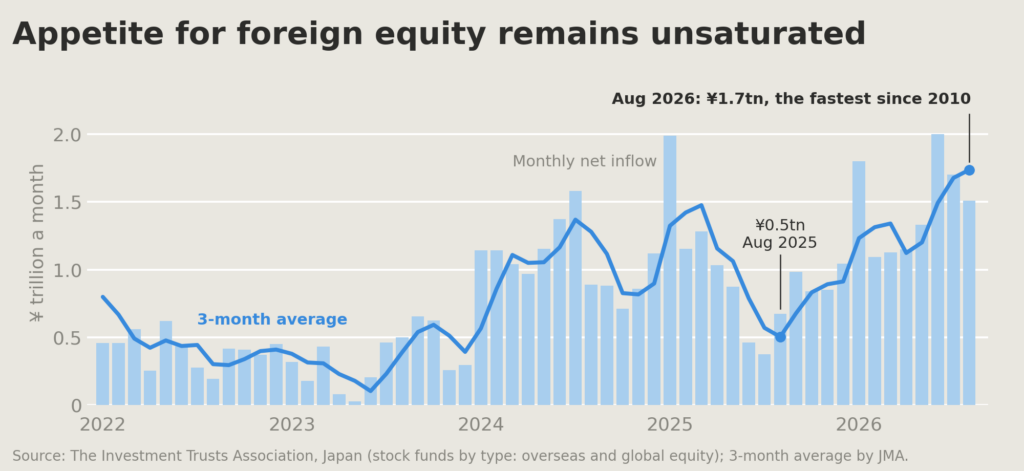
Chart 8: Monthly net purchase of overseas- and global-equity investment funds. Source: ITA, JMA.
The strong appetite of households for foreign equity has been offset by selling by pension funds though. Over the twelve months to August, households bought ¥11.9trn of foreign equity through investment trusts, but pension funds through their trust accounts sold ¥11.5trn (chart 9).
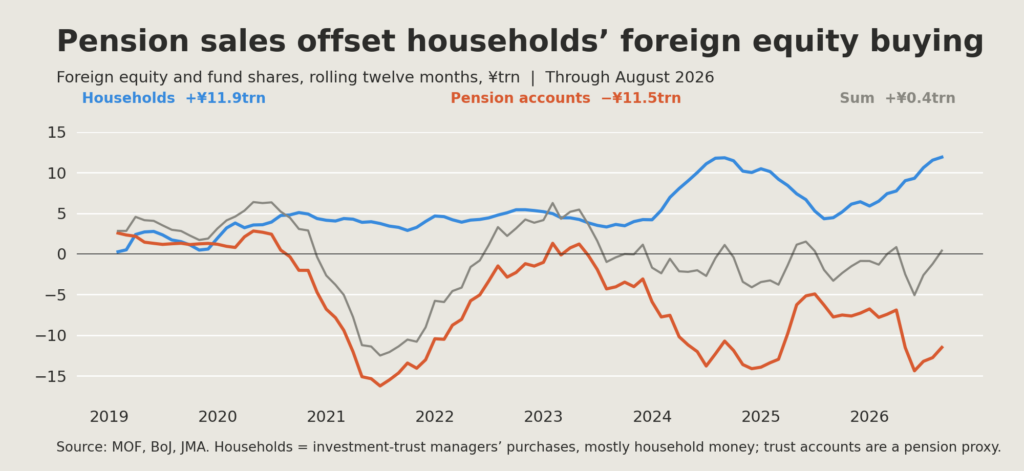
Chart 9: BoP rolling twelve-month flows through August. Households are investment-trust managers’ purchases. Trust accounts are a pension proxy. Source: MOF, BoJ, JMA.
Why do pensions sell what households buy? Pension funds typically manage their assets to target weights. When foreign equities outperform, they sell some and buy other assets to restore the balance.
Part 3. Pension funds to put more money in yen
GPIF likely to raise its asset allocation into yen bonds
As you can see in the two pie charts (charts 3 and 7), GPIF and other pension funds are key players in Japan’s investments in foreign bonds and equity. GPIF, with ¥320trn of assets under management, is the big whale, and changes in its asset allocation have played a significant role in defining Japan’s cross-border capital flows in recent years.
For details on my views on GPIF, I refer readers to the “GPIF the Whale” report. Here is the gist. GPIF reduced its domestic-bond allocation target from 60% to 35% in 2014 and to 25% in 2020, partly to protect the fund from a JGB crash it saw coming (chart 10). The crash has already happened, in slow motion over the last two years. When GPIF last reviewed the asset allocation in early 2025, maintaining the target unchanged at 25% made sense. At the time, JGB yields had more room to “normalize”, and they did. Please see my report The Long Climb in JGB Yields Is Nearly Over (20 July) for why I think the normalization is largely over.
On my simplified replication of GPIF’s allocation rule, a zero expected real return on JGBs points to a domestic-bond weight of about 50%, against 25% today. A move to 50% means about ¥80trn of assets shifting toward yen bonds, and foreign bonds are the likely asset class to give way. For more details, please see Yen Repatriation Starts with the Whale (10 September). It is a tricky shift, as GPIF is a classic whale in financial jargon, and there is a legitimate concern that other investors could front-run it. But GPIF cannot ignore the asset-allocation arithmetic. GPIF’s July–September results, due in early November, are the first place a shift could show, but even if it doesn’t, it is just a matter of time in my view, as GPIF would be doing Japanese pensioners a disservice if it did not change the allocation.
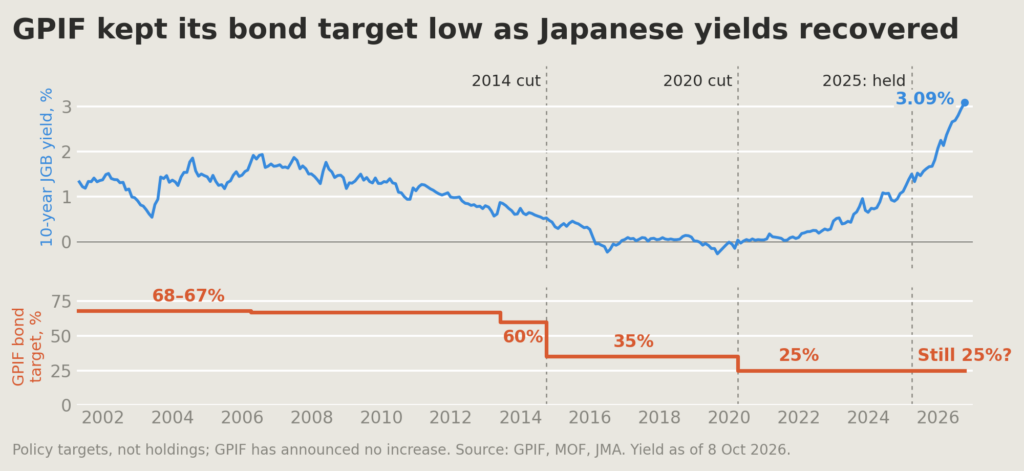
Chart 10: GPIF policy targets for domestic bonds and 10-year JGB yield, through 8 October 2026. Source: GPIF, MOF, JMA.
Part 4. Recent development and what to watch
Weekly data shows bond selling continuing into October
The balance of payments is the key statistic for monitoring cross-border capital flows, but as of mid-October it runs only to August. The Ministry of Finance’s weekly survey of large investors is a good leading indicator and runs to 10 October. In the four weeks to 10 October, Japanese investors sold a net ¥3.3trn of foreign long-term bonds. Chart 11 shows the 52-week and 13-week averages.
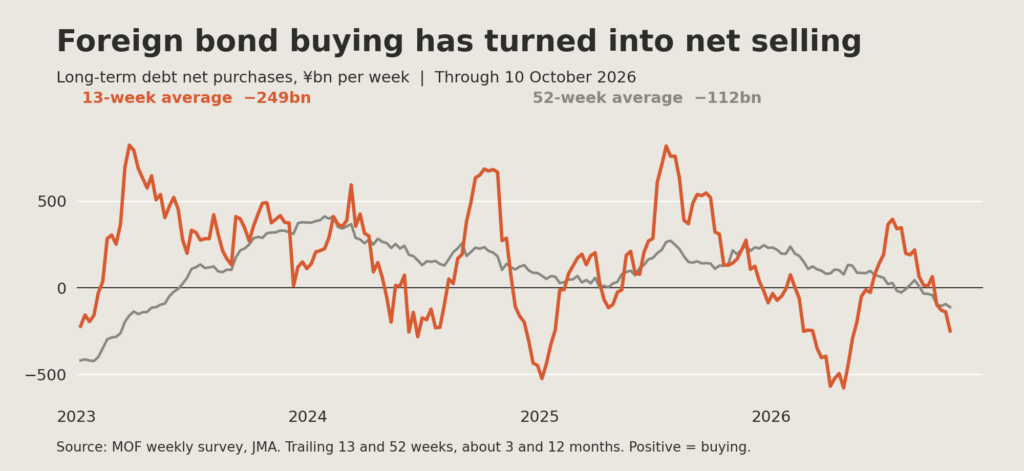
Chart 11: MOF weekly survey of designated major investors. 13- and 52-week trailing averages, approximately three and twelve months, through 10 October. Both lines show average net purchases per week, not cumulative totals. Source: MOF, JMA.
Equity flows have no sustained direction
The same weekly survey includes equity flows. They have some ups and downs, but the 52-week average is hugging the zero line, and I do not see any particular trend upward or downward (chart 12). The equity data add no repatriation signal to the bond evidence.
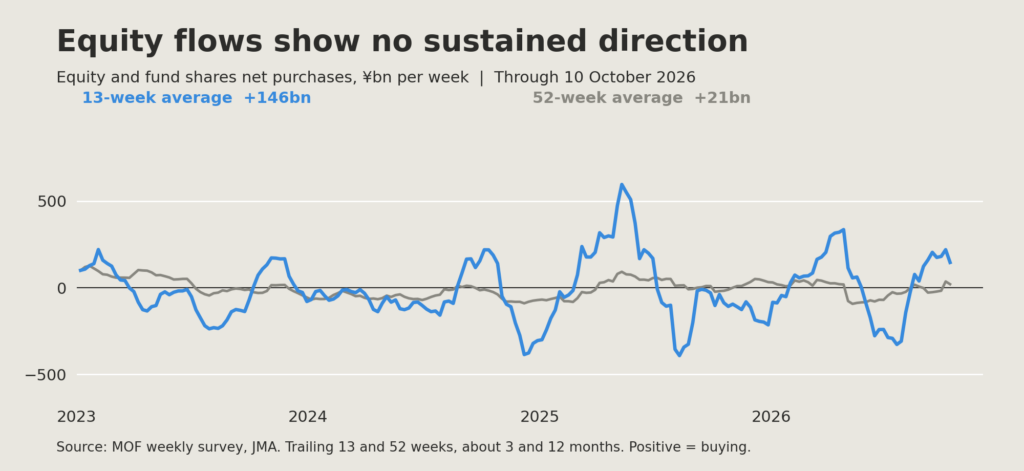
Chart 12: Same weekly survey, smoothing windows, dates and vertical scale as Chart 11; foreign equity and fund shares. The 13-week line shows recent swings; the 52-week line shows the smaller underlying net flow. Source: MOF, JMA.
What to watch
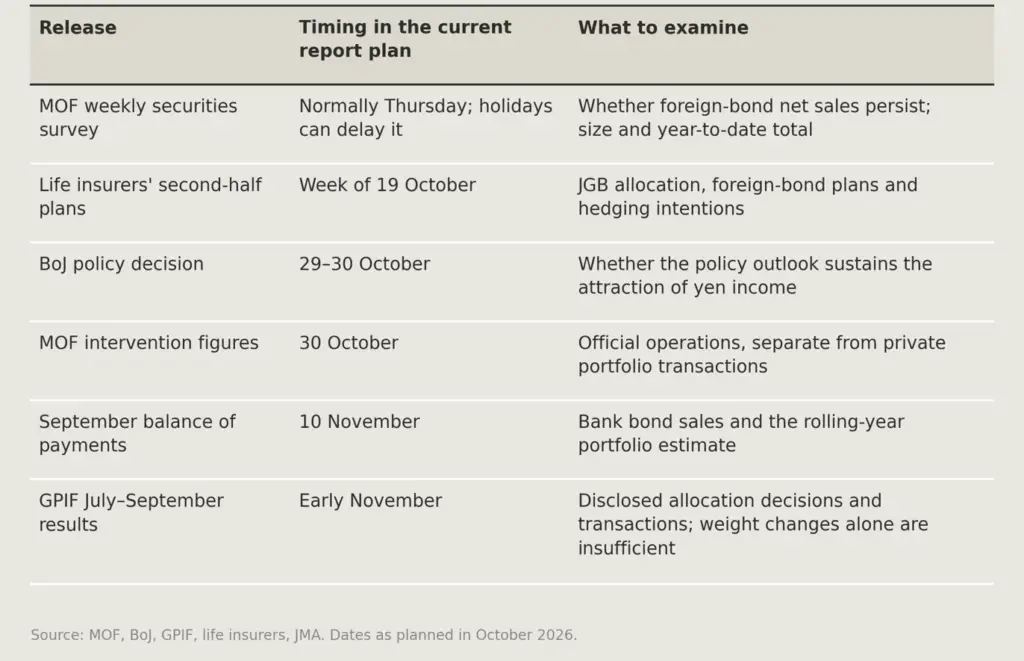
The weekly survey is the first test of whether bond sales persist. The September balance of payments, due in early November, will test the estimate in the opening. The other releases are in the table below.
Conclusion
The capital-flow tide is turning
As this report showed, Japan has been a broadly consistent provider of capital to the rest of the world, and Japan will continue to play that role for many years to come. However, the tide turns from time to time, and 2026 seems to be such a year. Net portfolio flow has narrowed from a sizable outflow in 2024–25 to a small net sale in the latest months, even while households continued to show strong appetite for foreign equity. Banks seem to be increasing their appetite for yen bonds, with good reason. JGB yields have risen to a 30-year high. Some may claim the rise has to do with higher fiscal premia, but my yield-curve analysis in Japan’s Fiscal Vigilantes Are Misreading the Curve (16 July) shows otherwise.
In my view, this shift weakens one of the forces behind the weak yen. Higher yen yields give investors a reason to keep shifting toward domestic bonds. I see a moderate chance that the turn in foreign bonds develops into a larger net repatriation, with GPIF’s asset allocation decision as a potential key mover. If global financial markets were to suffer a setback, whether in the euro bond market or the US stock market, it would further strengthen the case for yen repatriation. In my view, Japan’s capital flows are likely to show yen repatriation in 2026–27; the question is how large, rather than whether it will happen.