Economics-Watching: Kuwait’s Banking Sector Posts Solid Credit Growth in October

[from NBK Group’s Economic Research Department, 21 November, 2024]

Kuwait: Solid credit growth in October driven by household credit. Domestic credit increased by a solid 0.4% in October, driving up YTD growth to 2.9% (3.2% y/y). The recovery in household credit continued, with growth in October at a solid 0.5%, resulting in a YTD increase of 2.4%. While y/y growth in household credit remains a limited 2.3%, annualized growth over the past four months is a stronger 4.7%. Business credit inched up by 0.2% in October, pushing YTD growth to 3.6% (2.9% y/y). Industry and trade drove business credit growth in October while construction and trade are the fastest growing YTD at 17% and 8%, respectively. In contrast, the oil/gas sector continued its downtrend, deepening the YTD decrease to 13%. Excluding the oil/gas sector, growth in business credit would increase to a relatively good 5% YTD. Looking ahead, the last couple of months of the year (especially December) are usually the weakest for business credit, likely due to increased repayments and write-offs, but it will not be surprising if the recovery in household credit is generally sustained, especially given the commencement of the interest rate-cutting cycle. Meanwhile, driven by a plunge in the volatile public-institution deposits, resident deposits decreased in October, resulting in YTD growth of 2.4% (4.2% y/y). Private-sector deposits inched up in October driving up YTD growth to 4.5% compared with 10% for government deposits while public-institution deposits are a big drag (-14%). Within private-sector KD deposits, CASA showed further signs of stabilization as there was no decrease for the third straight month while the YTD drawdown is a limited 1%.

Chart 1: Kuwait credit growth

(% y/y)

Source: Central Bank of Kuwait (CBK)
Chart 2: UK inflation

(%)

Source: Haver

Egypt: IMF concludes mission for fourth review, sees external risks. The IMF concluded its visit to Egypt after spending close to 2 weeks, holding several in-person meetings with the Egyptian authorities, private sector, and other stakeholders. The IMF released a statement mentioning that the current ongoing geopolitical tensions in the region in addition to an increasing number of refugees have affected the external sector (Suez Canal receipts down by 70%) and put severe pressure on the fiscal front. The Fund acknowledged the Central Bank of Egypt’s commitment to unify the exchange rate, maintain the flexible exchange rate regime, and keep inflation on a firm downward trend over the medium term by substantially tightening monetary policy. It also highlighted that continued policy discipline was also a key to containing fiscal risks, especially those related to the energy sector. The Fund, as always, re-iterated the need for promoting the private sector mainly through an enhanced tax system and accelerating divestment plans of the state firms. Finally, it also said that the discussions would continue over the coming days to finalize the agreement on the remaining policies and reform plans. However, the release did not provide any clear hints about the conclusion on the government’s earlier request to push the timeline of some of the subsidy moves.

Oman: IMF completes article IV with a strong outlook for the economy in 2025. Oman’s economy continued to expand with growth reaching 1.9% in the first half of 2024 (versus 1.2% in 2023), despite being weighed down by OPEC+ mandated oil production cuts as non-oil GDP grew a stronger 3.8% y/y in H1 (versus 1.8% in 2023). The fiscal and current account balances remain in a comfortable situation evident by a decline in public sector debt and the recent rating upgrade to investment grade. The Fund expects Oman’s economic growth to see a strong rebound in 2025, supported by higher oil production. It also believes that fiscal and current account balances will remain in surplus but at lower levels. Key risks to the outlook stem from oil price volatility and intensifying geopolitical tensions. The IMF also mentioned that further efforts are needed to raise nonhydrocarbon revenues through more tax policy measures and the phasing out of untargeted subsidies which should help in freeing up resources to finance growth under the government’s diversification agenda.

UK: Inflation rises more than forecast, reinforcing BoE’s caution on rate cuts. UK CPI inflation increased to 2.3% y/y in October from 1.7% the previous month, slightly above the market and the Bank of England’s forecast of 2.2%. On a monthly basis too, inflation rose to 0.6%, a seven-month high, from September’s no change. The steep rise was mainly driven by an almost 10% rise in the household energy price cap effective from October. Core inflation also accelerated to 3.3% y/y (0.4% m/m) from 3.2% (0.1% m/m). While goods prices continued to fall (-0.3% y/y), service prices rose at a faster rate of 5% from 4.9%. Recently, the Bank of England had cautioned about inflation quickening next year (projecting a peak rate of 2.8% in Q3 2025), citing the impact of higher insurance contributions and rising minimum wages as outlined in the latest government budget. Therefore, with inflation rising above forecast, the bank will likely slow the pace of monetary easing after delivering two interest rate cuts of 25 bps earlier, with markets now seeing only two additional cuts by the end of 2025.

Eurozone: ECB warns of fiscal and growth risks in its latest Financial Stability Review [archived PDF]. In its most recent Financial Stability Review (November) [archived PDF], the European Central Bank warned that elevated debt and fiscal deficit levels and anemic long-term growth could expose sovereign debt vulnerabilities in the region, stoking concerns of a repeat of the 2011 sovereign debt crisis. Maturing debt being rolled over at much higher borrowing rates raising debt service costs poses risks to countries with little fiscal space and leaves certain governments exposed to market fluctuations. The bank also emphasized the risks of high equity valuations, low liquidity and a greater concentration of exposure among non-banks. Moreover, it sees current geopolitical uncertainties and the possibility of more trade tensions as heightening risks. The Eurozone’s current government debt-to-GDP ratio stands at 88%, but the underlying data suggest a much more precarious situation with Greece, Italy, and France’s ratios at 164%, 137% and 112%. Recently, concerns about France’s high fiscal deficit (around 5.9% of GDP) and elevated debt levels saw yields on the country’s bonds rise steeply, widening the spread gap with German bonds to the highest level in over a decade.

Stock marketsIndexDaily Change (%)YTD Change (%)
Regional
Abu Dhabi (ADI)9,405-0.23-1.80
Bahrain (ASI)2,043-0.373.62
Dubai (DFMGI)4,7610.6117.26
Egypt (EGX 30)30,588-0.33 23.18
GCC (S&P GCC 40)7090.09-0.52
Kuwait (All Share)7,353-0.087.86
KSA (TASI)11,868-0.07-0.83
Oman (MSM 30)4,6090.002.10
Qatar (QE Index)10,4380.12-3.62
International
CSI 3003,9860.2216.17
DAX19,005-0.2913.45
DJIA43,4080.3215.17
Eurostoxx 504,730-0.454.60
FTSE 1008,085-0.174.55
Nikkei 22538,352-0.1614.61
S&P 5005,9170.0024.05
3m interbank rates%Daily Change (bps)YTD Change (bps)
Bahrain5.86-1.29-66.34
Kuwait3.940.00-37.50
Qatar6.000.00-25.00
UAE4.433.81-89.96
Saudi5.50-4.75-73.14
SOFR4.52-0.09-81.13
Bond yields%Daily Change (bps)YTD Change (bps)
Regional
Abu Dhabi 20274.665.0033.9
Oman 20275.496.0033.0
Qatar 20264.686.0016.1
Kuwait 20274.693.0035.0
Saudi 20284.961.0043.9
International 10-year
US Treasury4.411.7755.3
German Bund2.340.3531.2
UK Gilt4.472.6093.0
Japanese Gov’t Bond1.071.045.4
Exchange ratesRateDaily Change (%)YTD Change (%)
KWD per USD0.310.04-0.05
KWD per EUR0.32-0.46-1.98
USD per EUR1.05-0.49-4.47
JPY per USD155.430.5010.19
USD per GBP1.27-0.25-0.62
EGP per USD49.670.3461.00
Commodities$/unitDaily Change (%)YTD Change (%)
Brent crude72.81-0.68-5.49
KEC73.780.74-7.26
WTI68.87-0.75-3.88
Gold2,648.20.8028.40

Disclaimer: While every care has been taken in preparing this publication, National Bank of Kuwait accepts no liability whatsoever for any direct or consequential losses arising from its use. Daily Economic Update is distributed on a complimentary and discretionary basis to NBK clients and associates. This report and previous issues can be found in the “News & Insight / Economic Reports” section of the National Bank of Kuwait’s web site. Please visit their web site, nbk.com, for other bank publications.

Economic-Watching: County Employment & Wages – Second Quarter 2024

[from the U.S. Bureau of Labor Statistics, 20 November, 2024]

From June 2023 to June 2024, employment increased in 259 of the 369 largest U.S. counties, the U.S. Bureau of Labor Statistics reported today. In June 2024, national employment increased to 155.7 million, a 0.8-percent increase over the year, as measured by the Quarterly Census of Employment and Wages (QCEW) program. Kings, NY, had the largest over-the-year increase in employment, with a gain of 4.0 percent. Employment data in this release are presented for June 2024, and average weekly wage data are presented for second quarter 2024.

Among the 369 largest counties, 348 had over-the-year increases in average weekly wages. In the second quarter of 2024, average weekly wages for the nation increased to $1,390, a 4.4-percent increase over the year. Hamilton, IN, had the largest second quarter over-the-year wage gain at 33.4 percent. (See table 1 [archived PDF].)

Large County Employment in June 2024

Kings, NY, had the largest over-the-year percentage increase in employment (+4.0 percent). Within Kings, the largest employment increase occurred in education and health services, which rose by 37,473 (+10.3 percent).

Elkhart, IN, had the largest over-the-year percentage decrease in employment (-3.0 percent). Within Elkhart, the largest employment decrease occurred in manufacturing, which fell by 3,243 (-5.0 percent).

Large County Average Weekly Wage in Second Quarter 2024

Hamilton, IN, had the largest over-the-year percentage increase in average weekly wages (+33.4 percent). Within Hamilton, an average weekly wage gain of $2,161 (+139.6 percent) in professional and business services made the largest contribution to the county’s increase in average weekly wages.

Essex, MA, had the largest over-the-year percentage decrease in average weekly wages (-2.1 percent). Within Essex, an average weekly wage loss of $644 (-25.7 percent) in professional and business services made the largest contribution to the county’s decrease in average weekly wages.

Ten Largest Counties

Nine of the 10 largest counties had over-the-year percentage increases in employment. In June 2024, Miami-Dade, FL, had the largest over-the-year employment percentage gain (+1.5 percent). Within Miami-Dade, leisure and hospitality had the largest employment increase and rose by 3,530 (+2.4 percent). (See table 2 [archived PDF].)

All of the 10 largest counties had over-the-year percentage increases in average weekly wages. In the second quarter of 2024, King, WA, experienced the largest over-the-year percentage gain in average weekly wages (+10.4 percent). Within King, professional and business services had the largest impact, with an average weekly wage increase of $774 (+24.5 percent).

For More Information

The tables included in this release contain data for the nation and for the 369 U.S. counties with annual average employment levels of 75,000 or more in 2023. June 2024 employment and second quarter 2024 average weekly wages for all states are provided in table 3 [archived PDF] of this release.

Over-the-year changes of employment and wages presented in this news release are adjusted and may differ from unadjusted data used in BLS data tools and interactive charts. More information is available in the QCEW Technical Note.

QCEW reporting rates tables are available here.

The most current news release on quarterly measures of gross job flows is available from QCEW Business Employment Dynamics.

Several BLS regional offices issue QCEW news releases targeted to local data users. Links to these releases are available here.

QCEW data are available in the Census Business Builder suite of web tools, assisting business owners and regional analysts in data-driven decision making.

The QCEW news release schedule is available here.


The County Employment and Wages full data update for second quarter 2024 is scheduled to be released on Thursday, December 5, 2024, at 10:00 a.m. (ET).

The County Employment and Wages news release for third quarter 2024 is scheduled to be released on Wednesday, February 19, 2025, at 10:00 a.m. (ET).

The full report with tables [archived PDF].

Economics-Watching: Texas Service Sector Activity Flat, Outlook Continues to Worsen

[from The Federal Reserve Bank of Dallas]

Growth in Texas service sector activity stalled in October, according to business executives responding to the Texas Service Sector Outlook Survey.

Labor market indicators pointed to no growth in employment and a largely stable workweek,” said Jesus Cañas, Dallas Fed senior business economist. “Price pressures remained unchanged while wage growth eased slightly. Perceptions of broader business conditions continued to worsen in October, as pessimism notably increased.”

Key takeaways from the service sector survey:

  • The revenue index fell eight points to 0.7, with the near-zero reading suggesting little change in activity from September.
  • The employment index fell from 2.7 to 0.1, its lowest level in seven months.
  • The input prices index was flat at 37.3 and the selling prices index remained steady at 9.5.
  • The wages and benefits index fell two points to 17.0, approaching its average reading of 15.8.
  • The general business activity index dropped from -8.6 to -18.2, its lowest level since December of last year, while the company outlook index fell to -12.8, its lowest level in 16 months.

Texas Retail Sales Decline

Retail sales declined again in October while retail labor market indicators reflected a contraction in employment and workweeks,” Cañas said. “Retail labor market indicators reflected flat employment and workweeks. Retailers’ perceptions of broader business conditions were mixed.”

Key takeaways from the retail survey:

  • The sales index fell from -4.4 to -18.1, marking its sixth consecutive month in negative territory.
  • The employment index fell 13 points to -12.4 while the hours worked index fell from 0.6 to -12.1.
  • The general business activity index dropped from -10.2 to -23.0.

The Dallas Fed conducts the survey monthly to obtain a timely assessment of activity in the state’s service sector, which represents almost 70 percent of the state’s economy and employs about 9.5 million workers.        

For this month’s survey, Texas business executives were asked supplemental questions on credit conditions. Results for these questions from the Texas Manufacturing Outlook Survey, Texas Service Sector Outlook Survey and Texas Retail Outlook Survey have been released together.

Read the special questions results.

World-Watching: Atlanta Federal Reserve Wage Growth Tracker Was 6.1 Percent in January

[from the Federal Reserve Bank of Atlanta]

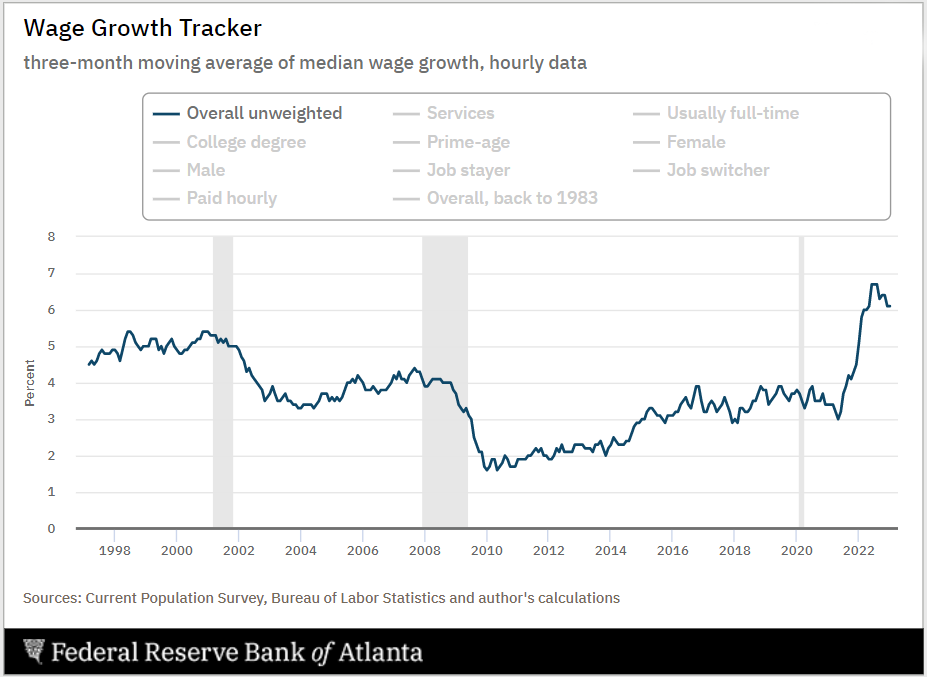
The Atlanta Fed’s Wage Growth Tracker was 6.1 percent in January, the same as in December. For people who changed jobs, the Tracker in January was 7.3 percent, compared to 7.7 percent in December. For those not changing jobs, the Tracker was 5.4 percent, compared to the 5.3 percent reading in December.

The Atlanta Fed’s Wage Growth Tracker is a measure of the nominal wage growth of individuals. It is constructed using microdata from the Current Population Survey (CPS), and is the median percent change in the hourly wage of individuals observed 12 months apart. This measure is based on methodology developed by colleagues at the San Francisco Fed.

The Wage Growth Tracker is updated once the Atlanta Fed’s CPS dataset is constructed (see the “Explore the Data” tab on that page). This is usually by the second Friday of the month. The exact timing depends on when the Bureau of the Census publishes the microdata from the CPS.

Stay informed of all Wage Growth Tracker updates by subscribing to the Atlanta Fed’s mailing listsubscribing to their RSS feeddownloading their EconomyNow app, or following the Atlanta Fed on Twitter. You can also build your own cuts of Wage Growth Tracker data using the CPS Data Application from CADRE or alternatively from here. Look for instructions and program files in the “Explore the Data” tab on the Wage Growth Tracker.

Economics-Watching: FedViews for January 2023

[from the Federal Reserve Bank of San Francisco]

Adam Shapiro, vice president at the Federal Reserve Bank of San Francisco, stated his views on the current economy and the outlook as of January 12, 2023.

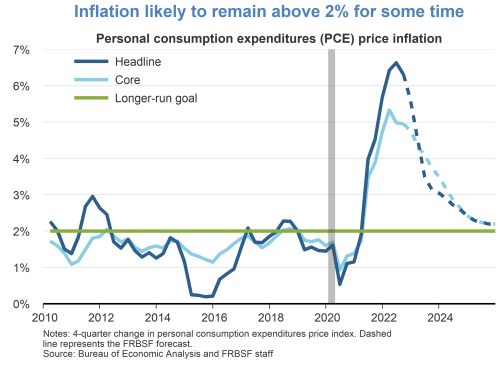
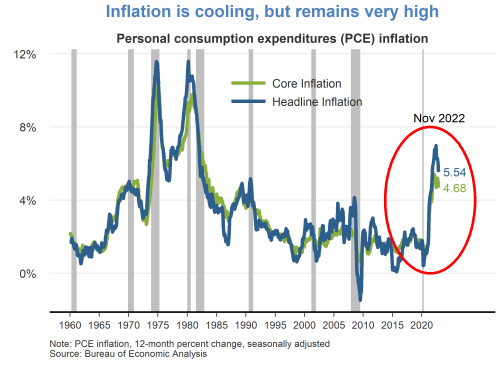
  • While continuing to cool over the last several months, 12-month inflation remains at historically high levels. The headline personal consumption expenditures (PCE) price index rose 5.5% in November 2022 from a year earlier. This marks a decline in inflation to a level last observed in October 2021, but still well above the Fed’s longer-run goal of 2%. A portion of the inflation moderation is attributable to recent declines in energy prices. Core PCE inflation, which removes food and energy prices, has shown less easing.
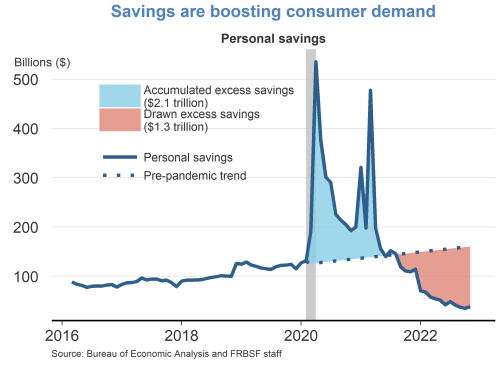
  • Owing to fiscal relief efforts and lower household spending over the course of the pandemic, consumers accumulated over $2 trillion dollars in excess savings, based on pre-pandemic trends. Since then, consumers have drawn down over half of this excess savings which has helped support recent growth in personal consumption expenditures. A considerable amount of accumulated savings remains for some consumers to support spending in 2023.
  • In the wake of the pandemic, consumer spending patterns shifted away from services towards goods. While there appears to be some normalization of spending behavior, this shift has generally persisted. Real goods spending remains significantly above its pre-pandemic trend, driven by strong demand for durables such as furniture, electronics, and recreational goods. Spending on services has shown a resurgence but remains below its pre-pandemic trend.
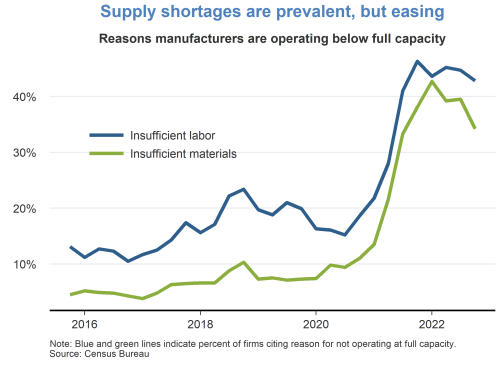
  • Supply chain bottlenecks for materials and labor remain a constraint on production, although there are some recent signs of easing. The fraction of manufacturers who reported operating below capacity due to insufficient materials peaked in late 2021 and has moderately declined over the past year. However, the fraction of manufacturers reporting insufficient labor has persisted at high levels.
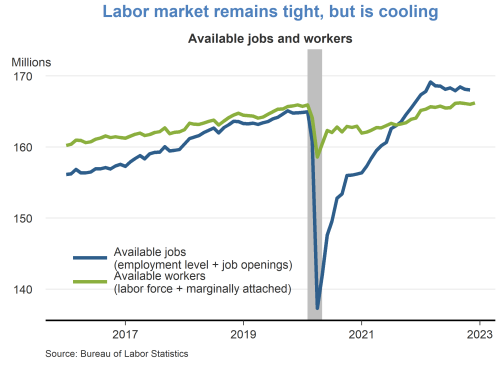
  • The labor market remains tight, despite some signs of cooling. The number of available jobs remains well above the number of available workers, although vacancy postings have been trending down in recent months. The tight labor market has put continued upward pressure on wages and labor market turnover.
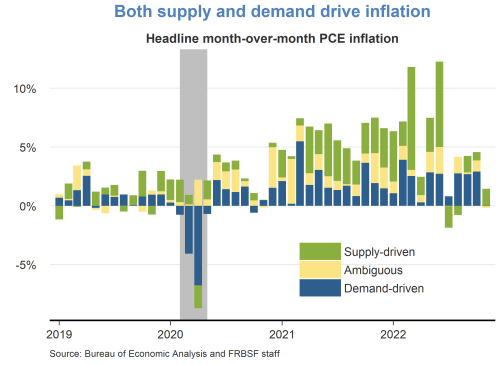
  • A decomposition of headline PCE inflation into supply– and demand-driven components shows that both supply and demand factors are responsible for the recent rise in inflation. The surge in inflation in early 2021 was mainly due to an increase in demand-driven factors. Subsequently, supply factors became more prevalent for the remainder of 2021. Supply-driven inflation has moderated significantly over recent months, while demand-driven inflation remains elevated.
  • The Federal Open Market Committee (FOMC) raised the federal funds rate by 50 basis points at the December meeting to a range of 4.25 to 4.5%. This cycle of continued rate increases since March of last year represents the fastest pace of monetary policy tightening in 40 years. The increase in the federal funds rate has been accompanied by a gradual reduction in the size of the Federal Reserve’s balance sheet.
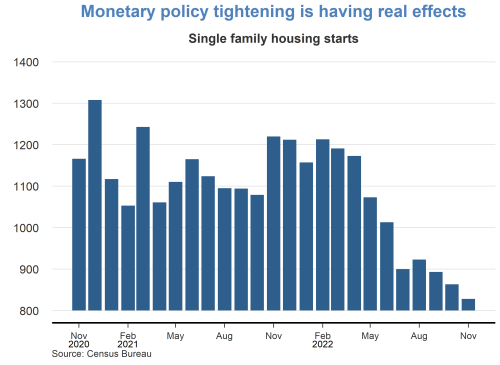
  • Economic activity in sectors such as housing, which is sensitive to rising interest rates, has slowed considerably in recent months. Housing starts have fallen steadily over the past year, as have other housing market indicators, such as existing home sales and house prices.
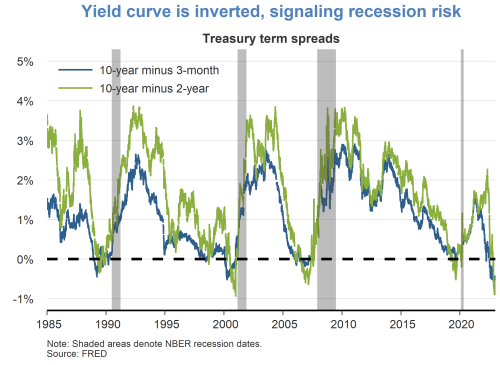
  • Although the labor market is currently very strong, financial markets are pointing to some downside risks. Namely, the difference between longer- and shorter-term interest rates has turned negative, which historically tends to occur immediately preceding recessions. It remains unclear whether lower longer-term yields are indicative of anticipated slower growth or lower inflation.
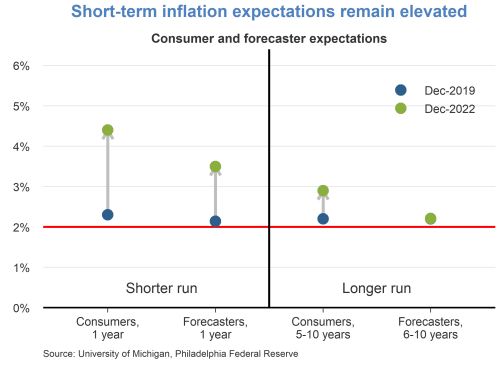
  • Short-term inflation expectations remain elevated relative to their pre-pandemic levels in December 2019. Consumers are expecting prices to rise 5% this year, while professional forecasters are expecting prices to rise 3.5%. Longer-term inflation expectations remain more subdued, indicating that both consumers and professionals believe inflation pressures will eventually dissipate.
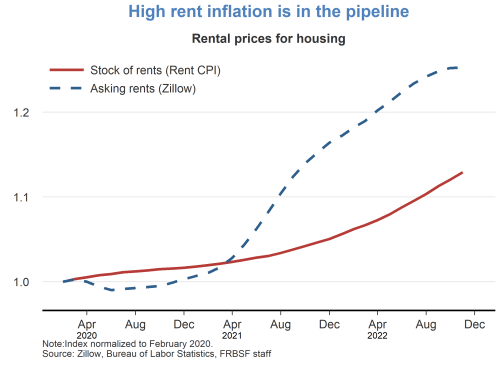
  • Rent inflation is expected to remain high over the next year. The prices for asking rents have grown quite substantially over the last two years. As new leases begin and existing leases are renewed, these higher asking rents will flow into the stock of rental units, putting upward pressure on rent inflation.
  • We are expecting inflation to moderate over the next few years as monetary policy continues to restrain demand and supply bottlenecks continue to ease. We anticipate that it will take some time for inflation to reach the Fed’s longer-run goal of 2%.
Inflation is cooling, but remains very high
Savings are boosting consumer demand
Goods consumption remains elevated
Supply shortages are prevalent, but easing
Labor market remains tight, but is cooling
Both supply and demand drive inflation
Monetary policy tightening is having real effects
Yield curve is inverted, signaling recession risk
Short-term inflation expectations remain elevated
High rent inflation is in the pipeline
Inflation likely to remain above 2% for some time

[Archived PDF]

Read other issues from FedViews.

Essay 79: Past and Present Thinking

History is “forever new” and we keep asking “what’s new?” but the past is “forever suggestive” and so we inquire here as to whether the past gives us interesting echoes of the more recent.

Specifically, we juxtapose the “closing of the gold window” in August 1971 (Nixon) and the British gold standard gyrations between 1925 and 1931, when England left gold (i.e., September 1931).

At the time, under Nixon, the U.S. also had an unemployment rate of 6.1% (August 1971) and an inflation rate of 5.84% (1971).

To combat these problems, President Nixon consulted Federal Reserve chairman Arthur Burns, incoming Treasury Secretary John Connally, and then Undersecretary for International Monetary Affairs and future Fed Chairman Paul Volcker.

On the afternoon of Friday, August 13, 1971, these officials along with twelve other high-ranking White House and Treasury advisors met secretly with Nixon at Camp David. There was great debate about what Nixon should do, but ultimately Nixon, relying heavily on the advice of the self-confident Connally, decided to break up Bretton Woods by announcing the following actions on August 15:

Speaking on television on Sunday, August 15, when American financial markets were closed, Nixon said the following:

“The third indispensable element in building the new prosperity is closely related to creating new jobs and halting inflation. We must protect the position of the American dollar as a pillar of monetary stability around the world.

“In the past 7 years, there has been an average of one international monetary crisis every year …

“I have directed Secretary Connally to suspend temporarily the convertibility of the dollar into gold or other reserve assets, except in amounts and conditions determined to be in the interest of monetary stability and in the best interests of the United States.

“Now, what is this action—which is very technical—what does it mean for you?

“Let me lay to rest the bugaboo of what is called devaluation.

“If you want to buy a foreign car or take a trip abroad, market conditions may cause your dollar to buy slightly less. But if you are among the overwhelming majority of Americans who buy American-made products in America, your dollar will be worth just as much tomorrow as it is today.

“The effect of this action, in other words, will be to stabilize the dollar.”

Britain’s own experience in the twenties is explained like this:

“In 1925, Britain had returned to the gold standard.

(editor: This Churchill decision was deeply critiqued by Keynes.)

“When Labour came to power in May 1929 this was in good time for Black Friday on Wall Street in the following October.

“After the Austrian and German crashes in May and July 1931, Britain’s financial position became critical, and on 21st September she abandoned the gold standard.

London was still the world’s financial capital in 1931, and the British abandonment of the gold standard set off a chain of reactions throughout the world.

“Strangely enough Germany and Austria maintained the gold standard…”

(Europe of the Dictators, Elizabeth Wiskemann, Fontana/Collins, 1977, page 92-93)

Nixon’s policies gave us the demise of Bretton Woods, while the economic gyrations of 1925-1931 were part of the lead-up to World War II.

The setting is both “infinitely different” across the decades but the feeling of “flying blind” applies to both cases: U.S.A. “closing the gold window,” August 1971 and Britain’s overturning Churchill’s 1925 return to the gold standard, by 1931. One gets the sense of “concealed turmoil” and a lot of “winging it” in both cases. Policy-makers disagreed and they all saw the world of their moments “through a glass, darkly.”

Essay 50: Useful Data From the Bureau of Economic Analysis

Useful Data for Every Student Whatever your Major in College.

The U.S. Bureau of Economic Analysis

BEA News: Personal Income and Outlays, September 2019

The U.S. Bureau of Economic Analysis (BEA) has issued the following news release today:

Personal income increased 0.3 percent in September after increasing 0.5 percent in August. Wages and salaries, the largest component of personal income, showed no change in September after increasing 0.6 percent in August. 

“The full text of the release [archived PDF] on BEA’s website can be found here

“The Bureau of Economic Analysis provides this service to you at no charge.  Visit us on the Web at www.bea.gov. All you will need is your e-mail address.  If you have questions or need assistance, please e-mail customerservice@bea.gov.”

Essay 47: Novels as a Kind of University Demonstrating Storms of Global Finance and Technification

Edith Wharton began writing The Age of Innocence in 1917 as a way of recalling and criticizing the world of her youth, which had not yet experienced the devastation of World War I (1914–18).  Beginning in July 1920, the novel was published in serial form in New York’s monthly Pictorial Review.

The centrality of finance and technical change can be seen. We are reminded of the very first line in The Magnifcent Ambersons of Booth Tarkington, which tells the reader that the basis of the magnificence of the Ambersons was established when they somehow benefited from the 1873 financial crisis which destroyed many others. (Whether the Ambersons were shrewd or lucky or wily is not clarified.)

The Age of Innocence is set in New York in the 1870s and the financial storm and “techno-storm” become vital:

The Panic of 1873:

In The Age of Innocence, the investment bank run by Julius Beaufort collapses, bringing shame upon him and his wife and throwing New York into a tizzy. Beaufort’s business failure is a fictionalized version of the Panic of 1873, industrial capitalism’s first worldwide depression. Then, the United States backed its currency with both silver and gold, but when Germany and several other countries stopped using silver to back their currency, the price of silver fell precipitously, devaluing U.S. currency. The U.S. Treasury made matters worse by releasing large amounts of paper money into the economy. Speculators and bankers now had to immediately pay off their debts with gold.

In 1873, a prominent investment banker by the name of Jay Cooke went bankrupt, the effects rippled throughout the entire U.S. economy, and panic ensued. Trading was suspended for two weeks on the New York Stock Exchange as company after company failed, wages dropped precipitously, and unemployment spiked. The rise of the labor movement can be traced to the widespread unrest and economic instability set off by the panic. Additionally, the panic allowed a few of the wealthiest businessmen—such as Andrew Carnegie, John Rockefeller, and Cyrus McCormick, who retained access to valuable capital—to vastly increase their wealth and snuff out competitors.

Technological Advancements

Characters in The Age of Innocence are aware their world is about to be forever changed by the culture of outsiders, brought to them in part by advancements in technology. Although inventions like the telephone were on the horizon, they seemed improbably fantastic to people living in the early 1870s world of telegrams and horse-drawn carriages. However, in the final chapter, Wharton depicts Newland Archer living in a world that has been significantly altered by these technologies, a mere quarter century later.

In 1876, for example, American inventor Alexander Graham Bell (1847-1922) patented an early telephone and wowed audiences by demonstrating the world’s first telephone call by placing a call from one telegraph station to another five miles away.  The Western Union company refused to buy Bell’s telephone patent, claiming his invention would amount to no more than a novelty. However, the first telephone line was built in 1877-78, and after that, telephone usage skyrocketed.  At the start of the 1880s, there were almost 50,000 telephones in use, a number that swelled to over half a million by the turn of the century.

A similar large-scale change was the invention and development of electricity. Although the first electric light was developed in 1835, it was not until 1879 that American inventor Thomas Edison (1847-1931) developed and patented a light bulb with a life span of 15 hours. Edison’s work also focused on the problems of electrical generation and conductivity.

At the same time that communication was becoming easier and the day was lengthened artificially through electric lighting, the distance between continents was shortened by advances in turbine steam engines

In the 1860s, it took between eight and nine days to cross the Atlantic Ocean; by 1907, the Mauretania (the ship that Dallas and Newland Archer take to Europe in the last chapter) makes the voyage in half that time.  This was a contributing factor to the great influx of European immigrants who arrived in the United States during the late 19th and early 20th centuries.

In Chapter 29, Newland contemplates the “brotherhood of visionaries,” who predict a train tunnel under the Hudson River as well as “ships that would cross the Atlantic in five days … and other Arabian Night marvels.” In 1904, excavation for train tunnels under the Hudson began, directed by Alexander Cassatt, president of the Pennsylvania Railroad. In 1910, New York’s Penn Station opened and began receiving traffic from electric trains that traveled through the tunnels.

Notice that the novel The Magnificent Ambersons is from 1918, Edith Wharton’s Age of Innocence from 1920. In each, the personal storms of private emotion are somewhat carried along and swept up into the storms coming from national and even global finance (1873 caused a tremendous crash in Germany and Austria called the “Grunderkrach” [founder’s crash]) as well as techno-waves that are very baffling to the people of the time.
Essay 45: Then and Now Thinking: Facile Comparisons Lead to “Concept-Fraud”

The economist Arthur Laffer recently received an award from President Trump. Laffer wants to deceptively “cartoonize” reality by arguing that as taxes “go to 100%” (i.e., confiscation), output will go to zero and conversely as taxes “go to zero” output will go to “infinity.”

This is an example of playing with “bad infinities.”

This Laffer argument has been naively compared to David Hume’s economics:

“Back in the eighteenth century, the wise Scot David Hume anticipated David Hume in these 1756 words of sooth:

“‘Exorbitant taxes, like extreme necessity, destroy industry by producing despair; and even before they reach this pitch, they raise raise the wages of the laborer and manufacturer, and heighten the price of all commodities. An attentive disinterested legislature will observe the point where the emolument ceases and the prejudice begins.’”

(David Hume, Writings on Economics, ed. Eugene Rotwein, Edinburgh, Thomas Nelson and Sons, 1955, page 87)

(quoted in Greed is Not Enough: Reaganomics, Robert Lekachman, Pantheon Books, 1982, page 49)

Reaganomics and Laffer-nomics have nothing to do with David Hume and facile “then-and-now” comparisons, all of which are false since the “anarcho-capitalism” of Reagan/Thatcher views has noting to do with Hume

Thatcher said: “properly speaking, there is no such thing as society. There are only individuals.”

But Hume believes the exact opposite as a socially conscious brand of conservative:

Hume cherished the structures that sustain our social life. He was in this respect deeply conservative, in the good sense of the conservationist of the shapes and forms which these institutions have taken.

“And of course he was deeply mistrustful of any scatterbrained project of doing better, by promoting anarchism or society without government or law, or dismantling the institutions of contract or private property. 

“He would have had absolutely no patience whatsoever with the contemporary takeover of social ideals by monetary and market values.

“When free-marketeers say that there is no such thing as society, they are denying the very arches needed to sustain contracts, law, government, and markets in the first place, and then knavery loses its stigma, and we may well expect the worst, as their practice becomes ‘answerable’  to their ‘speculation.’”

(quoted in How to Read Hume, Simon Blackburn, Granta, 2008, page 70)

Deceivers make duplicitous linkages between hallowed names and ideas of the past and the dangerously “tricky” present.

Thus, Hume-to-Laffer linkages and trajectories makes no sense whatsoever. This is an example of “then-and-now thinking” used for “concept-fraud.”