Japan Inc. Now Sells No Yen to Invest Abroad

Earnings on Japan’s foreign direct investment (FDI) reached 103% of new FDI in 2022–25. With dividends and retained earnings counted together, Japan Inc. now needs to sell little yen to invest abroad.

[by OKUBO Takuji]

Key takeaways

  • Foreign affiliates now earn about as much as Japan invests abroad each year. Reinvested earnings, dividends and interest together reached 103% of new outward FDI in 2022–25, against 48% in 1996–2000.
  • Dividends from foreign affiliates account for a growing share of Japanese corporate profit. We estimate that foreign affiliates contributed 13.4% of Japan Inc.’s earnings in FY2025, up from 1.7% in FY1996.
  • Corporate investment abroad now involves little net yen selling. After dividends and interest paid home, the estimated outflow has been close to zero since 2022, down from about ¥5 trillion a year, or about 1% of GDP, on average in the 2010s.

Japan’s FDI stock now earns 103% of new investment

It is often said that Japan’s ageing population and slow growth give its companies too few investment opportunities at home. A Japanese government report in 2024 included the following passages.

“Japan’s ageing and shrinking population depresses expected demand at home. Expected returns remain higher abroad, so Japanese companies have accelerated outward direct investment” (my translation). — MATSUBAYASHI Yōichi [松林 洋一], MOF PRI, chapter 8, p.136.

“Companies invested abroad because they saw no promising investments in Japan; they are unlikely to bring back every return. On a cash-flow basis, the external balance is in deficit and is one factor behind the weak yen” (my translation). — KARAKAMA Daisuke [唐鎌 大輔], MOF PRI, chapter 10, pp.178 and 175.

However, my review of recent data shows that while their premise of low growth prospects in Japan is probably still right, the direct investment Japan has accumulated abroad has reached a level where it earns enough to cover Japan’s new investment abroad. This changes the exchange-rate implication even if Japan keeps investing abroad.

As chart 1 shows, earnings on the accumulated investment stock rose from 48% of new outward FDI in 1996–2000 to 103% in 2022–25.

Chart 1
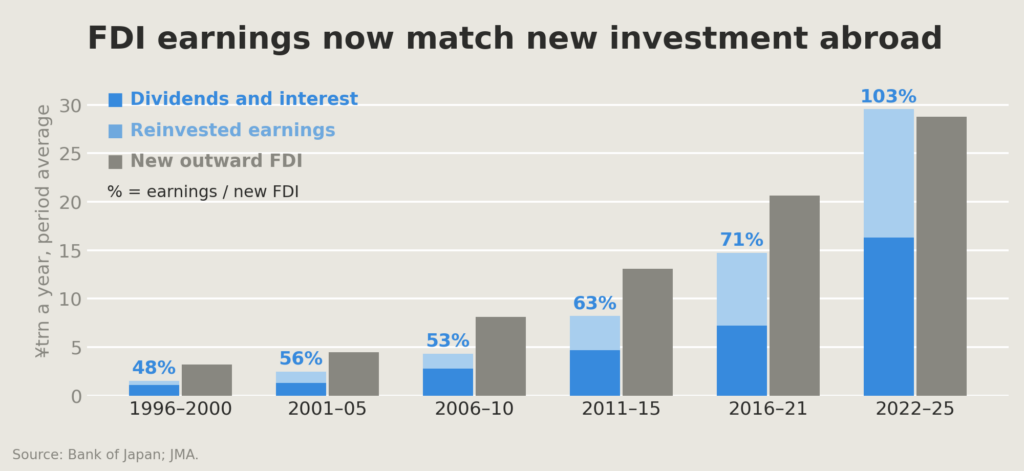
Overseas affiliates pay interest and dividends to their parent companies in Japan. Those dividends have become a sizable part of corporate Japan’s income: we estimate that they made up 13.4% of Japanese corporate profit in FY2025, up from 1.7% in FY1996.

When foreign affiliates retain their earnings on their balance sheets, Japan’s balance of payments statistics record them as FDI from Japan, even though no money crosses the border. While the companies receiving FDI dividends and the companies paying for new FDI are not necessarily the same, Japan Inc. as a whole is now financing its FDI almost entirely from the earnings of its overseas affiliates. At the current level of FDI, little new yen needs to be converted into foreign currencies as Japan goes about investing abroad.

In the rest of this report, I explain how foreign direct investment by Japanese companies evolved, and its near-term outlook. This report is the third in a series on the yen repatriation theme that I have published over the past few weeks, following “Yen Repatriation Starts with the Whale”, on capital flows through Japan’s national pension funds, and “Mrs Watanabe No More”, on Japanese households’ assets invested abroad.

A strong yen helped drive Japan’s first outward FDI boom

Japan’s outward investment was heavily restricted after WWII, requiring case-by-case permission from the government. Approvals became more and more automatic over the years until outward investment became “free in principle” in 1980. Trade friction with the US-led Japanese carmakers to restrain their exports from 1981, pushing them to build factories abroad. The rapid appreciation of the yen was also a factor. The yen strengthened from ¥242 per dollar before the Plaza Accord in September 1985 to ¥121 by the end of 1987. Japanese producers had to move lower value-added work abroad. The strong yen also gave Japanese financial institutions sizable purchasing power for a while, until the stock and property bubbles burst in 1990 and 1991.

All of these factors contributed to a rapid increase in outward FDI through the 1980s and 1990s (chart 2).

Chart 2

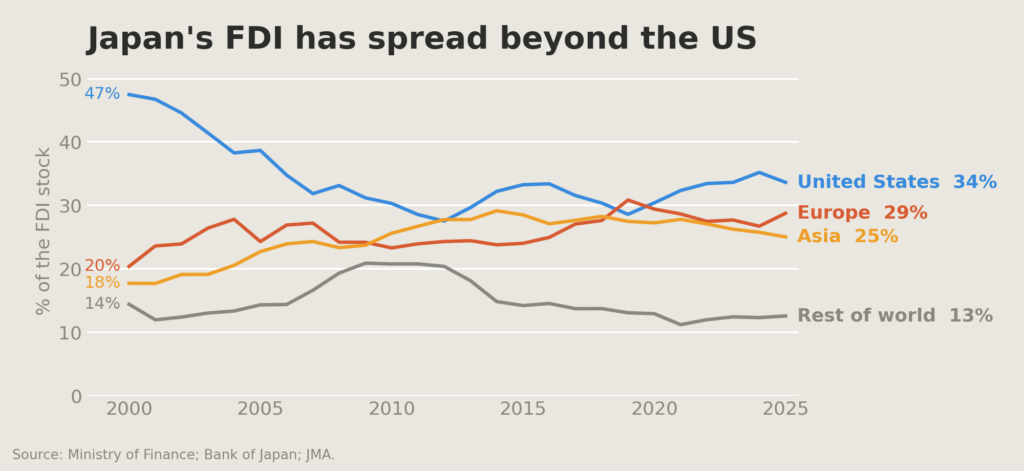
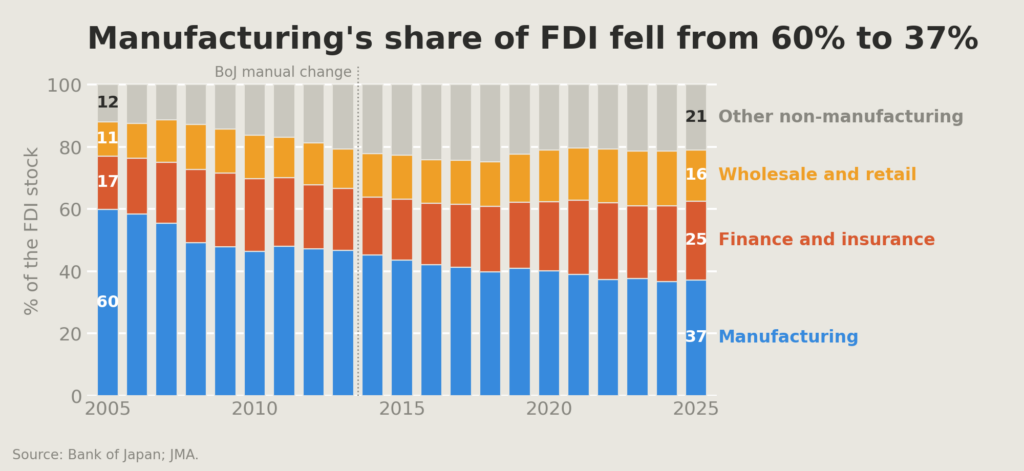
Even after the bubble burst, the strong yen kept pushing manufacturers to move abroad. In 2005, manufacturers accounted for 60% of the FDI stock. As Japanese manufacturers expanded their supply chains abroad, Asia’s share of outward FDI rose from about 12% in FY1986–90 to 19% in FY1995–99, and Asia held 23% of the FDI stock by 2005 (chart 3).

Chart 3
Japan’s outward FDI stock rose to 56% of GDP

The next phase was sustained by a different pressure. With weak growth and low interest rates at home, Japan Inc. kept investing abroad, across a broader range of industries. Between 1995 and 2025, the stock of FDI rose from 9% of Japan’s GDP to 58% (chart 4). In 2025, it is as large as about 38% of the private sector’s domestic fixed capital, on our estimate.

Chart 4

By industry composition and by destination compositions changed over time. Manufacturing’s share of the FDI stock had fallen to 37% by 2025, giving Japan’s FDI more breadth. By destination, we are seeing a revival of FDI toward the United States. It accounted for 34% of the stock in 2025, Europe 29% and Asia 25% (see earlier chart 3).
Thus, after decades of overseas investment, Japan’s FDI stock is now large enough that its earnings are sufficient to finance new investment abroad, at least for now. In the next section, I consider whether this will continue, and in particular whether Japanese companies may bring an even larger share of their overseas earnings back to Japan, given the weak yen, higher borrowing costs in yen and possibly better investment opportunities at home.

The weak yen has slowed offshoring, not reversed it

The real depreciation of the yen over the past 15 years made production in Japan more competitive. There is some evidence that manufacturers are considering bringing production back to Japan. The 2023 manufacturing white paper found more firms shifting production back from China than moving there, and they named the weak yen as one reason. We see some signs of reshoring. Japanese manufacturers’ overseas production ratio rose from 18.0% in FY2011 to 27.2% in FY2023, but it may have started to decline or at least stabilize. The ratio fell to 26.7% in FY2024. A Cabinet Office survey of listed manufacturers puts the ratio at 24.5% in FY2025, and their plan for FY2030 is broadly unchanged at 24.7%. The weak yen seems to have stabilized the wave of offshoring, but I see no firm evidence of a move back onshore yet.

Domestic investment has grown slowly despite the weak yen

There are tentative signs that domestic capital spending is starting to grow again. For three decades it grew at a very low speed. In real terms, private business investment rose only 26% between FY1997 and FY2025, less than 1% a year. In comparison, capital spending grew by about 4% a year on average in the United States. In my view, a weak currency is only one of the factors manufacturers weigh in designing their global production chains. The weak yen makes production in Japan competitive today, but they have also seen the exchange rate swing violently within short periods. Japan also has a shrinking population problem. It started to address it by opening a door to immigration, but the door is only tentatively open. Overall, my view is that the weak yen alone is unlikely to give Japan Inc. sufficient incentive to bring its capital back to Japan and to the yen.

Economic security is bringing some production home

The government is pushing harder than the currency, mostly in the name of economic security, even before the Takaichi government came along. The government currently has a ¥250 trillion domestic investment target for FY2040 and named AI and semiconductors among its 17 strategic fields. Semiconductors are where the money has gone furthest. In November 2024, under the Ishiba government, Japan committed more than ¥10 trillion of public support to AI and semiconductors by FY2030, aiming to draw more than ¥50 trillion of public and private investment over ten years. Japan managed to lure a TSMC plant to Japan, backed by a sizable subsidy. Rapidus, a government-supported Japanese semiconductor maker, has received a sizable subsidy and is building a factory in Hokkaido. Japan’s production of integrated circuits and discrete semiconductors rose from ¥2.7 trillion in 2019 to ¥4.1 trillion in 2025.

Under the name of economic security, the Japanese government is promoting other industries such as batteries, shipbuilding and pharmaceuticals. Defence spending adds to the push. Japan’s defence budget rose from about ¥5 trillion in FY2022 to ¥9.0 trillion in FY2026. Some defence contractors, such as Mitsubishi Heavy Industries, have doubled their defence revenue.

Japan’s industrial-policy record gives reason for caution

The Japanese government and the Ministry of Economy, Trade and Industry (METI), the key agency behind Japan’s industry policy, may claim some expertise in their industrial policies. Empirical studies in the past paint a poor track record, though. Rapidus, the most ambitious semiconductor project, has had no independent cost-benefit assessment (Negrine et al., 2025). While defence and economic security-driven policies have a different logic, I doubt that these industrial policies will succeed in bringing large-scale manufacturing investment back to Japan so long as macro factors such as Japan’s demography remain unfavourable.

FDI no longer appears to drive yen weakness

The weak yen and non-economic geopolitical factors do point to a halt in Japan’s four-decade offshoring trend, although it is a stabilization, rather than an economy-wide reversal of past offshoring. Japan Inc. will continue to invest more abroad, rather than within its borders. Given the sizable growth in the stock of cumulative FDI, Japan Inc. no longer needs to convert yen into overseas currency to keep investing abroad though. Net of dividends and interest paid home, Japan’s FDI sold about ¥5 trillion of yen a year, or about 1% of GDP, on average in the 2010s; since 2022 the net flow has been close to zero. There is also an interesting development in an effort to allow more share-exchange based M&A for cross-border deals that will further reduce the need for Japanese companies to spend their yen to purchase overseas assets. In my view, Japan Inc.’s FDI is no longer a factor to drive the yen weaker.

References

Education and Seeing the “Swirl” of History

The tempo and rhythm of world events and world history are not captured in the linear and bland books one reads in schools and colleges where the sense of the stormy forward turbulence of the world is not communicated. Here’s an example that does communicate this “crazy dynamics”:

The leading historian, James Joll, in his excellent Europe Since 1870: An International History talks about gold and the gold standard in this way:

“The world supply of gold was diminishing, as the effects of the gold rushes in California and Australia in the 1850s and 1860s passed. This coincided with the decision in the 1870s of many of the leading countries to follow Britain’s example to use gold rather than silver as the basis of their currency — Germany in 1871, France in 1876 for example — so that the demand for gold rose just as the supply was temporarily declining. This in turn led to some doubt about the use of a gold standard and to much discussion about ‘bi-metallism’ and about the possibility of restoring silver to its place as the metal on which the world’s currency should be based, though this movement had more success in the United States than in Europe, where gold has now established itself firmly. By the 1890s however the discovery of new gold deposits in South Africa, Western Australia and Canada put an end to these discussions and uncertainties, as far as currency was concerned, for some fifty years.”

(James Joll, Europe Since 1870: An International History, Penguin Books, 1976, page 35)

These twists and turns and accidents or contingencies don’t communicate the real semi-turmoil surrounding all the decisions, which we can infer from the comment by a German politician in 1871, “We chose gold, not because gold was gold, but because Britain was Britain.” (Ian Patrick Austin, Common Foundations of American and East Asian Modernisation: From Alexander Hamilton to Junichero Koizumi, Select Publishing, 2009, page 99.)

Professor Joll delineates the emergent primacy of England:

“The establishment of London as the most important center in the world for shipping, banking, insurance-broking and buying and selling generally, as well as the growth of British industry, had been based on a policy of free trade.”

(James Joll, Europe Since 1870: An International History, Penguin Books, 1976, page 34)

The gold standard itself, dominated from London led to intricate problems: Golden Fetters: The Gold Standard and the Great Depression, 1919-1939 (published in 1992) by Barry Eichengreen, the leading historian of monetary systems, shows the downstream pitfalls of the gold standard.

In other words, the de facto emergence of Britain/London as the world commercial and policy center and the relation of this emergence to empire and international tensions and rivalries, means it is very problematical for any country to steer a course other than staying in tandem with British moods and ideologies, such as free trade. Any country by itself would find it difficult to have a more independent policy. (Friedrich List of Germany, who died in 1846, wrestles with these difficulties somewhat.) The attempts to find “autonomy and autarky” in the interwar years (Germany, Japan, Italy) led to worse nightmares. The world seems like a “no exit” arena of ideologies and rivalries.

The “crazy dynamics” and the semi-anarchy of the system, which continues to this day and is even worse, means that policy-making is always seen through a “dark windshield.”

History in the globalizing capitalist centuries, the nineteenth and the twentieth, is a kind of turbulent swirl and not a rational “walk.”

Economy Watching: Philadelphia Fed

from the Federal Reserve Bank of Philadelphia:

Fed President Patrick Harker Says It Will “Soon” Be Time to Taper Asset Purchases

Philadelphia Fed President Patrick Harker told a virtual audience at the Prosperity Caucus in Washington, D.C., that the asset purchases once necessary during the acute phase of the COVID-19 pandemic are no longer effective as a tool for supporting the economy. He also said the U.S. economy created millions of jobs in recent months, but “we just can’t fill them.”

Economic Outlook: Growth Despite Constraints

Good evening! Thanks so much for having me. I understand that when this group meets in person there is usually pizza involved — so I intend to collect on that debt next time we do this in the flesh.

I plan to offer a few remarks about the state of the national economy and the path of Federal Reserve policy. Then we can move to our Q&A, which I’m really looking forward to.

But before I do that, I need to give you the standard Fed disclaimer: The views I express today are my own and do not necessarily reflect those of anyone else on the Federal Open Market Committee (FOMC) or in the Federal Reserve System.

Fed Structure

I know this group encompasses a very diverse crowd — we have everyone from House staffers to Senate staffers here. So, just in case anyone doesn’t know, I want to begin by giving you a very brief explanation of what, exactly, a regional Federal Reserve Bank is. Our nation’s central bank, after all, is quite unusual — unique, even — in its design.

The configuration of the Federal Reserve System — a central bank with a decentralized structure — owes its existence to the 1913 Federal Reserve Act. It is something of a testament to old-fashioned American compromise and reflects the unique demands of the United States and our economy.

The System consists of a Board of Governors, which sits in Washington, and 12 regional Banks around the country.

The Board seats seven governors, including the Chair. Each regional Bank has its own president and board of directors, which is made up of business, banking, and community leaders from the area. Fundamentally, this provides the Fed with a perspective — within each District — of the sectors and issues that make the region tick. Mine is the Third District, which encompasses eastern Pennsylvania, South Jersey, and the state of Delaware. We’re the smallest District geographically, but I like to think we punch above our weight.

The FOMC, which is responsible for monetary policy, is composed of the Fed’s governors and regional Bank presidents. Regional Bank presidents don’t always get to vote. Most of us rotate into a voting position every three years, but the governors always vote, as does the president of the New York Fed. New York, owing to the presence of Wall Street, enjoys something of a “first among equals” status within the System.

While the rest of us don’t always vote, we do always represent our Districts and play a part in the discussion. If you were at a normal FOMC meeting, you probably wouldn’t be able to tell a voting member until the end of the meeting when it’s time to raise hands. Everybody contributes.

The Fed’s decentralized nature is, in my view, a unique strength. We’re making national policy, but we’re doing it for an enormous country, and the averages of economic data can obscure realities on the ground. Conditions look very different in Philadelphia, Dover, or Washington than they do in Dallas, Salt Lake City, or Honolulu. This System gives a voice to a range of localities and sectors. It also allows us to focus on regional issues within each Bank’s District.

The United States has a unique set of needs. It’s easy to forget that we’re an outlier because we’re such a massive country: Only Russia and Canada are bigger geographically, only China and India have larger populations, and no one country has a bigger economy, at least for now. And that economy is vast, spreading across sectors and natural resources in a way that is not typical of other nations.

So, it makes sense that we have a System that feeds back information from around the country.

The State of the Economy

And what that information is telling us is that, for the past 18 months, the economy has moved in tandem with the waxing and waning of the COVID-19 pandemic. During periods when case rates and hospitalizations have declined, the economy has surged as American consumers have voted with their wallets. When COVID-19 risks abate, more Americans dine out at restaurants, check in to hotels, and fill up airplanes. Those are important categories of spending in a country where consumption makes up about 70 percent of total economic activity. In the second quarter of this year, for instance, GDP grew at a very healthy annualized rate of around 6.7 percent as case rates plummeted.

And, of course, the opposite occurs during periods when the virus spikes. When the Delta variant of COVID-19 erupted, fomenting the country’s fourth major wave of the pandemic, things started moving sideways. Consumer confidence tanked, and large industries like hospitality and leisure stagnated at best. So for this quarter, we can expect growth to come in at an annualized rate of around 3 percent, a sharp slowdown from earlier this year. 

But there are reasons to be sanguine that the country’s recovery from this wave of COVID-19 may prove more durable than in the past and that we can avoid a fifth wave. And that is because more than half of the country is fully vaccinated. Getting more shots into arms will save lives and aid the recovery by reducing the size and severity of future spikes. The Delta variant has also concentrated minds: It seems to have not only persuaded more Americans to get shots on their own, but it also pushed more corporations and institutions to mandate their employees to get vaccinated. That is cause for optimism.

Filling me with less optimism is the persistent constraints the economy is operating under.

The COVID-19 pandemic has revealed how fragile many of our supply chains are. We’re now experiencing shortages of crucial parts like computer chips, which has hobbled not only the production of cars and trucks, but also comparatively smaller durable goods like home appliances. My recent experience attempting to purchase a printer — there were essentially none at my local electronics store — testifies to that. And good luck trying to find a new washing machine or dishwasher.

These supply chain constraints are rippling through the entire economy. Manufacturers in our region have reported having to curtail production because of difficulties securing raw materials. We’re also seeing low inventory of everything from shoes to backpacks to even chicken wings, which is a particularly troubling development as the NFL season is picking up. Unfortunately, there are indications that these constraints could persist for a couple of more years.

There’s another input lacking in supply as well, further constraining the economy: labor. It isn’t true, as was widely reported, that the economy only created 194,000 jobs in September. In reality, the U.S. economy has created many millions of jobs in recent months — we just can’t fill them. Indeed, job openings are at record highs, hitting nearly 10.5 million at the end of August. Simultaneously, more people are quitting their jobs, and the rate at which open positions are being filled is continuing to slow.

It seems that a combination of factors — trouble accessing childcare or eldercare, lingering fears about the virus, the rise in equities and home values spurring people to retire, and perhaps a general revaluation of life choices — is persuading a lot of Americans to stay on the sidelines even as the economy has reopened. And notably, the elimination of extra federal unemployment benefits has not — at least not yet — appeared to nudge people back into the workforce. I do expect that will change eventually and especially as other forbearance programs run out.

So, where does all of this leave us? For 2021, I would expect GDP growth to come in around 5.5 percent, which is a downward revision from before Delta took hold. Growth will then moderate to about 3.5 percent in 2022, and 2.5 percent in 2023. Inflation, meanwhile, should come in around 4 percent for 2021, though I do see upside risk here. After that, our modal forecast — that is, the average of all of our forecasts — calls for inflation of a bit over 2 percent for 2022 and right at 2 percent in 2023.

Fed Policy

In terms of monetary policy, I am in the camp that believes it will soon be time to begin slowly and methodically — frankly, boringly — taper our $120 billion in monthly purchases of Treasury bills and mortgage-backed securities. This comes down to the efficacy of these purchases as a tool.

They were necessary to keep markets functioning during the acute phase of the crisis. But to the extent that we are still dealing with a labor force issue, the problem lies on the supply side, not with demand. You can’t go into a restaurant or drive down a commercial strip without noticing a sea of “Help Wanted” signs. Asset purchases aren’t doing much — or anything — to ameliorate that.

After we taper our asset purchases, we can begin to think about raising the federal funds rate. But I wouldn’t expect any hikes to interest rates until late next year or early 2023, unless the inflation picture changes dramatically.

Conclusion

Given the strong headwinds facing the economy, it is a testament to its underlying strength that growth continues at a relatively robust pace. That is a tribute, as always, to the ingenuity and tenacity of our people, especially in the face of huge challenges.

Thank you very much again for having me. And now let’s move on to questions.