Science-Watching: From Ignition to Energy

[from Science & Technology Review July/August 2025 Research Highlights, by Noah Pflueger-Peters]

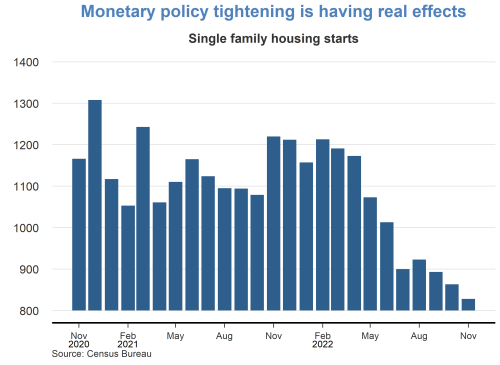
Achieving ignition at the National Ignition Facility (NIF) proved that harnessing the power of the Sun in a laboratory may be possible. The Sun’s extreme temperatures and pressures cause light elements to fuse together to create heavier ones, releasing enormous energy and sustaining conditions for more thermonuclear reactions. NIF replicates these conditions with inertial confinement fusion, in which lasers compress and heat a target capsule filled with deuterium and tritium (DT), “heavy” isotopes of hydrogen that contain extra neutrons. When the isotopes fuse, they create helium and a neutron, and the lost mass is converted into inertial fusion energy (IFE), which can be harnessed for energy production.

Nuclear fusion produces significantly more energy than either nuclear fission or burning fossil fuels for equivalent amounts of fuel. Since the input materials for fusion energy are plentiful on Earth, an IFE power plant could produce safe, abundant, power grid-compatible energy without highly radioactive byproducts.

Although significant work remains to harness fusion energy, pursuing the development and deployment of IFE is crucial for the nation’s energy security, enabling the United States to shape implementation worldwide, avoid technological surprises from adversaries, and influence technical leadership in other energy-intensive technologies such as AI, machine learning (ML), and supercomputing.

IFE research stretches back to the early days of Lawrence Livermore, and today the Laboratory is fostering the overall fusion ecosystem. Livermore’s unique capabilities, expertise, and connections will be critical to laying the technical, logistical, and legal groundwork to make IFE possible. “IFE is a grand scientific and engineering challenge, something that is so incredibly difficult and high-risk and takes enormous expertise,” says Tammy Ma, Livermore’s IFE Institutional Initiative lead. “This challenge makes it the right kind of problem for national laboratories to pursue.”

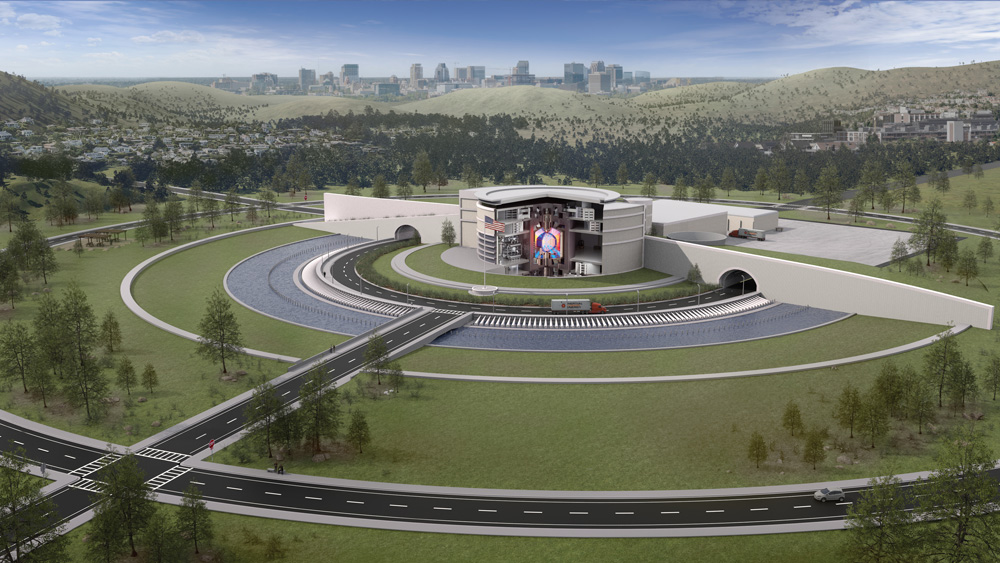
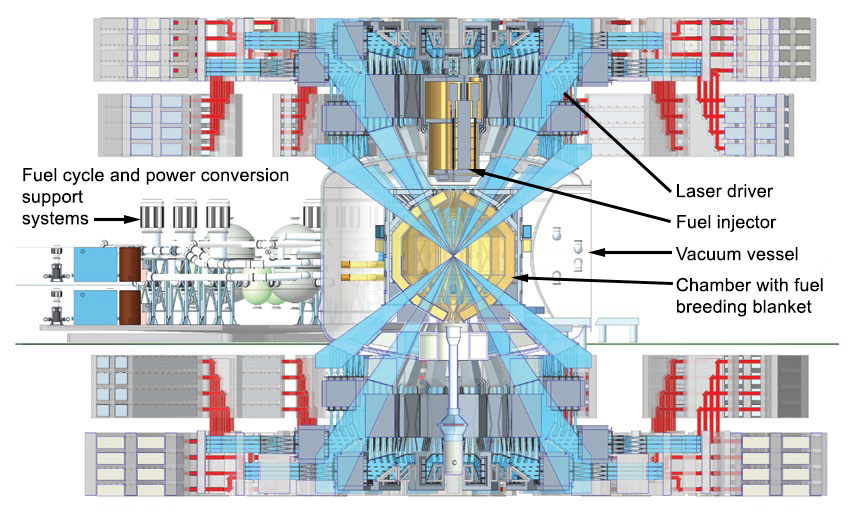
This artist’s rendering shows the concept for an inertial fusion energy (IFE) power plant design, with a cutaway to show the plant’s target chamber in the center. Livermore researchers are laying the groundwork for private fusion companies to build similar designs. (Illustration by Eric Smith.)

Designing for Viability

NIF is the only facility to date to demonstrate the ignition and burning plasma conditions that are prerequisites for IFE, but it is an experimental facility for stockpile stewardship research, not a power plant. To be commercially viable and produce the energy to offset costs and meet demands (baseload power), IFE plants will need to generate more than 30 times the energy they deliver to the fusion target on every shot while firing 10 or more shots per second, compared to NIF’s rate of one or two shots per day.

The Laser Inertial Fusion Energy (LIFE) study, conducted between 2008 and 2013, aimed to build directly on technology developed for NIF to achieve IFE and took a systematic approach to this requirement by developing the Integrated Process Model (IPM). (See S&TR, April/May 2009 [archived PDF], pp. 6-15.)

IPM is a technoeconomic model of an IFE power plant with detailed technical and cost breakdowns and interdependencies of key systems and subsystems. “The work done under LIFE was fantastic,” says Ma. “IPM lays out engineering and physics requirements for the entire system to test out different scenarios and see the impact. Now, we not only get to expand on all that but also leverage 15 years of new data from NIF, better codes, and high-performance computing (HPC), as well as new work in AI, ML, advanced manufacturing, diagnostics, and nonproliferation across the Laboratory.”

IPM describes an IFE power plant that requires a solid-state laser driver system to “pump” lasers with optical energy using laser diodes instead of flashlamps as at NIF. The plant will also need to fabricate and fill target capsules onsite and send them into its target chamber at a high enough frequency to produce baseload power. “We will have to repeatedly inject targets into the chamber, so the targets must be able to withstand and survive that process,” explains Ma. “Then, the lasers will track the moving targets, and when one gets to the center of the chamber, they would fire on the centered target, repeating 10 to 20 times per second.”

The facility would convert fusion energy into heat and then electricity via steam turbines, sending most of the electricity to the power grid and recycling the rest to power operations on subsequent shots. Neutrons from the reaction would produce tritium needed for the DT fuel by bombarding lithium isotopes in a “breeding blanket” material lining its target chamber. By closing both the power and fuel cycles, IFE plants are expected to be self-sustaining.

Thanks in part to IFE STARFIRE (IFE Science and Technology Accelerated Research for Fusion Innovation and Reactor Engineering), a Department of Energy (DOE)-funded multi-institutional IFE research and development hub, researchers across the Laboratory are working to meet the new system’s demands. IPM can help identify key challenges, test the viability of new designs, and direct future research. “Many technical models and cost models exist for IFE, but very few, if any, pair systems and cost models together at the same depth as IPM,” says Mackenzie Nelson, a technoeconomic systems analyst in the Computational Engineering Division. “This type of tool offers such an advantage because we can assess design choices from both a technical and economic standpoint and create blueprints for what an IFE plant could look like.”

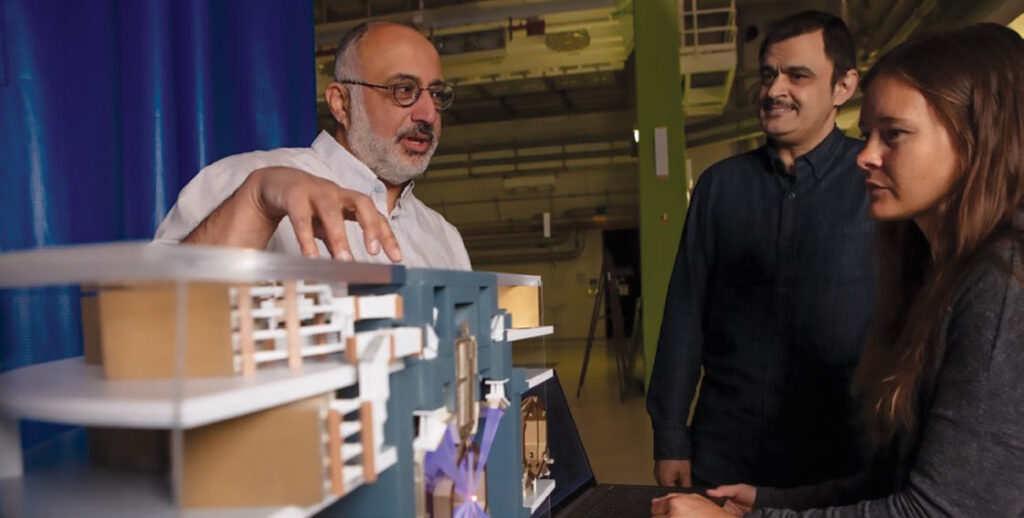
(left to right) Livermore researchers Bassem El Dasher, Claudio Santiago, and Mackenzie Nelson discuss a 3D model of a proposed IFE power plant design alongside the Integrated Process Model (IPM). IPM has more than 270 potential user inputs that researchers and collaborators can use to assess different IFE design choices to see the technical and cost impact on the entire design.

Operational Demands

NIF’s target capsules are extremely precise, fragile, and can take weeks to fabricate, fill, and position. Researchers are trying to reconcile that factor with the estimated demand of more than 800,000 capsules per day produced at less than $0.50 each to achieve IFE plant viability. To do this, they are examining optimal target designs for IFE and exploring advanced manufacturing methods such as microfluidics, volumetric additive manufacturing, and two-photon polymerization. (See S&TR, April/May 2025 [archived PDF], pp. 16-19.) Additional projects involve developing diagnostic instruments that can collect, analyze, and combine data with other diagnostics at the 10 to 20 shot per second frequency and use it to improve lasers in real time.

Fusion energy systems such as IFE are also a regulatory challenge, as they generate high-energy neutrons capable of breeding plutonium or uranium-233 and rely on large quantities of tritium. “Pure fusion energy systems do not require fissile material, but there are still ways to misuse these technologies that pose proliferation risk,” says Yana Feldman, the associate program leader for international safeguards. Bad actors may only need small amounts of tritium to make nuclear weapons, and some breeding blanket designs may inadvertently produce traces of plutonium that may be diverted for military purposes.

Nuclear fission reactors are regulated through international agreements and export control rules, and the independent International Atomic Energy Agency (IAEA) verifies that nuclear material and facilities are only being used for peaceful purposes. Neither treaties nor the IAEA address fusion energy, and no consensus has been reached on whether fusion energy systems need an international verification program. Verification methods for safeguarding tritium are also far less developed than for plutonium and uranium and focus more on contamination and transfers than analytical accounting for discrepancies. The precise scale of allowable tritium unaccounted for without posing proliferation risk is also unclear.

Fusion systems can be designed for proliferation resistance, but not having an existing design remains a challenge.

International security analyst Anne-Marie Riitsaar and her colleagues are exploring these complexities and starting conversations with international fusion experts and private industry to raise awareness. Riitsaar also plans to collaborate with the IPM team to map tritium diversion vulnerabilities and identify high-risk points where researchers could incorporate surveillance methods into plant designs to detect and prevent potential misuse. “People sometimes ask me why I’m thinking about fusion energy regulations and proliferation risks at this point, but it’s not too early,” says Riitsaar. “Reaching a multinational consensus on regulating sensitive technologies takes considerable time and effort.”

The National Ignition Facility is an experimental facility and not a power plant, so a commercial IFE plant design has vastly different requirements—many of which are being studied by Livermore researchers and their collaborators.

NIFViable IFE plant (estimated)
Repetition rateOne shot per day10 to 20 shots per second
Energy gain4.13 times (as of April 2025)30 times (minimum), 50 times to 100 times (ideal)
How lasers gain energyFlashlampsDiode pumping
Target fabrication and fuel fillingFabricated offsite over several weeks and filled manually in 1 to 5 daysMass-manufactured and filled in a target factory within the facility
Target deliveryPositioned manually within the Target ChamberShot into the plant’s target chamber approximately 10 to 20 times per second
Laser alignmentComputationally in real time, taking up to 8 hoursIn real time
Power cycleOpen, requiring outside energy sourcesClosed, applying reused energy to power laser and ancillary plant operations
Fuel cycle (tritium)Produced offsiteBred onsite

The Laser Driven Fusion Integration Research and Science Test Facility (LD-FIRST) is a proposed blueprint for a proof-of-concept IFE facility that will test all the key IFE subsystems in an integrated fashion. A public-private partnership will likely be necessary to build the facility and will help the IFE community address the main subset of risks and the technological challenges of building a commercial plant.

Converging on a Solution

The team seeks to make IPM as accurate and comprehensive as possible by meeting with subject matter experts across the Laboratory to incorporate the latest research. “We’re trying to evolve the model so it has the same level of high detail across every single functional area to tell us where we can focus research and help us find optimized solutions that we could propose to industry,” says Nelson.

Computer scientist Claudio Santiago and his colleagues also modernized IPM by porting its framework from Microsoft Excel to Python in December 2024, making it compatible with AI, ML, design optimization, and HPC to further inform designs. “Once we think about all the forcing functions such as minimum shot yield and materials requirements pinning us in from every direction, we end up with an optimized solution space. As we sharpen the pencil more with these tools, that optimized solution box gets smaller until eventually we’ve converged on a point design,” says IFE lead systems engineer Justin Galbraith. Galbraith and his team’s point design is called the Laser Driven Fusion Integration Research and Science Test Facility, or LD-FIRST, a proof-of-concept physics demonstration facility for IFE. “That point design, we anticipate, will serve as the foundation for a future public-private partnership that would facilitate building and realizing a physical facility to focus the IFE community in pursuit of fusion power on the grid,” says Galbraith.

Livermore is leading the charge in IFE, helping the United States develop a technological roadmap, growing and coordinating science and technology efforts within the Laboratory, and fostering partnerships across the fusion industry, academia, and government.

Ma chaired DOE’s “Basic Research Needs for IFE” workshop and report in 2022 and co-chairs the subcommittee providing recommendations on the nation’s fusion activities through DOE’s Fusion Energy Sciences Advisory Committee. She and her team travel often to Washington, D.C., working with DOE and legislators to expand fusion energy research and advocacy in the nation. Livermore also leads a “Collaboratory” with other DOE national laboratories to connect research project leads and facilitate public-private partnerships. The Collaboratory has hosted multiple events with industry, and the Laboratory has partnered with three private companies who aim to design pilot IFE plants.

Meanwhile, Galbraith and other IFE leaders have served as technical advisors for engineering design teams at Texas A&M University and given them IFE-relevant problems to solve, including advanced chamber and blanket design. Galbraith is working with Nelson to develop the IFE plant design portion of a high-energy-density science summer school program, which Nelson is leading in 2025 at the University of California at San Diego, and they have developed IFE curriculum that has been deployed at six universities starting in spring 2025. “We’re hoping we can get a group of students really excited about fusion and start to build up the next generation of engineers and scientists that will make fusion a reality,” says Galbraith. The team has led IFE strategic planning exercises at the Laboratory, and Lawrence Livermore will stand up a new fusion institute—named “LIFT,” for Livermore Institute for Fusion Technology—a research and development center that will coordinate and centralize institutional fusion energy research.

Harnessing IFE will be a massive undertaking, but Livermore’s broad and deep expertise, facilities, and capabilities put the Laboratory in a unique position to lead and play an impactful role. “If we can set it up correctly, IFE will be a big piece of the Laboratory’s long-term vision,” says Ma. “IFE plays off of our history and all of our strengths, and it is critical for long-term national security.”

Economic-Watching: Fourth District Beige Book

[from the Federal Reserve Bank of Cleveland, 3 September 2025]

Summary of Economic Activity

Fourth District contacts reported a slight increase in overall business activity in recent weeks and expected activity to rise modestly in the months ahead. Consumer spending was flat, with retailers noting continued affordability concerns among consumers. Manufacturers also reported flat demand for goods, citing trade policy uncertainty as the main driver. Demand for professional and business services grew moderately, albeit at a slower pace than in the past three reporting periods. Contacts generally reported flat employment levels and modest wage pressures. Nonlabor cost pressures remained robust, and selling prices continued to grow modestly.

Read the full report [archived PDF].

Economics-Watching: Why Businesses Say Tariffs Have a Delayed Effect on Inflation

[from the Federal Reserve Bank of Richmond, 8 August, 2025]

by R. Andrew BauerRenee Haltom and Matthew Martin

Regional Matters

Ever since new tariffs were enacted in early 2025, a key policy question has been what is the extent to which businesses will pass tariff costs through to prices, and when? The effects of a tariff are rarely straightforward, given, among other things, competitive dynamics and the challenges of implementation, but the historically large and changing nature of these tariffs have created additional levels of uncertainty over the effects.

In uncertain times, anecdotal evidence from businesses can be especially insightful. We are learning how businesses are reacting to tariffs through the Richmond Fed’s business surveys as well as through hundreds of one-on-one conversations with Fifth District businesses since the start of 2025.

These conversations showcase that navigating tariffs is a complex and sometimes protracted process for firms, particularly when there is uncertainty. Firms describe several reasons they may not have experienced the full impact of proposed tariffs yet (even when goods and countries they deal with are subject to them), as well as reasons that even when they have incurred tariff-related cost increases, there can be a delayed impact on pricing decisions.

Reasons Firms May Not Have Incurred Tariffs Yet

Business contacts describe several strategies or circumstances that can delay or reduce the tariffs on inputs or other imported items. These include the following:

As our monthly business surveys have found, many firms report deploying more than one strategy to delay tariffs. Notably, many of these delays are only temporary.

Reasons Tariffs May Have a Delayed Impact on Prices

Even when firms have incurred tariffs, they give several reasons why tariffs may not be immediately reflected in the prices they charge for their products. These include the following:

  • Waiting for tariff policy to clarify. Higher prices could reduce demand for goods and services and/or lead firms to lose market share, so many firms said they are hesitant to increase prices until they’re sure tariffs will remain in place. For example, a large national retailer said if tariffs are finalized at a sufficiently low level, they’ll absorb what they’ve incurred to date, but if high tariffs stick, they’ll have to raise prices. A steel fabricator for industrial equipment described being reluctant to raise prices on the 10 percent cost increases they’d seen thus far but would have to raise prices should the increases reach 12 to 13 percent. A grocery store chain was reluctant to raise prices and instead might reduce margins, which had recovered in recent years, to maintain their customer base. Some firms explicitly noted a strategy to both raise prices over time and pursue efficiency gains to cut costs and completely restore margins within a year or two.
  • Elasticity testing. Firms reported testing across goods whether consumers will accept price increases. A furniture manufacturer said he’s seen competitors pass along just 5 percentage points of the tariffs at a time so it isn’t such a huge shock to customers, though in that sector, “We all end in the same place which is the customer bearing most of it.” A national retailer said most firms are doing a version of stair-stepping tariffs through, e.g., raising prices a small amount once or twice to see if consumer demand holds, and if so, trying again two months later. This retailer said prices were going up very marginally in early summer, would increase more in July and August, and would be up by 3 to 5 percent by the end of Q4 and into 2026. Another national retailer said they would start testing the extent to which demand falls with price increases, e.g., when the first items that were subject to tariffs—in this case back to school items—hit shelves in late July.
  • Blind margin. Some firms reported attempting to pass through cost in less noticeable ways. While any price increase to consumers will be captured in measures of aggregate inflation, the fact that price increases may occur on non-tariffed goods might make it difficult to directly relate price increases to tariffs. An outdoor goods retailer said, “Unless it’s a branded item where everyone knows the price, if something goes for $18, it can also go for $19.” A national retailer plans to print new shelf labels with updated pricing, which will be less noticeable for consumers compared to multiple new price stickers layered on top. This takes time (akin to a textbook “menu cost” in economics), so it will not be reflected in prices until July and August. A grocery store said their goal was to increase average prices across the store but focus on less visible prices.
  • Selling out of preexisting inventory: Many firms noted they still have production inventory from before tariffs were announced, so they do not need to raise prices as long as they still sell these lower cost goods. A national retailer noted they have at least 25 weeks of inventory on hand for most imported products. A firm that produces grocery items said they will decide how much to raise prices as they get closer to selling tariff-affected products. Similarly, retailers order seasonal items quarters in advance. Many were receiving items for fall and winter when the new tariffs were going into effect in the spring. They paid the tariff then, but we won’t see the price increase until those items hit the shelves in the fall or winter. One retailer speculated that seasonal décor items will look the most like a one-time increase.
  • Pre-established prices. Many firms face infrequent pricing due to factors like annual contracts or pre-sales. For example, a dealer of farm equipment gets half its sales through incentivized pre-sales to lock in demand and smooth around crop cycles. They noted that while it would be difficult to retroactively ask those customers to pay for part of the tariff, they will pass tariffs directly through on spare parts. A steel fabricator for industrial equipment has a contract for steel through Q3, so they haven’t been impacted yet by price increases. However, they will face new costs once that contract expires.

In general, compared to small firms, large firms have more ability to negotiate with vendors, temporarily absorb costs, burn cash, wait for strategic opportunity, and test things out. This matters because large firms often lead pricing behavior among firms, so these strategic choices may influence the response of inflation to tariffs more generally. Even within firm size, one often hears that negotiations on price vary considerably by relationship and item.

Conclusion

A key question surrounding tariffs is whether any effects on inflation will resemble a short-lived price increase—as in the simplest textbook model of tariffs—or a more sustained increase to inflation that may warrant tighter Fed monetary policy. When asked in May what will determine the answer, Fed Chair Jerome Powell cited three factors [archived PDF]: 1) the size of the tariff effects; 2) how long it takes to work their way through to prices; and 3) whether inflation expectations remain anchored. The insights shared above suggest the process from proposed tariffs to the prices set by firms is far from instantaneous or clear-cut, particularly when tariff policy is changing.

Sensing from businesses suggests that the impact of tariffs on their price-setting [archived PDF] has been lagged, but it is starting to play out. Nonetheless, it remains highly uncertain how tariffs will impact consumer inflation. The discussion above makes clear that firms are nimble and innovative in the face of challenge, and they are concerned about losing customers in the current environment, particularly consumer-facing firms. We will continue to learn from our business contacts and share their insights.


Views expressed are those of the author(s) and do not necessarily reflect those of the Federal Reserve Bank of Richmond or the Federal Reserve System.

Economics-Watching: Kuwait: GDP Returns to Growth in Q1 2025 as Impact of Oil Output Cuts Fades

[from NBK Economic Research, 21 July, 2025]

by Mohammad Al-Shehri, Assistant Economist & Omar Al-Nakib, Head of MENA Research

Preliminary official figures show GDP expanding 1% y/y in Q1 2025 following seven consecutive quarters of contraction, helped by a less severe downturn in oil output. With the negative effects of earlier voluntary oil production cuts beginning to fade, oil GDP recorded only a marginal decline, the softest since Q2 2023. Growth in non-oil activity remained positive though eased, weighed by a moderation in the manufacturing, real estate, and transport sectors. The near-term outlook for GDP is one of positive growth, lifted by rising oil production after Kuwait started to restore 135 kb/d of oil output cuts between April and September 2025, while the non-oil sector should also register further steady gains.

Non-oil GDP growth softens in Q1 2025 after strong performance in Q4 2024

Growth in the non-oil sector weakened in Q1 2025, slowing to 2% y/y compared to 4% recorded in the prior quarter. (Chart 1.) The softer expansion in non-oil activity reflected, among other things, a moderation in the manufacturing sector, where activity grew at a still-solid 4.3% despite a decline in refined petroleum products output but slowed notably from the 12.2% reading registered in Q4 2024. Growth in other sectors including real estate, wholesale & retail trade, transport, and education also slowed. Offsetting the slowdown was stronger expansion in the non-oil economy’s largest segments: public administration and defense as well as financial intermediation and insurance, which grew 1% and 3.2% y/y, respectively. (Chart 2.)

Chart 1: Real GDP growth

Chart 2: Growth at sub-sector level (1Q25)

Oil sector logs marginal contraction, set to return to growth in Q2

The contraction in oil GDP eased significantly to -0.3% y/y from -5.7% y/y in Q4 2024, registering the softest rate of decline since Kuwait embarked on cutting oil production in Q2 2023 after participating in the voluntary cuts scheme with 7 other OPEC+ members. (Chart 4.) Kuwait’s oil production averaged 2.415 mb/d in Q1 2025, a 0.7% decline from the same quarter last year, according to OPEC secondary sources. However, oil sector fortunes are set to shift in Q2 2025 and thereafter, after the OPEC-8 member alliance started unwinding the 2.2 mb/d voluntary cut tranche in April 2025. Originally planned to be unwound over the course of 18 months, OPEC+ has accelerated the pace of supply hikes with output now on a path to be fully restored in September, a full year ahead of schedule. For Kuwait, crude production rose by 0.5% q/q in Q2 to 2.426 mb/d and is set to accelerate further to average 2.533 mb/d in H2 2025. With the oil market so far able to absorb the additional OPEC and global supply and oil prices currently holding near $70/bbl, an upside risk to our oil sector outlook involves the potential unwinding of the outstanding OPEC-8 voluntary cuts (1.66 mb/d), of which Kuwait’s share is 128 kb/d.

Growth heading back into positive territory in 2025

Growth in total GDP is set to remain on a positive trajectory in the near term, buoyed by further steady expansion in non-oil economic activity and increased oil production. Non-oil GDP is set to benefit from the government’s reform drive which includes the recent passing of the debt law that could catalyze the implementation of key development projects and the potential approval of the ‘mortgagelaw later in 2025, which could spur higher household borrowing and consumer spending. Economic indicators for Q2 2025 pointed to a healthy pace of non-oil economic activity. The key ‘output’ and ‘new orders’ balances in the non-oil private sector PMI gauge both averaged a very robust 57+ in Q2 2025, real estate activity continued to expand at a robust pace with earlier price falls in the residential sector abating, while credit growth stood at a healthy 5.5% y/y in May, and could benefit in coming months if interest rates are reduced further.

Nonetheless, there are also downside risks to the outlook. Local consumer spending growth (according to central bank card transactions data) turned negative in Q1 2025, extending the weakening trend now observed for more than a year. The government’s ongoing fiscal consolidation push will also weigh on wage and job growth. Overall, we see GDP growing 1.9% this year, boosted by expansions in both the oil and non-oil sectors of 1.2% and 2.5%, respectively.

Chart 3: Contribution to non-oil growth

Chart 4: Oil production and oil GDP

Read this article as an archived PDF.

China: Deep History

Winston Churchill says somewhere (if we paraphrase) that the further back you are able to look, the more secure your ability to analyze the present and the future. Without these ‘historical smarts’, your sense of direction is very feeble. Let us use the novel, Lost Illusions, by Honoré de Balzac as a back door into historical smarts.

This novel was originally published in three parts between 1837 and 1843 and is set mostly in the 1820s, primarily in provincial France. It is unique because it starts with technology and commerce.

At the time when this story begins, the Stanhope press and inking-rollers were not yet in use in small provincial printing-offices. Angoulême, although its paper-making industry kept it in contact with Parisian printing, was still using those wooden presses from which the now obsolete metaphor ‘making the presses groan’ originated. Printing there was so much behind the times that the pressmen still used leather balls spread with ink to dab on the characters. The bed of the press holding the letter-filled ‘forme’ to which the paper is applied was still made of stone and so justified its name ‘marble’. The ravenous machines of our times have so completely superseded this mechanism — to which, despite its imperfections, we owe the fine books produced by the Elzevirs, the Plantins, the Aldi and the Didots — that it is necessary to mention this antiquated equipment which Jérôme-Nicolas Séchard held in superstitious affection; it has its part to play in this great and trivial story.

Not only do we get this conceptual framework about printing technology, but later on in the novel, Balzac gives us a further insight into paper-making and textiles, including a long discussion of China.

In England, where four-fifths of the population use cotton to the exclusion of linen, they make nothing but cotton paper. The cotton paper is very soft and easily creased to begin with, and it has a further defect: it is so soluble that if you seep a book made of cotton paper in water for fifteen minutes, it turns to a pulp, while an old book left in water for a couple of hours is not spoilt. You could dry the old book, and the pages, though yellow and faded, would still be legible, the work would not be destroyed.

“There is a time coming when legislation will equalize our fortunes, and we shall all be poor together; we shall want our linen and our books to be cheap, just as people are beginning to prefer small pictures because they have not wall space enough for large ones. Well, the shirts and the books will not last, that is all; it is the same on all sides, solidity is drying out. So this problem is one of the first importance for literature, science, and politics.

“One day, in my office, there was a hot discussion going on about the material that the Chinese use for making paper. Their paper is far better than ours, because the raw material is better; and a good deal was said about this thin, light Chinese paper, for if it is light and thin, the texture is close, there are no transparent spots in it. In Paris there are learned men among the printers’ readers; Fourier and Pierre Leroux are Lachevardiere’s readers at this moment; and the Comte de Saint-Simon, who happened to be correcting proofs for us, came in in the middle of the discussion. He told us at once that, according to Kempfer and du Halde, the Broussonetia furnishes the substance of the Chinese paper; it is a vegetable substance (like linen or cotton for that matter). Another reader maintained that Chinese paper was principally made of an animal substance, to wit, the silk that is abundant there. They made a bet about it in my presence. The Messieurs Didot are printers to the Institute, so naturally they referred the question to that learned body. M. Marcel, who used to be superintendent of the Royal Printing Establishment, was umpire, and he sent the two readers to M. l’Abbe Grozier, Librarian at the Arsenal. By the Abbe’s decision they both lost their wages. The paper was not made of silk nor yet from the Broussonetia; the pulp proved to be the triturated fibre of some kind of bamboo. The Abbe Grozier had a Chinese book, an iconographical and technological work, with a great many pictures in it, illustrating all the different processes of paper-making, and he showed us a picture of the workshop with the bamboo stalks lying in a heap in the corner; it was extremely well drawn.

“Lucien told me that your father, with the intuition of a man of talent, had a glimmering of a notion of some way of replacing linen rags with an exceedingly common vegetable product, not previously manufactured, but taken direct from the soil, as the Chinese use vegetable fibre at first hand. I have classified the guesses made by those who came before me, and have begun to study the question. The bamboo is a kind of reed; naturally I began to think of the reeds that grow here in France.

Labor is very cheap in China, where a workman earns three halfpence a day, and this cheapness of labor enables the Chinese to manipulate each sheet of paper separately. They take it out of the mould, and press it between heated tablets of white porcelain, that is the secret of the surface and consistence, the lightness and satin smoothness of the best paper in the world. Well, here in Europe the work must be done by machinery; machinery must take the place of cheap Chinese labor. If we could but succeed in making a cheap paper of as good a quality, the weight and thickness of printed books would be reduced by more than one-half. A set of Voltaire, printed on our woven paper and bound, weighs about two hundred and fifty pounds; it would only weigh fifty if we used Chinese paper. That surely would be a triumph…

In 2025, we are to some extent, back to China, going from the proto-industrial world to our industrial and even digital world.

To educate oneself on all of this, you should look at the supreme scholarly achievement of the 20th century, namely Professor Joseph Needham’s masterpiece, Science and Civilisation in China.

India: Deep History

In his lectures, Professor Amartya Sen, the Harvard Nobel Prize in Economics winner, mentions Sir Mortimer Wheeler, Director-General of the Archaeological Survey of India. Wheeler wrote, while reporting on the excavation of the Indus Valley Civilization (of India), that the plumbing and sewerage were advanced, in some ways surpassing modern equivalents.

Sen’s larger point is that history is characterized by phases of rise and fall and not just classes and class struggles à la Marx.

Consider the following depiction of the East India Company, from The Anarchy: The Relentless Rise of the East India Company (also subtitled The East India Company, Corporate Violence, and the Pillage of an Empire) by William Dalrymple.


On 28 August 1608, Captain William Hawkins, a bluff sea captain with the Third Voyage, anchored his ship, the Hector, off Surat, and so became the first commander of an EIC vessel to set foot on Indian soil.

India then had a population of 150 million — about a fifth of the world’s total — and was producing about a quarter of global manufacturing; indeed, in many ways it was the world’s industrial powerhouse and the world’s leader in manufactured textiles. Not for nothing are so many English words connected with weaving — chintz, calico, shawl, pyjamas, khaki, dungarees, cummerbund, taffetas — of Indian origin. It was certainly responsible for a much larger share of world trade than any comparable zone and the weight of its economic power even reached Mexico, whose textile manufacture suffered a crisis of ‘de-industrialisation’ due to Indian cloth imports. In comparison, England then had just 5 per cent of India’s population and was producing just under 3 per cent of the world’s manufactured goods. A good proportion of the profits on this found its way to the Mughal exchequer in Agra, making the Mughal Emperor, with an income of around £100 million,* by far the richest monarch in the world.

The Mughal capitals were the megacities of their day: ‘They are second to none either in Asia or in Europe,’ thought the Jesuit Fr Antonio Monserrate, ‘with regards either to size, population, or wealth. Their cities are crowded with merchants, who gather from all over Asia. There is no art or craft which is not practised there.’ Between 1586 and 1605, European silver flowed into the Mughal heartland at the astonishing rate of 18 metric tons a year, for as William Hawkins observed, all nations bring coyne and carry away commodities for the same’. For their grubby contemporaries in the West, stumbling around in their codpieces, the silk-clad Mughals, dripping in jewels, were the living embodiment of wealth and power — a meaning that has remained impregnated in the word ‘mogul’ ever since.

By the early seventeenth century, Europeans had become used to easy military victories over the other peoples of the world.

* Over £10,000 million today.

Think of the larger point: what you just read is the story of Indian de-industrialization and its negative results. Ask yourself whether American de-industrialization is something of an echo of this, as manufacturing is offshored.

World-Watching: German Industry: Structural Change Underway

[from Deutsche Bank Research]

Production in major industrial sectors in Germany has developed very differently in recent years under the impact of the coronavirus pandemic and energy price shock. For example, manufacturing in electrical engineering rose by 18% compared with the start of 2015. In the chemical industry, there has been a 20% decline over the same period. The differences are not only cyclical, but also structural. In the future, it will be more important to distinguish between Germany as an industrial location and the German industry.

Read the Germany blog [archived PDF].

Economics-Watching: Texas Service Sector Activity Flat, Outlook Continues to Worsen

[from The Federal Reserve Bank of Dallas]

Growth in Texas service sector activity stalled in October, according to business executives responding to the Texas Service Sector Outlook Survey.

Labor market indicators pointed to no growth in employment and a largely stable workweek,” said Jesus Cañas, Dallas Fed senior business economist. “Price pressures remained unchanged while wage growth eased slightly. Perceptions of broader business conditions continued to worsen in October, as pessimism notably increased.”

Key takeaways from the service sector survey:

  • The revenue index fell eight points to 0.7, with the near-zero reading suggesting little change in activity from September.
  • The employment index fell from 2.7 to 0.1, its lowest level in seven months.
  • The input prices index was flat at 37.3 and the selling prices index remained steady at 9.5.
  • The wages and benefits index fell two points to 17.0, approaching its average reading of 15.8.
  • The general business activity index dropped from -8.6 to -18.2, its lowest level since December of last year, while the company outlook index fell to -12.8, its lowest level in 16 months.

Texas Retail Sales Decline

Retail sales declined again in October while retail labor market indicators reflected a contraction in employment and workweeks,” Cañas said. “Retail labor market indicators reflected flat employment and workweeks. Retailers’ perceptions of broader business conditions were mixed.”

Key takeaways from the retail survey:

  • The sales index fell from -4.4 to -18.1, marking its sixth consecutive month in negative territory.
  • The employment index fell 13 points to -12.4 while the hours worked index fell from 0.6 to -12.1.
  • The general business activity index dropped from -10.2 to -23.0.

The Dallas Fed conducts the survey monthly to obtain a timely assessment of activity in the state’s service sector, which represents almost 70 percent of the state’s economy and employs about 9.5 million workers.        

For this month’s survey, Texas business executives were asked supplemental questions on credit conditions. Results for these questions from the Texas Manufacturing Outlook Survey, Texas Service Sector Outlook Survey and Texas Retail Outlook Survey have been released together.

Read the special questions results.

Economics-Watching: “Doing Nothing” Is Still Doing a Lot

[from the Federal Reserve Bank of Philadelphia, speech by Patrick T. Harker President and Chief Executive Officer at the National Association of Corporate Directors Webinar, Philadelphia, PA (Virtual)]

Good afternoon, everyone.

I appreciate that you’re all giving up part of the end of your workday for us to be together, if only virtually.

My thanks to my good friend, Rick Mroz, for that welcome and introduction.

I do believe we’re going to have a productive session. But just so you all know, as much as I enjoy speaking and providing my outlook, I enjoy a good conversation even more.

So, first, let’s take a few minutes so I can give you my perspective on where we are headed, and then I will be more than happy to take questions and hear what’s on your minds.

But before we get into any of that, I must begin with the standard Fed disclaimer: The views I express today are my own and do not necessarily reflect those of anyone else on the Federal Open Market Committee (FOMC) or in the Federal Reserve System.

Put simply, this is one of those times where the operative words are, “Pat said,” not “the Fed said.”

Now, to begin, I’m going to first address the two topics that I get asked about most often: interest rates and inflation. And I would guess they are the topics front and center in many of your minds as well.

After the FOMC’s last policy rate hike in July, I went on record with my view that, if economic and financial conditions evolved roughly as I expected they would, we could hold rates where they are. And I am pleased that, so far, economic and financial conditions are evolving as I expected, if not perhaps even a tad better.

Let’s look at the current dynamics. There is a steady, if slow, disinflation under way. Labor markets are coming into better balance. And, all the while, economic activity has remained resilient.

Given this, I remain today where I found myself after July’s meeting: Absent a stark turnabout in the data and in what I hear from contacts, I believe that we are at the point where we can hold rates where they are.

In barely more than a year, we increased the policy rate by more than 5 percentage points and to its highest level in more than two decades — 11 rate hikes in a span of 12 meetings prior to September. We not only did a lot, but we did it very fast.

We also turned around our balance sheet policy — and we will continue to tighten financial conditions by shrinking the balance sheet.

The workings of the economy cannot be rushed, and it will take some time for the full impact of the higher rates to be felt. In fact, I have heard a plea from countless contacts, asking to give them some time to absorb the work we have already done.

I agree with them. I am sure policy rates are restrictive, and, as long they remain so, we will steadily press down on inflation and bring markets into a better balance.

Holding rates steady will let monetary policy do its work. By doing nothing, we are still doing something. And I would argue we are doing quite a lot.

Headline PCE inflation remained elevated in August at 3.5 percent year over year, but it is down 3 percentage points from this time last year. About half of that drop is due to the volatile components of energy and food that, while basic necessities, they are typically excluded by economists in the so-called core inflation rate to give a more accurate assessment of the pace of disinflation and its likely path forward.

Well, core PCE inflation has also shown clear signs of progress, and the August monthly reading was its smallest month-over-month increase since 2020.

So, yes, a steady disinflation is under way, and I expect it to continue. My projection is that inflation will drop below 3 percent in 2024 and level out at our 2 percent target thereafter.

However, there can be challenges in assessing the trends in disinflation. For example, September’s CPI report came out modestly on the upside, driven by energy and housing.

Let me be clear about two things. First, we will not tolerate a reacceleration in prices. But second, I do not want to overreact to the normal month-to-month variability of prices. And for all the fancy techniques, the best way to separate a signal from noise remains to average data over several months. Of course, to do so, you need several months of data to start with, which, in turn, demands that, yes, we remain data-dependent but patient and cautious with the data.

Turning to the jobs picture, I do anticipate national unemployment to end the year at about 4 percent — just slightly above where we are now — and to increase slowly over the next year to peak at around 4.5 percent before heading back toward 4 percent in 2025. That is a rate in line with what economists call the natural rate of unemployment, or the theoretical level in which labor market conditions support stable inflation at 2 percent.

Now, that said, as you know, there are many factors that play into the calculation of the unemployment rate. For instance, we’ve seen recent months where, even as the economy added more jobs, the unemployment rate increased because more workers moved off the sidelines and back into the labor force. There are many other dynamics at play, too, such as technological changes or public policy issues, like child care or immigration, which directly impact employment.

And beyond the hard data, I also have to balance the soft data. For example, in my discussions with employers throughout the Third District, I hear that given how hard they’ve worked to find the workers they currently have, they are doing all they can to hold onto them.

So, to sum up the labor picture, let me say, simply, I do not expect mass layoffs.

do expect GDP gains to continue through the end of 2023, before pulling back slightly in 2024. But even as I foresee the rate of GDP growth moderating, I do not see it contracting. And, again, to put it simply, I do not anticipate a recession.

Look, this economy has been nothing if not unpredictable. It has proven itself unwilling to stick to traditional modeling and seems determined to not only bend some rules in one place, but to make up its own in another. However, as frustratingly unpredictable as it has been, it continues to move along.

And this has led me to the following thought: What has fundamentally changed in the economy from, say, 2018 or 2019? In 2018, inflation averaged 2 percent almost to the decimal point and was actually below target in 2019. Unemployment averaged below 4 percent for both years and was as low as 3.5 percent — both nationwide and in our respective states — while policy rates peaked below 2.5 percent.

Now, I’m not saying we’re going to be able to exactly replicate the prepandemic economy, but it is hard to find fundamental differences. Surely, I cannot and will not minimize the immense impacts of the pandemic on our lives and our families, nor the fact that for so many, the new normal still does not feel normal. From the cold lens of economics, I do not see underlying fundamental changes. I could also be wrong, and, trust me, that would not be the first time this economy has made me rethink some of the classic models. We just won’t know for sure until we have more data to look at over time.

And then, of course, there are the economic uncertainties — both national and global — against which we also must contend. The ongoing auto worker strike, among other labor actions. The restart of student loan payments. The potential of a government shutdown. Fast-changing events in response to the tragic attacks against Israel. Russia’s ongoing war against Ukraine. Each and every one deserves a close watch.

These are the broad economic signals we are picking up at the Philadelphia Fed, but I would note that the regional ones we follow are also pointing us forward.

First, while in the Philadelphia Fed’s most recent business outlook surveys, which survey manufacturing and nonmanufacturing firms in the Third District, month-over-month activity declined, the six-month outlooks for each remain optimistic for growth.

And we also publish a monthly summary metric of economic activity, the State Coincident Indexes. In New Jersey, the index is up slightly year over year through August, which shows generally positive conditions. However, the three-month number from June through August was down, and while both payroll employment and average hours worked in manufacturing increased during that time, so did the unemployment rate — though a good part of that increase can be explained as more residents moved back into the labor force.

And for those of you joining us from the western side of the Delaware River, Pennsylvania’s coincident index is up more than 4 percent year over year through August and 1.7 percent since June. Payroll employment was up, and the unemployment rate was down; however, the number of average hours worked in manufacturing decreased.

There are also promising signs in both states in terms of business formation. The number of applications, specifically, for high-propensity businesses — those expected to turn into firms with payroll — are remaining elevated compared with pre-pandemic levels. Again, a promising sign.

So, it is against this full backdrop that I have concluded that now is the time at which the policy rate can remain steady. But I can hear you ask: “How long will rates need to stay high.” Well, I simply cannot say at this moment. My forecasts are based on what we know as of late 2023. As time goes by, as adjustments are completed, and as we have more data and insights on the underlying trends, I may need to adjust my forecasts, and with them my time frames.

I can tell you three things about my views on future policy. First, I expect rates will need to stay high for a while.

Second, the data and what I hear from contacts and outreach will signal to me when the time comes to adjust policy either way. I really do not expect it, but if inflation were to rebound, I know I would not hesitate to support further rate increases as our objective to return inflation to target is, simply, not negotiable.

Third, I believe that a resolute, but patient, monetary policy stance will allow us to achieve the soft landing that we all wish for our economy.

Before I conclude and turn things over to Rick to kick off our Q&A, I do want to spend a moment on a topic that he and I recently discussed, and it’s something about which I know there is generally great interest: fintech. In fact, I understand there is discussion about NACD hosting a conference on fintech.

Well, last month, we at the Philadelphia Fed hosted our Seventh Annual Fintech Conference, which brought business and thought leaders together at the Bank for two days of real in-depth discussions. And I am extraordinarily proud of the fact that the Philadelphia Fed’s conference has emerged as one of the premier conferences on fintech, anywhere. Not that it’s a competition.

I had the pleasure of opening this year’s conference, which always puts a focus on shifts in the fintech landscape. Much of this year’s conference centered around developments in digital currencies and crypto — and, believe me, some of the discussions were a little, shall we say, “spirited.” However, my overarching point to attendees was the following: Regardless of one’s views, whether in favor of or against such currencies, our reality requires us to move from thinking in terms of “what if” to thinking about “what next.”

In many ways, we’re beyond the stage of thinking about crypto and digital currency and into the stage of having them as reality — just as AI has moved from being the stuff of science fiction to the stuff of everyday life. What is needed now is critical thinking about what is next. And we at the Federal Reserve, both here in Philadelphia and System-wide, are focused on being part of this discussion.

We are also focused on providing not just thought leadership but actionable leadership. For example, the Fed rolled out our new FedNow instant payment service platform in July. With FedNow, we will have a more nimble and responsive banking system.

To be sure, FedNow is not the first instant payment system — other systems, whether operated by individual banks or through third parties, have been operational for some time. But by allowing banks to interact with each other quickly and efficiently to ensure one customer’s payment becomes another’s deposit, we are fulfilling our role in providing a fair and equitable payment system.

Another area where the Fed is assuming a mantle of leadership is in quantum computing, or QC, which has the potential to revolutionize security and problem-solving methodologies throughout the banking and financial services industry. But that upside also comes with a real downside risk, should other not-so-friendly actors co-opt QC for their own purposes.

Right now, individual institutions and other central banks globally are expanding their own research in QC. But just as these institutions look to the Fed for economic leadership, so, too, are they looking to us for technological leadership. So, I am especially proud that this System-wide effort is being led from right here at the Philadelphia Fed.

I could go on and talk about fintech for much longer. After all, I’m actually an engineer more than I am an economist. But I know that Rick is interested in starting our conversation, and I am sure that many of you are ready to participate.

But one last thought on fintech — my answers today aren’t going to be generated by ChatGPT.

On that note, Rick, thanks for allowing me the time to set up our discussion, and let’s start with the Q&A.

[archived PDF of the above speech]

Economics-Watching: FedViews for January 2023

[from the Federal Reserve Bank of San Francisco]

Adam Shapiro, vice president at the Federal Reserve Bank of San Francisco, stated his views on the current economy and the outlook as of January 12, 2023.

  • While continuing to cool over the last several months, 12-month inflation remains at historically high levels. The headline personal consumption expenditures (PCE) price index rose 5.5% in November 2022 from a year earlier. This marks a decline in inflation to a level last observed in October 2021, but still well above the Fed’s longer-run goal of 2%. A portion of the inflation moderation is attributable to recent declines in energy prices. Core PCE inflation, which removes food and energy prices, has shown less easing.
  • Owing to fiscal relief efforts and lower household spending over the course of the pandemic, consumers accumulated over $2 trillion dollars in excess savings, based on pre-pandemic trends. Since then, consumers have drawn down over half of this excess savings which has helped support recent growth in personal consumption expenditures. A considerable amount of accumulated savings remains for some consumers to support spending in 2023.
  • In the wake of the pandemic, consumer spending patterns shifted away from services towards goods. While there appears to be some normalization of spending behavior, this shift has generally persisted. Real goods spending remains significantly above its pre-pandemic trend, driven by strong demand for durables such as furniture, electronics, and recreational goods. Spending on services has shown a resurgence but remains below its pre-pandemic trend.
  • Supply chain bottlenecks for materials and labor remain a constraint on production, although there are some recent signs of easing. The fraction of manufacturers who reported operating below capacity due to insufficient materials peaked in late 2021 and has moderately declined over the past year. However, the fraction of manufacturers reporting insufficient labor has persisted at high levels.
  • The labor market remains tight, despite some signs of cooling. The number of available jobs remains well above the number of available workers, although vacancy postings have been trending down in recent months. The tight labor market has put continued upward pressure on wages and labor market turnover.
  • A decomposition of headline PCE inflation into supply– and demand-driven components shows that both supply and demand factors are responsible for the recent rise in inflation. The surge in inflation in early 2021 was mainly due to an increase in demand-driven factors. Subsequently, supply factors became more prevalent for the remainder of 2021. Supply-driven inflation has moderated significantly over recent months, while demand-driven inflation remains elevated.
  • The Federal Open Market Committee (FOMC) raised the federal funds rate by 50 basis points at the December meeting to a range of 4.25 to 4.5%. This cycle of continued rate increases since March of last year represents the fastest pace of monetary policy tightening in 40 years. The increase in the federal funds rate has been accompanied by a gradual reduction in the size of the Federal Reserve’s balance sheet.
  • Economic activity in sectors such as housing, which is sensitive to rising interest rates, has slowed considerably in recent months. Housing starts have fallen steadily over the past year, as have other housing market indicators, such as existing home sales and house prices.
  • Although the labor market is currently very strong, financial markets are pointing to some downside risks. Namely, the difference between longer- and shorter-term interest rates has turned negative, which historically tends to occur immediately preceding recessions. It remains unclear whether lower longer-term yields are indicative of anticipated slower growth or lower inflation.
  • Short-term inflation expectations remain elevated relative to their pre-pandemic levels in December 2019. Consumers are expecting prices to rise 5% this year, while professional forecasters are expecting prices to rise 3.5%. Longer-term inflation expectations remain more subdued, indicating that both consumers and professionals believe inflation pressures will eventually dissipate.
  • Rent inflation is expected to remain high over the next year. The prices for asking rents have grown quite substantially over the last two years. As new leases begin and existing leases are renewed, these higher asking rents will flow into the stock of rental units, putting upward pressure on rent inflation.
  • We are expecting inflation to moderate over the next few years as monetary policy continues to restrain demand and supply bottlenecks continue to ease. We anticipate that it will take some time for inflation to reach the Fed’s longer-run goal of 2%.
Inflation is cooling, but remains very high
Savings are boosting consumer demand
Goods consumption remains elevated
Supply shortages are prevalent, but easing
Labor market remains tight, but is cooling
Both supply and demand drive inflation
Monetary policy tightening is having real effects
Yield curve is inverted, signaling recession risk
Short-term inflation expectations remain elevated
High rent inflation is in the pipeline
Inflation likely to remain above 2% for some time

[Archived PDF]

Read other issues from FedViews.