Economics-Watching: Kuwait’s Banking Sector Posts Solid Credit Growth in October

[from NBK Group’s Economic Research Department, 21 November, 2024]

Kuwait: Solid credit growth in October driven by household credit. Domestic credit increased by a solid 0.4% in October, driving up YTD growth to 2.9% (3.2% y/y). The recovery in household credit continued, with growth in October at a solid 0.5%, resulting in a YTD increase of 2.4%. While y/y growth in household credit remains a limited 2.3%, annualized growth over the past four months is a stronger 4.7%. Business credit inched up by 0.2% in October, pushing YTD growth to 3.6% (2.9% y/y). Industry and trade drove business credit growth in October while construction and trade are the fastest growing YTD at 17% and 8%, respectively. In contrast, the oil/gas sector continued its downtrend, deepening the YTD decrease to 13%. Excluding the oil/gas sector, growth in business credit would increase to a relatively good 5% YTD. Looking ahead, the last couple of months of the year (especially December) are usually the weakest for business credit, likely due to increased repayments and write-offs, but it will not be surprising if the recovery in household credit is generally sustained, especially given the commencement of the interest rate-cutting cycle. Meanwhile, driven by a plunge in the volatile public-institution deposits, resident deposits decreased in October, resulting in YTD growth of 2.4% (4.2% y/y). Private-sector deposits inched up in October driving up YTD growth to 4.5% compared with 10% for government deposits while public-institution deposits are a big drag (-14%). Within private-sector KD deposits, CASA showed further signs of stabilization as there was no decrease for the third straight month while the YTD drawdown is a limited 1%.

Chart 1: Kuwait credit growth

(% y/y)

Source: Central Bank of Kuwait (CBK)
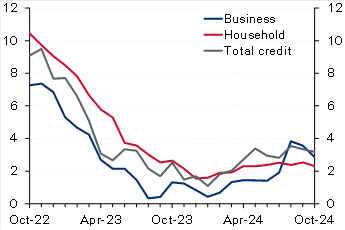
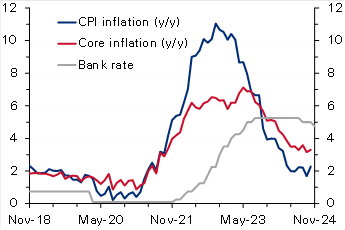
Chart 2: UK inflation

(%)

Source: Haver

Egypt: IMF concludes mission for fourth review, sees external risks. The IMF concluded its visit to Egypt after spending close to 2 weeks, holding several in-person meetings with the Egyptian authorities, private sector, and other stakeholders. The IMF released a statement mentioning that the current ongoing geopolitical tensions in the region in addition to an increasing number of refugees have affected the external sector (Suez Canal receipts down by 70%) and put severe pressure on the fiscal front. The Fund acknowledged the Central Bank of Egypt’s commitment to unify the exchange rate, maintain the flexible exchange rate regime, and keep inflation on a firm downward trend over the medium term by substantially tightening monetary policy. It also highlighted that continued policy discipline was also a key to containing fiscal risks, especially those related to the energy sector. The Fund, as always, re-iterated the need for promoting the private sector mainly through an enhanced tax system and accelerating divestment plans of the state firms. Finally, it also said that the discussions would continue over the coming days to finalize the agreement on the remaining policies and reform plans. However, the release did not provide any clear hints about the conclusion on the government’s earlier request to push the timeline of some of the subsidy moves.

Oman: IMF completes article IV with a strong outlook for the economy in 2025. Oman’s economy continued to expand with growth reaching 1.9% in the first half of 2024 (versus 1.2% in 2023), despite being weighed down by OPEC+ mandated oil production cuts as non-oil GDP grew a stronger 3.8% y/y in H1 (versus 1.8% in 2023). The fiscal and current account balances remain in a comfortable situation evident by a decline in public sector debt and the recent rating upgrade to investment grade. The Fund expects Oman’s economic growth to see a strong rebound in 2025, supported by higher oil production. It also believes that fiscal and current account balances will remain in surplus but at lower levels. Key risks to the outlook stem from oil price volatility and intensifying geopolitical tensions. The IMF also mentioned that further efforts are needed to raise nonhydrocarbon revenues through more tax policy measures and the phasing out of untargeted subsidies which should help in freeing up resources to finance growth under the government’s diversification agenda.

UK: Inflation rises more than forecast, reinforcing BoE’s caution on rate cuts. UK CPI inflation increased to 2.3% y/y in October from 1.7% the previous month, slightly above the market and the Bank of England’s forecast of 2.2%. On a monthly basis too, inflation rose to 0.6%, a seven-month high, from September’s no change. The steep rise was mainly driven by an almost 10% rise in the household energy price cap effective from October. Core inflation also accelerated to 3.3% y/y (0.4% m/m) from 3.2% (0.1% m/m). While goods prices continued to fall (-0.3% y/y), service prices rose at a faster rate of 5% from 4.9%. Recently, the Bank of England had cautioned about inflation quickening next year (projecting a peak rate of 2.8% in Q3 2025), citing the impact of higher insurance contributions and rising minimum wages as outlined in the latest government budget. Therefore, with inflation rising above forecast, the bank will likely slow the pace of monetary easing after delivering two interest rate cuts of 25 bps earlier, with markets now seeing only two additional cuts by the end of 2025.

Eurozone: ECB warns of fiscal and growth risks in its latest Financial Stability Review [archived PDF]. In its most recent Financial Stability Review (November) [archived PDF], the European Central Bank warned that elevated debt and fiscal deficit levels and anemic long-term growth could expose sovereign debt vulnerabilities in the region, stoking concerns of a repeat of the 2011 sovereign debt crisis. Maturing debt being rolled over at much higher borrowing rates raising debt service costs poses risks to countries with little fiscal space and leaves certain governments exposed to market fluctuations. The bank also emphasized the risks of high equity valuations, low liquidity and a greater concentration of exposure among non-banks. Moreover, it sees current geopolitical uncertainties and the possibility of more trade tensions as heightening risks. The Eurozone’s current government debt-to-GDP ratio stands at 88%, but the underlying data suggest a much more precarious situation with Greece, Italy, and France’s ratios at 164%, 137% and 112%. Recently, concerns about France’s high fiscal deficit (around 5.9% of GDP) and elevated debt levels saw yields on the country’s bonds rise steeply, widening the spread gap with German bonds to the highest level in over a decade.

Stock marketsIndexDaily Change (%)YTD Change (%)
Regional
Abu Dhabi (ADI)9,405-0.23-1.80
Bahrain (ASI)2,043-0.373.62
Dubai (DFMGI)4,7610.6117.26
Egypt (EGX 30)30,588-0.33 23.18
GCC (S&P GCC 40)7090.09-0.52
Kuwait (All Share)7,353-0.087.86
KSA (TASI)11,868-0.07-0.83
Oman (MSM 30)4,6090.002.10
Qatar (QE Index)10,4380.12-3.62
International
CSI 3003,9860.2216.17
DAX19,005-0.2913.45
DJIA43,4080.3215.17
Eurostoxx 504,730-0.454.60
FTSE 1008,085-0.174.55
Nikkei 22538,352-0.1614.61
S&P 5005,9170.0024.05
3m interbank rates%Daily Change (bps)YTD Change (bps)
Bahrain5.86-1.29-66.34
Kuwait3.940.00-37.50
Qatar6.000.00-25.00
UAE4.433.81-89.96
Saudi5.50-4.75-73.14
SOFR4.52-0.09-81.13
Bond yields%Daily Change (bps)YTD Change (bps)
Regional
Abu Dhabi 20274.665.0033.9
Oman 20275.496.0033.0
Qatar 20264.686.0016.1
Kuwait 20274.693.0035.0
Saudi 20284.961.0043.9
International 10-year
US Treasury4.411.7755.3
German Bund2.340.3531.2
UK Gilt4.472.6093.0
Japanese Gov’t Bond1.071.045.4
Exchange ratesRateDaily Change (%)YTD Change (%)
KWD per USD0.310.04-0.05
KWD per EUR0.32-0.46-1.98
USD per EUR1.05-0.49-4.47
JPY per USD155.430.5010.19
USD per GBP1.27-0.25-0.62
EGP per USD49.670.3461.00
Commodities$/unitDaily Change (%)YTD Change (%)
Brent crude72.81-0.68-5.49
KEC73.780.74-7.26
WTI68.87-0.75-3.88
Gold2,648.20.8028.40

Disclaimer: While every care has been taken in preparing this publication, National Bank of Kuwait accepts no liability whatsoever for any direct or consequential losses arising from its use. Daily Economic Update is distributed on a complimentary and discretionary basis to NBK clients and associates. This report and previous issues can be found in the “News & Insight / Economic Reports” section of the National Bank of Kuwait’s web site. Please visit their web site, nbk.com, for other bank publications.

Japanese Ministry of Finance Info, July 2024

[from the Ministry of Finance, Japan]

Interest Rates (July 17, 2024)

Date1Y2Y3Y4Y5Y6Y7Y8Y9Y10Y15Y20Y25Y3oY40Y
7/10.1750.360.390.4920.6150.6620.7620.8620.9621.0831.5491.8732.0582.1632.351
7/20.1760.3650.4010.5080.630.6790.7860.890.9851.1041.5731.8942.0752.1742.352
7/30.1660.350.3910.4930.6130.6640.7780.8860.9841.11.5791.9082.0882.1852.364
7/40.1480.340.3820.4820.5990.6450.7540.8630.9671.0861.5711.9082.0922.1882.364
7/50.1480.3460.3820.4830.5980.6350.7450.850.9581.0721.5661.9022.0982.22.379
7/80.150.3620.3980.4990.6160.6550.7640.8690.9741.0921.5761.9072.0992.22.385
7/90.140.3530.3910.4840.610.640.7480.8560.961.0791.5731.9112.1032.2052.398
7/100.1310.3430.3870.480.6050.6490.7560.8650.9691.0931.5861.9242.1152.222.415
7/110.1310.3430.3920.4850.6110.6540.7560.8640.9691.0891.5851.9122.1122.2212.419
7/120.1220.3330.3780.470.5860.6240.7230.8310.9361.0551.5391.8732.0732.1772.387
7/160.1110.320.3630.4560.5660.6060.7050.8090.9141.0321.5241.862.0612.1682.375
7/170.1150.330.3740.4670.5770.620.720.8240.9241.0421.5281.8612.0552.1732.376
[download CSV]

Announcement of 40-year Japanese Government Bonds to Be Issued in July 2024

[Provisional Translation]

July 17, 2024

Ministry of Finance

  1. Auction Date: July 24, 2024
  2. Issue Date: July 25, 2024
  3. Maturity Date: March 20, 2064
  4. Offering Amount: About 700 billion yen

* 40-year Japanese Government Bonds to be issued in July will be a reopening issue of the May 2024 issue. The auction method is Dutch-style-yield-competitive auction at intervals of 0.5bp.

JGB Monthly Newsletter (July 2024)

Read the full newsletter (in English) [archived PDF]

Economics-Watching: FRBSF Economic Letter

[from the Federal Reserve Bank of San Francisco]

Are Inflation Expectations Well Anchored in Mexico?

by Remy Beauregard, Jens H.E. Christensen, Eric Fischer and Simon Zhu

Price inflation has increased sharply since early 2021 in many countries, including Mexico. If sustained, high inflation in Mexico could raise questions about the ability of its central bank to bring inflation down to its 3% inflation target. However, analyzing the difference between market prices of nominal and inflation-indexed government bonds suggests investors’ long-term inflation expectations in Mexico are close to the central bank’s inflation target and are projected to remain so in coming years.


Inflation has risen substantially in many countries, including Mexico, since early 2021, driven in part by unique factors related to the COVID-19 pandemic. Sustained elevated inflation could be particularly challenging for inflation-targeting central banks in emerging economies given their higher macroeconomic uncertainty and greater sensitivity to external shocks compared with more developed economies. To examine this risk for a representative emerging economy affected by COVID-era disruptions in much the same way as the United States, we focus on Mexico, which has conducted monetary policy since 2002 according to an inflation targeting regime with a target rate for consumer price inflation of 3% per year.

In this Economic Letter, we assess whether recent higher inflation is leading businesses and households in Mexico to expect inflation to remain high over the long run. Specifically, we focus on what rising market-based measures of inflation compensation may imply about bond investors’ outlook for inflation. The rise in inflation compensation since spring 2021 could reflect three factors: an increase in investorsinflation expectations, an uptick in the premium investors demand for assuming inflation risk, or changes in other risk and liquidity premiums. We explore the relative importance of each of these factors using a novel dynamic term structure model of nominal and inflation-adjusted yields described in Beauregard et al. (2021, henceforth BCFZ). Overall, our results for five-year inflation expectations five years from now suggest Mexican bond investors’ long-term inflation expectations have been little affected by the recent rise in inflation. Instead, the rise in inflation compensation reflects a notable uptick in the inflation risk premium to the high end of its historical range. This suggests that, despite inflation expectations being little changed on average, some investors are particularly concerned about the risk that inflation will remain above expected levels.

The recent rise in Mexican inflation

Figure 1 shows the year-over-year change in the Mexican consumer price index (CPI) measured both by the headline CPI (green line) and the more stable core CPI (blue line) that strips out volatile food and energy prices. Also shown with a horizontal gray line is the 3% inflation target of the nation’s central bank, the Bank of Mexico.

Figure 1: Mexican consumer price index inflation
Mexican consumer price index inflation
Source: Instituto Nacional de Estadística y Geografía.

We note that Mexican CPI inflation has averaged somewhat above the Bank of Mexico’s target since its adoption in 2002. More importantly, CPI inflation in Mexico appears to have become more volatile and somewhat higher over the past five years. Although previous research by De Pooter et al. (2014) found inflation expectations in Mexico to be well anchored, the significant global economic dislocations caused by the coronavirus pandemic and related inflationary pressures could impact inflation expectations of businesses and households.

To assess the persistence of the recent rise in Mexican inflation, we turn to financial market data, which reflect forward-looking expectations among a large and diverse group of investors and financial market participants. Specifically, we consider prices of conventional fixed-coupon bonds that pay a nominal interest rate and inflation-indexed bonds that pay a real interest rate because their cash flows are adjusted with the change in the CPI and therefore maintain their purchasing power. Both types of securities are issued and guaranteed by the Mexican government.

The difference between nominal and real yields for bonds of the same maturity is known as breakeven inflation (BEI). This represents a market-based measure of inflation compensation used to assess financial market participants’ inflation expectations. Figure 2 shows BEI rates at different maturities, meaning annual average rates of inflation compensation between now and maturity, from 1 to 10 years at the end of March 2021 (green line) and at the end of November 2022 (blue line). The slightly upward-sloping BEI curve of close to 3% in 2021 contrasts with the higher downward-sloping BEI curve in 2022.

Figure 2: BEI curves for 1-year to 10-year Mexican bond maturities
BEI curves for 1-year to 10-year Mexican bond maturities
Source: Authors’ calculations using bond prices from Bloomberg.

The increase for shorter maturities, the left end of the 2022 BEI curve, is closely tied to the current high level of inflation and suggests inflation may remain elevated for some time. In contrast, the increase at longer maturities, the right end of the 2022 BEI curve, suggests that investors’ longer-term inflation expectations may be drifting above the Bank of Mexico’s inflation target. To better understand the shape and sources of variation of the BEI curve we use a yield curve model.

A yield curve model of nominal and real yields

Market-based measures of inflation compensation such as BEI rates contain three components. First, they include the average CPI inflation rate expected by bond investors, which is the focus here. Second is an inflation risk premium to compensate investors for the uncertainty of future inflation. This premium is embedded in nominal yields that provide no inflation protection. Third is the difference in relative market liquidity between standard fixed-coupon and inflation-indexed bonds. As discussed in BCFZ, both of these types of Mexican bonds are less liquid than U.S. Treasuries, and their prices therefore contain a discount to compensate investors for their liquidity risk. Neither the inflation risk premium nor the liquidity premiums are directly observable and must therefore be estimated.

To adjust for these challenges, we first use the nominal and real yields model developed in BCFZ to identify liquidity premiums in standard fixed-coupon and inflation-indexed bond prices as a function of the time since issuance and the remaining time to maturity. The time since issuance serves as a proxy for declining liquidity as, over time, a larger fraction of bonds gets locked into buy-and-hold strategies. We refer to the observed BEI net of estimated liquidity premiums as the adjusted BEI. In a second step, we then separate adjusted BEI into components representing investorsinflation expectations using a formula based on the absence of bond market arbitrage opportunities and the residual inflation risk premium.

Results

To assess whether investorsinflation outlook has fundamentally changed, we follow De Pooter et al. (2014) and examine the five-year forward BEI rate that starts five years ahead, denoted 5yr5yr BEI. This is a horizon sufficiently long into the future that most transitory shocks to the economy can be expected to have vanished. Hence, the embedded inflation expectations are presumably less affected by current high inflation and pandemic-related transitory conditions and can therefore speak to the question about the anchoring of inflation expectations in Mexico.

Figure 3 shows the breakdown of 5yr5yr BEI into its various components according to our model. The dark blue line is the observed BEI, and the red line is the estimated adjusted BEI without liquidity risk premiums or other residual disturbances. The difference between these two measures of BEI—the yellow shaded area—represents the model’s estimate of the net liquidity premium or distortion of the observed BEI series due to risk premiums in both nominal and inflation-indexed bond prices. The adjusted BEI is entirely above the observed BEI, suggesting the liquidity risk distortions are systematically larger in the inflation-indexed bond prices, consistent with similar evidence from the U.S. Treasury market (Andreasen and Christensen 2016). Note that the net BEI liquidity premium widened around the financial turmoil in spring 2020 at the start of the pandemic and remains elevated.

Figure 3: Components of 5yr5yr breakeven inflation for Mexico
Components of 5yr5yr breakeven inflation for Mexico
Source: Survey forecasts from Consensus Economics and authors’ calculations using bond prices from Bloomberg.

The model also allows us to break down the adjusted BEI into an expected inflation component (light blue line) and the residual inflation risk premium (green line). Also shown is the Bank of Mexico’s 3% inflation target (gray horizontal line). For comparison, the figure also shows the 5yr5yr expected CPI inflation in Mexico reported semiannually in the Consensus Forecasts surveys (dark blue squares). We note that both observed and adjusted BEI have trended higher since the start of the pandemic in early 2020. Importantly, the breakdown indicates that long-term expected inflation in Mexico has remained stable, slightly above the 3% inflation target. As a result, the increase in BEI can be attributed to the inflation risk premium, which is at the high end of its historical range towards the end of our sample. Given the elevated levels of current inflation, this suggests some investors are concerned that inflation could remain elevated for longer than currently anticipated.

This raises the question of whether long-term inflation expectations in Mexico are likely to remain anchored near their current level going forward. To assess this risk, we simulate 10,000-factor paths over a three-year horizon using the estimated factors and factor dynamics as of November 2022—that is, the simulations are conditioned on the shapes of the nominal and real yield curves and investors’ embedded forward-looking expectations as of November 2022. These simulated factor paths are then converted into forecasts of 5yr5yr expected inflation. Figure 4 shows the median projection (solid green line) and the 5th and 95th percentile values (dashed green lines) for the simulated 5yr5yr expected inflation over a three-year horizon.

Figure 4: Three-year projections of 5yr5yr expected inflation, Mexico
Three-year projections of 5yr5yr expected inflation, Mexico
Source: Authors’ calculations.

Our model projections indicate that long-term inflation expectations are likely to deviate only modestly from their current level, consistent with the variation of the historical estimates back to 2009. Overall, our findings represent tangible evidence that long-term inflation expectations remain well-anchored in Mexico despite the recent rise in inflation.

Conclusion

Global inflation pressures in the aftermath of the pandemic have raised fears about a sustained increase in the level of inflation around the world, which could be particularly challenging for developing economies with monetary policy guided by an inflation target. In this Letter, to assess this risk for a major emerging economy with an established inflation target, we examine the variation in Mexico’s nominal and inflation-indexed bond prices, while accounting for their respective liquidity risk premiums. This allows us to estimate Mexican bond investors’ inflation expectations and associated risk premiums. The results reveal that the inflation risk premium has pushed up Mexican BEI rates in recent years, while investors’ long-term inflation expectations have remained stable near the Bank of Mexico’s inflation target despite the rise in inflation.

The policy path needed to keep inflation expectations anchored in a situation with highly elevated inflation may involve tradeoffs. The Bank of Mexico responded early and forcefully to inflation pressures starting in June 2021 and has indicated further tightening of the policy rate would likely be appropriate to bring inflation back down to target over the medium term. This could lower economic growth in Mexico in both 2022 and 2023. On the other hand, history shows that it may be difficult and costly to reverse extended departures from announced inflation targets. Thus, it will be important for central banks with inflation-targeting frameworks to monitor measures of long-term inflation expectations in the current situation.

Remy Beauregard
Economics Ph.D. student, University of California at Davis

Jens H.E. Christensen
Research Advisor, Economic Research Department, Federal Reserve Bank of San Francisco

Eric Fischer
Financial modeling and quantitative analytics principal, Markets Group, Federal Reserve Bank of New York

Simon Zhu
Economics Ph.D. student, University of Texas at Austin

References

Andreasen, Martin M. and Jens H.E. Christensen. 2016. “TIPS Liquidity and the Outlook for Inflation.” [PDFFRBSF Economic Letter 2016-35 (November 21).

Beauregard, Remy, Jens H.E. Christensen, Eric Fischer, and Simon Zhu. 2021. “Inflation Expectations and Risk Premia in Emerging Bond Markets: Evidence from Mexico.” [PDF] FRB San Francisco Working Paper 2021-08.

De Pooter, Michiel, Patrice Robitaille, Ian Walker, and Michael Zdinak. 2014. “Are Long-Term Inflation Expectations Well Anchored in Brazil, Chile, and Mexico?” [PDFInternational Journal of Central Banking 10(2), pp. 337–400.

[Archived PDF]