GPIF, one of the largest national pension funds in the world, is likely to rebalance its assets from non-yen bonds to yen bonds, signaling a big turn in Japan’s cross-border capital flows.
[from Japan Macro Advisors, 10 September, 2026]
Key takeaways
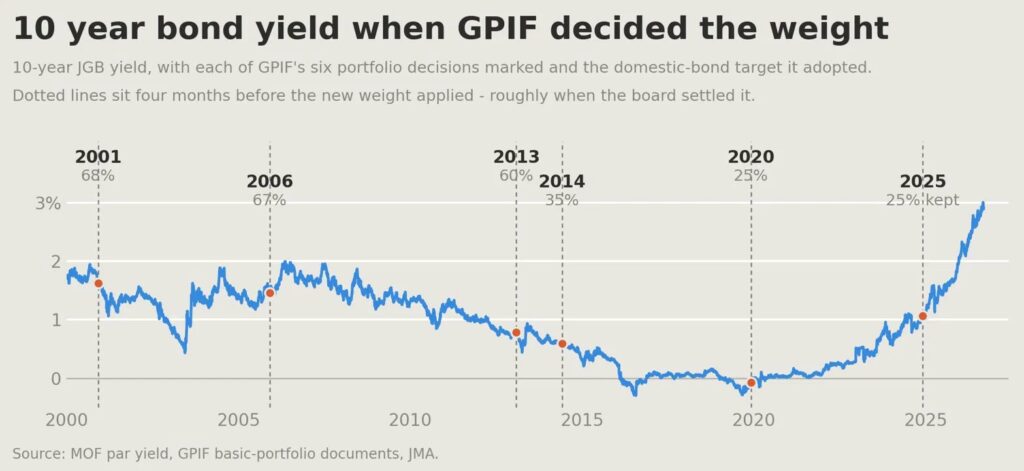
- In 2013, GPIF’s investment committee, chaired by UEDA Kazuo [植田和男], now the BoJ governor, saw a fair chance of a JGB crash within five to ten years. Its CEO priced the crash as the 10-year rising from 0.5% to 3%. Subsequently, GPIF cut its target weight for domestic bonds from 60% to 25% as an emergency measure against abnormally low yields.
- The 10-year is now at 3%. On my replication of GPIF’s own allocation rule, a real return on JGBs near zero points to a 50% weight in domestic bonds, against 25% today. I expect GPIF to raise the weight, if it has not already started in the September quarter.
- How GPIF decides its asset allocation and communicates it publicly is a very delicate and political issue. But regardless of how it communicates it, a change in asset allocation is inevitable. In my view, it signifies a big turn in Japan’s cross-border capital flows.
Japan has one of the Largest Pension Funds in the World
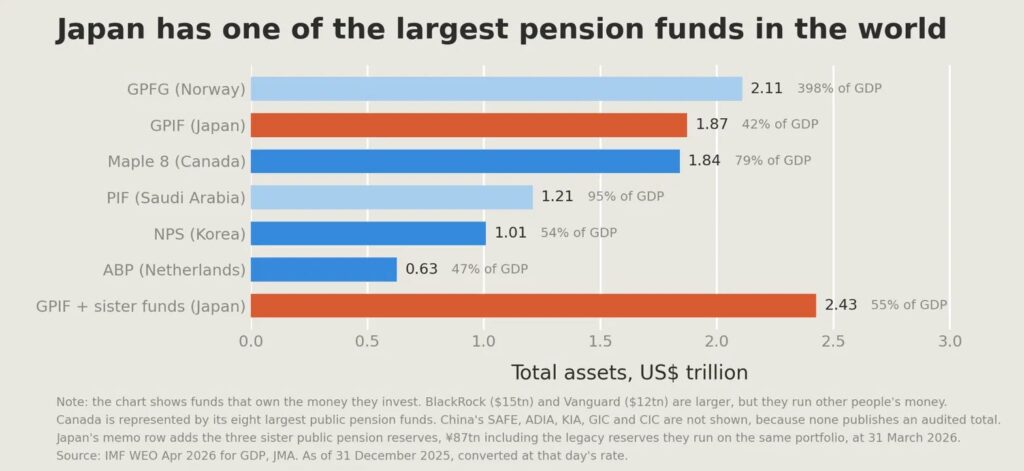
Japan has the second largest public pension fund in the world. Norway’s is the biggest, although it is not strictly a pension fund. Canada’s pension funds, when all eight of its variants are added together, come a close third.
Japan set up its first national pension fund in 1961 and it has since gone through various reforms and reorganization over the last 65 years. Its current form is called the Government Pension Investment Fund (GPIF). As explained in a later section, GPIF has a few siblings, and when we add them together, Japan’s public pension funds can be said to be the largest in the world.
Chart 1
GPIF used to invest most of its asset into JGBs
GPIF used to invest the majority of its fund as loans to the national government and into Japanese government bonds (JGBs). At the end of FY2012, 62% of its assets consisted of domestic bonds. However, in 2014 it went through a radical asset reallocation and the target weight for domestic bonds was reduced from 60% to 35%, and then further down to 25% in 2020. Its current target allocation is a clean four-way 25% split into domestic bonds, domestic equity, foreign equity and foreign bonds.
As one of the largest pension funds in the world, its asset allocations attract market attention and there is speculation that it is about to raise its allocation into domestic bonds. In my view, there is indeed a very high chance that GPIF will be raising its allocation into domestic bonds, if it has not already started to do so in the current quarter ending in September 2026.
Chart 2
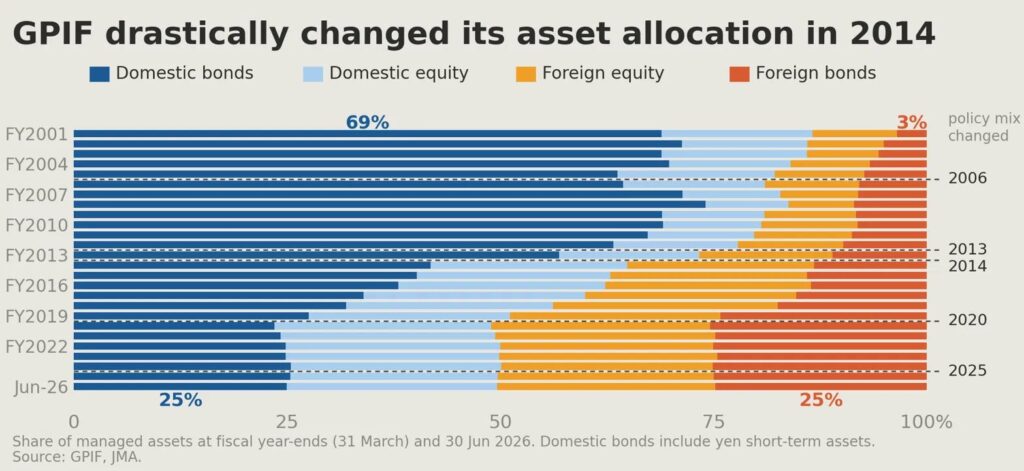
UEDA in 2013 Saw a Bond Crash Coming
To understand why GPIF is highly likely to raise its allocation into domestic bonds, we need to go back in history to 2013. Why 2013? Of course, it is the year the Bank of Japan (BoJ) started its massive quantitative easing. The 10-year JGB yield started 2013 at 0.8% and it fell to 0.3% by the end of 2015 before briefly hitting a negative rate of -0.3% in 2016. If you were the chairperson of the GPIF investment committee, you would have been concerned about the wisdom of continuing to invest in JGBs at such a policy-driven low rate. The actual chairperson was UEDA Kazuo [植田和男], the current BoJ governor. In the minutes for October 2013, UEDA said, “I think there is a fair chance that bonds will crash at some point in the next five to ten years [unofficial translation].”
The minutes were released only seven years later; otherwise the use of the word “crash” would have been controversial.
GPIF CEO Priced the Crash at 3% in 2014. We Are There Now
If you read through the GPIF minutes between 2013 and 2014, you would see that GPIF officials were increasingly conscious of the precariousness of investing in JGBs. Long story short, as this process was highly political and a sensitive subject, they decided to radically lower the target allocation weight for JGBs to 35% in 2014, presented it as the result of a philosophical change in the way GPIF is managed and how the concept of “risk” should be considered. Investment in JGBs was no longer considered low risk in real terms. The asset allocation for domestic bonds was further lowered to 25% in 2020. The following is what MITANI Takahiro [三谷隆博], the GPIF CEO at the time and an ex-BoJ senior official, said in the October 2014 GPIF minutes.
“Yields are just under 0.5% now, so a move to near 3% would mean a loss of about ¥25 trillion. (…). So I think the clearest way to explain it is that reducing the weight on JGBs to some degree is simply unavoidable [unofficial translation]”
The 2014 cut in the weight was partly an emergency escape
As I wrote earlier, the radical asset reallocation in 2014 was part a shift in the concept of risk from “nominal” to “real”, so that JGB is no longer risk free assets. But the change was also at least partly an emergency measure to escape the abnormally low-yield environment. Then the next natural question is, now that the JGB yields are no longer abnormally low, what should happen to its asset allocation? Pensions are paid in yen, so long-duration Japanese government bonds are a natural match, while GPIF should also be holding some non-yen assets and equities to diversify its assets and protect the overall balance sheet from inflation. In the next section, I will show you a simplified replication of how GPIF decides its asset allocation and what GPIF’s asset allocation could be now that JGB yields are normal.
How GPIF decides its weights
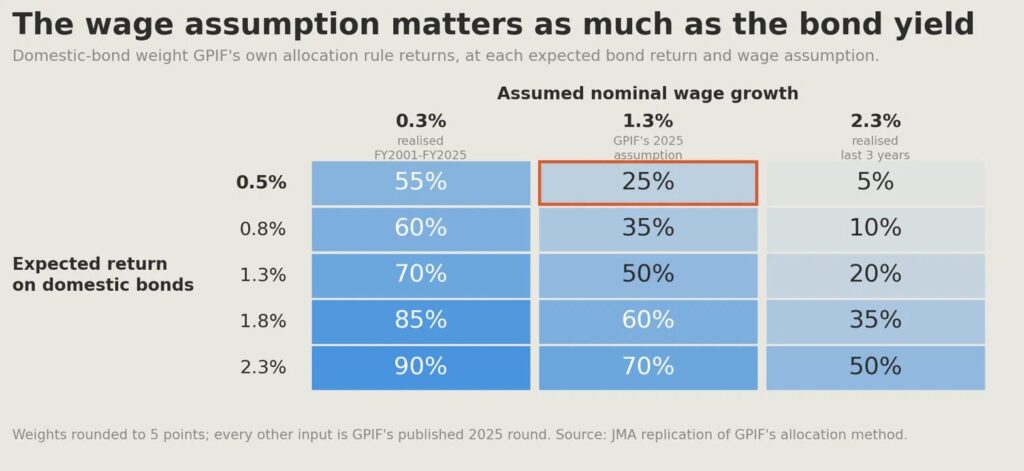
Put simply, GPIF’s target weights are the output of an optimizer with a few rules. Find the portfolio that, at the required real return, has the smallest average shortfall below wage growth in the years when it falls short, and round it to the nearest 5%.
When GPIF last decided to keep the current 25% weight for domestic bonds in 2025, JGBs were assumed to produce a nominal return of 0.5% against wage growth of 1.3%, so a real return of minus 0.8%. Exhibit 1 shows a simplified matrix of weights depending on expected nominal return on bonds and wage growth. The red box shows the assumption behind the 2025 weights decision mentioned above. If we use a higher wage growth assumption of 2.3%, an expected nominal return of 1.8% on bonds gives a weight of 35%. GPIF’s bond portfolio has an average maturity around 10 years, and the 10-year bond is yielding 3% now. A lot of thought and estimation is needed to form a view on the expected real return on domestic bonds, but in my view, it is clear that the minus 0.8% used in their last review is too low given where bond yields are.
Why GPIF kept the weight in 2025 and why circumstances changed
In late 2024 when the GPIF was reviewing the weight as part of its five-year plan, the BoJ was already in the process of exiting from QE and raising its policy rate. However, the JGB market was still in the process of adjustment and bond yields had a lot of room to rise. For example, the 10-year yield was 0.89% at the end of September 2024, rose to 2% by the end of 2025 and now, in September 2026, stands at 3%. You can understand why GPIF decided to keep its weight on domestic bonds unchanged as it would have incurred capital losses on bond purchases in 2025. But in my view, as I wrote in the report “The Long Climb in JGB Yields Is Nearly Over” [archived PDF], long bond yields are getting closer to a stability point. If the GPIF board shares my view, it is a good time to think about raising its target weight into domestic yen bonds.
The Whale Problem and the Washington Problem
How high should the new weight be for domestic bonds? The reality of determining appropriate weights and how to announce it is a lot harder than the simplified model I explained above. Other than forming a reasonable view on the expected real return on asset classes, there are a few factors that complicate the process.
Firstly, GPIF needs to think about how such an announcement would affect the market. GPIF is what financial market professionals call a whale, a massive investor whose investment decisions sway market prices. There is also a related argument that given the dominance of GPIF in the domestic market, GPIF should be increasing its asset weight abroad to reduce its impact on domestic asset markets.
Secondly, changing asset allocation weights carries political considerations. If GPIF decides to raise the target weight for domestic bonds, foreign bonds are the likely asset class whose weight will go down. More than 50% of its foreign bonds are in US dollars. With all the news circulating in the market now, Scott Bessent will not like a public announcement that one of the largest pension funds in the world is reducing its purchase of US treasuries. There are domestic political considerations as well, as the Takaichi government contemplates how best to fund its deficits.
These are the issues GPIF officials must be debating. How GPIF decides its asset allocation in the near future will be a revealing case study for those who want to study how policy-making works in Japan. Those who are interested in this topic should read the transcripts of an interesting government committee in 2014 that focused on how GPIF could shield itself from political meddling. Guess who chaired the committee? UEDA Kazuo [植田和男].
Whatever the near-term decision GPIF makes regarding its target weight, I think it is fairly clear that GPIF should be increasing its investment into domestic bonds. The following table shows how much GPIF could buy in net terms, depending on the eventual rise in the target weight.
How much GPIF buys: ¥32tn at 35%, ¥80tn at 50%
| Domestic Bond Target | GPIF Buys | With the Sister Funds |
|---|---|---|
| 30% | ¥16tn | ¥20tn |
| 35% | ¥32tn | ¥20tn |
| 40% | ¥48tn | ¥20tn |
| 50% | ¥80tn | ¥20tn |
Additional domestic-bond holdings from re-weighting the fund at 30 June 2026 (managed assets ·317.8tn). Foreign bonds sold first.
Source: GPIF, JMA.
Three things in this table matter for the market. GPIF is allowed to deviate its asset allocation by six points either side of 25% without any announcement, so 39% target is already possible without any public announcement. In 2014 GPIF moved inside its band first and announced the new portfolio afterwards, and I would expect the same sequence this time. Second, these are static figures, which do not account for the growth of the fund over time.
The sister funds move with the whale
As mentioned earlier, GPIF has a few siblings. The Pension Fund Association for Local Government Officials (¥35.5tn), the Federation of National Public Service Personnel Mutual Aid Associations, known as KKR (¥11.5tn), and the Promotion and Mutual Aid Corporation for Private Schools of Japan (¥4.9tn) manage the pension reserves of local government employees, national government employees and private-school teachers. These sisters run their funds on the same 25/25/25/25 model, and with the legacy reserves they also run, they hold a further ¥87tn on top of GPIF’s.
Conclusion
GPIF cut its domestic bond weight from 60% to 35% in 2014, and later to 25%, to safeguard its assets from the manipulated low JGB yields at the time and the eventual crash they foresaw. That crash, as GPIF’s CEO MITANI defined it in 2014, has now happened with the 10-year yield rising to 3%. In my view, JGB yields have largely normalized and there is no emergency reason to avoid domestic bonds. It is only natural that GPIF would raise its allocation into domestic bonds, although how GPIF communicates this publicly is a touchy issue they need to figure out. When GPIF raises its domestic bond allocation, foreign bonds are the likely asset class to take the hit. GPIF publishes quarterly results and the next publication for the end-September 2026 quarter, expected in early November 2026, will be closely watched. Judging from market movements in the last few weeks, the market has started to sense that what I described in this article is already happening and Japanese money is starting to come back to the yen. While it should be characterized as rebalancing, rather than a repatriation, it seems we are observing a big turn in Japanese cross-border capital flows.