Economics-Watching: FedViews for January 2023

[from the Federal Reserve Bank of San Francisco]

Adam Shapiro, vice president at the Federal Reserve Bank of San Francisco, stated his views on the current economy and the outlook as of January 12, 2023.

  • While continuing to cool over the last several months, 12-month inflation remains at historically high levels. The headline personal consumption expenditures (PCE) price index rose 5.5% in November 2022 from a year earlier. This marks a decline in inflation to a level last observed in October 2021, but still well above the Fed’s longer-run goal of 2%. A portion of the inflation moderation is attributable to recent declines in energy prices. Core PCE inflation, which removes food and energy prices, has shown less easing.
  • Owing to fiscal relief efforts and lower household spending over the course of the pandemic, consumers accumulated over $2 trillion dollars in excess savings, based on pre-pandemic trends. Since then, consumers have drawn down over half of this excess savings which has helped support recent growth in personal consumption expenditures. A considerable amount of accumulated savings remains for some consumers to support spending in 2023.
  • In the wake of the pandemic, consumer spending patterns shifted away from services towards goods. While there appears to be some normalization of spending behavior, this shift has generally persisted. Real goods spending remains significantly above its pre-pandemic trend, driven by strong demand for durables such as furniture, electronics, and recreational goods. Spending on services has shown a resurgence but remains below its pre-pandemic trend.
  • Supply chain bottlenecks for materials and labor remain a constraint on production, although there are some recent signs of easing. The fraction of manufacturers who reported operating below capacity due to insufficient materials peaked in late 2021 and has moderately declined over the past year. However, the fraction of manufacturers reporting insufficient labor has persisted at high levels.
  • The labor market remains tight, despite some signs of cooling. The number of available jobs remains well above the number of available workers, although vacancy postings have been trending down in recent months. The tight labor market has put continued upward pressure on wages and labor market turnover.
  • A decomposition of headline PCE inflation into supply– and demand-driven components shows that both supply and demand factors are responsible for the recent rise in inflation. The surge in inflation in early 2021 was mainly due to an increase in demand-driven factors. Subsequently, supply factors became more prevalent for the remainder of 2021. Supply-driven inflation has moderated significantly over recent months, while demand-driven inflation remains elevated.
  • The Federal Open Market Committee (FOMC) raised the federal funds rate by 50 basis points at the December meeting to a range of 4.25 to 4.5%. This cycle of continued rate increases since March of last year represents the fastest pace of monetary policy tightening in 40 years. The increase in the federal funds rate has been accompanied by a gradual reduction in the size of the Federal Reserve’s balance sheet.
  • Economic activity in sectors such as housing, which is sensitive to rising interest rates, has slowed considerably in recent months. Housing starts have fallen steadily over the past year, as have other housing market indicators, such as existing home sales and house prices.
  • Although the labor market is currently very strong, financial markets are pointing to some downside risks. Namely, the difference between longer- and shorter-term interest rates has turned negative, which historically tends to occur immediately preceding recessions. It remains unclear whether lower longer-term yields are indicative of anticipated slower growth or lower inflation.
  • Short-term inflation expectations remain elevated relative to their pre-pandemic levels in December 2019. Consumers are expecting prices to rise 5% this year, while professional forecasters are expecting prices to rise 3.5%. Longer-term inflation expectations remain more subdued, indicating that both consumers and professionals believe inflation pressures will eventually dissipate.
  • Rent inflation is expected to remain high over the next year. The prices for asking rents have grown quite substantially over the last two years. As new leases begin and existing leases are renewed, these higher asking rents will flow into the stock of rental units, putting upward pressure on rent inflation.
  • We are expecting inflation to moderate over the next few years as monetary policy continues to restrain demand and supply bottlenecks continue to ease. We anticipate that it will take some time for inflation to reach the Fed’s longer-run goal of 2%.
Inflation is cooling, but remains very high
Savings are boosting consumer demand
Goods consumption remains elevated
Supply shortages are prevalent, but easing
Labor market remains tight, but is cooling
Both supply and demand drive inflation
Monetary policy tightening is having real effects
Yield curve is inverted, signaling recession risk
Short-term inflation expectations remain elevated
High rent inflation is in the pipeline
Inflation likely to remain above 2% for some time

[Archived PDF]

Read other issues from FedViews.

Credit Conditions in the Pandemic Mortgage Market

[from the Federal Reserve Bank of San Francisco]

by John Mondragon

The recent rapid rise in house prices has raised some questions about the potential risk to broader financial stability. However, credit quality in the mortgage market appears to be very high, and lending standards tightened in early 2020. While low interest rates increased the demand for refinancing, evidence from large nonconforming loans shows that credit supply contracted sharply in March 2020 and remained tight through the early pandemic period. The shift in credit supply suggests that lenders adjusted their standards to mitigate some risk in the housing market.

Read the full article [Archived PDF]

Economy-Watching: Supply Chain Pressures

[from the Federal Reserve Bank of New York’s Applied Macroeconomics and Econometrics Center]

Global Supply Chain Pressure Index: June 2022 Update

A new reading of the Global Supply Chain Pressure Index has been posted.

The GSCPI compiles more than two dozen metrics across seven economies—data on global transportation costs and regional manufacturing conditions—to track shifts in supply chain pressures from 1997 to the present.

The GSCPI will be updated regularly at 10 AM ET on the fourth business day of each month. The index was first introduced through a Liberty Street Economics post in early January 2022 [archived PDF], with subsequent blog posts in late January 2022 [archived PDF] and March 2022 [archived PDF].

The GSCPI is a product of the Federal Reserve Bank of New York’s Applied Macroeconomics and Econometrics Center.

View the Index.

U.S. Labor Trends: Atlanta Fed’s Labor Market Tracking Tools Updated with May Data

[from the Federal Reserve Bank of Atlanta’s Center for Human Capital Studies]

What do May employment data from the U.S. Bureau of Labor Statistics mean for the outlook for labor markets? Find out in the Atlanta Fed’s Labor Market Distributions Spider Chart, Jobs Calculator, and Labor Market Sliders.

Want to see even more economic data? Our EconomyNow app will put GDPNow and all our data tools right in your hands. Download it today to see the latest data on inflation, growth, and the labor market.

San Francisco Fed Economic Letter: Estimating Natural Rates of Unemployment

[Federal Reserve Bank San Francisco Economic Letter 2022-14, by Brandyn Bok and Nicolas Petrosky-Nadeau]

Before the pandemic, the U.S. unemployment rate reached a historic low that was close to estimates of its underlying longer-run value and the short-run level associated with an absence of inflationary pressures. After two turbulent years, unemployment has returned to its pre-pandemic low, and the estimated underlying longer-run unemployment rate appears largely unchanged. However, economic disruptions appear to have pushed up the short-run noninflationary rate substantially, as high as 6%. Examining these different measures of the natural rate of unemployment can provide useful insights for policymakers.

Read the full article [archived PDF].

Research Update: Oil Price Dynamics Report, March 28

Our oil price decomposition, reported weekly, examines what’s behind recent fluctuations in oil prices: demand factors, supply factors, or some combination of the two?

(from the Federal Reserve Bank of New York)

Highlights

Oil prices increased over the past week, mostly owing to lower supply.

Read the full report [Archived PDF].

View the data [Archived Excel XLS].

Economy Watching: Philadelphia Fed

from the Federal Reserve Bank of Philadelphia:

Fed President Patrick Harker Says It Will “Soon” Be Time to Taper Asset Purchases

Philadelphia Fed President Patrick Harker told a virtual audience at the Prosperity Caucus in Washington, D.C., that the asset purchases once necessary during the acute phase of the COVID-19 pandemic are no longer effective as a tool for supporting the economy. He also said the U.S. economy created millions of jobs in recent months, but “we just can’t fill them.”

Economic Outlook: Growth Despite Constraints

Good evening! Thanks so much for having me. I understand that when this group meets in person there is usually pizza involved — so I intend to collect on that debt next time we do this in the flesh.

I plan to offer a few remarks about the state of the national economy and the path of Federal Reserve policy. Then we can move to our Q&A, which I’m really looking forward to.

But before I do that, I need to give you the standard Fed disclaimer: The views I express today are my own and do not necessarily reflect those of anyone else on the Federal Open Market Committee (FOMC) or in the Federal Reserve System.

Fed Structure

I know this group encompasses a very diverse crowd — we have everyone from House staffers to Senate staffers here. So, just in case anyone doesn’t know, I want to begin by giving you a very brief explanation of what, exactly, a regional Federal Reserve Bank is. Our nation’s central bank, after all, is quite unusual — unique, even — in its design.

The configuration of the Federal Reserve System — a central bank with a decentralized structure — owes its existence to the 1913 Federal Reserve Act. It is something of a testament to old-fashioned American compromise and reflects the unique demands of the United States and our economy.

The System consists of a Board of Governors, which sits in Washington, and 12 regional Banks around the country.

The Board seats seven governors, including the Chair. Each regional Bank has its own president and board of directors, which is made up of business, banking, and community leaders from the area. Fundamentally, this provides the Fed with a perspective — within each District — of the sectors and issues that make the region tick. Mine is the Third District, which encompasses eastern Pennsylvania, South Jersey, and the state of Delaware. We’re the smallest District geographically, but I like to think we punch above our weight.

The FOMC, which is responsible for monetary policy, is composed of the Fed’s governors and regional Bank presidents. Regional Bank presidents don’t always get to vote. Most of us rotate into a voting position every three years, but the governors always vote, as does the president of the New York Fed. New York, owing to the presence of Wall Street, enjoys something of a “first among equals” status within the System.

While the rest of us don’t always vote, we do always represent our Districts and play a part in the discussion. If you were at a normal FOMC meeting, you probably wouldn’t be able to tell a voting member until the end of the meeting when it’s time to raise hands. Everybody contributes.

The Fed’s decentralized nature is, in my view, a unique strength. We’re making national policy, but we’re doing it for an enormous country, and the averages of economic data can obscure realities on the ground. Conditions look very different in Philadelphia, Dover, or Washington than they do in Dallas, Salt Lake City, or Honolulu. This System gives a voice to a range of localities and sectors. It also allows us to focus on regional issues within each Bank’s District.

The United States has a unique set of needs. It’s easy to forget that we’re an outlier because we’re such a massive country: Only Russia and Canada are bigger geographically, only China and India have larger populations, and no one country has a bigger economy, at least for now. And that economy is vast, spreading across sectors and natural resources in a way that is not typical of other nations.

So, it makes sense that we have a System that feeds back information from around the country.

The State of the Economy

And what that information is telling us is that, for the past 18 months, the economy has moved in tandem with the waxing and waning of the COVID-19 pandemic. During periods when case rates and hospitalizations have declined, the economy has surged as American consumers have voted with their wallets. When COVID-19 risks abate, more Americans dine out at restaurants, check in to hotels, and fill up airplanes. Those are important categories of spending in a country where consumption makes up about 70 percent of total economic activity. In the second quarter of this year, for instance, GDP grew at a very healthy annualized rate of around 6.7 percent as case rates plummeted.

And, of course, the opposite occurs during periods when the virus spikes. When the Delta variant of COVID-19 erupted, fomenting the country’s fourth major wave of the pandemic, things started moving sideways. Consumer confidence tanked, and large industries like hospitality and leisure stagnated at best. So for this quarter, we can expect growth to come in at an annualized rate of around 3 percent, a sharp slowdown from earlier this year. 

But there are reasons to be sanguine that the country’s recovery from this wave of COVID-19 may prove more durable than in the past and that we can avoid a fifth wave. And that is because more than half of the country is fully vaccinated. Getting more shots into arms will save lives and aid the recovery by reducing the size and severity of future spikes. The Delta variant has also concentrated minds: It seems to have not only persuaded more Americans to get shots on their own, but it also pushed more corporations and institutions to mandate their employees to get vaccinated. That is cause for optimism.

Filling me with less optimism is the persistent constraints the economy is operating under.

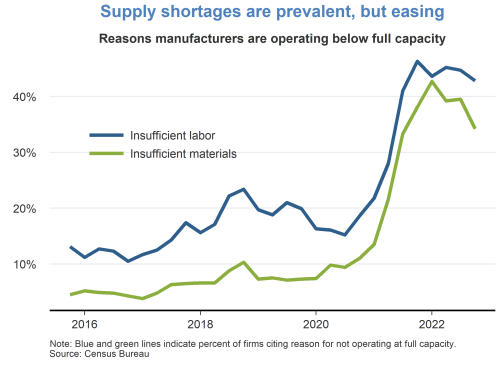
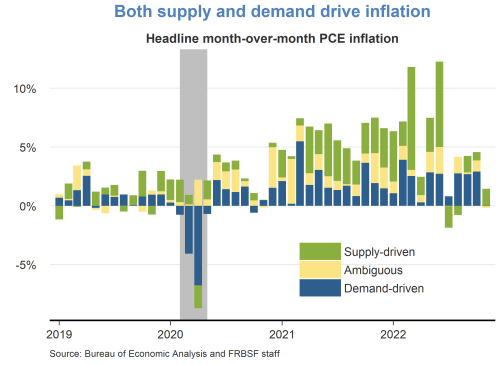
The COVID-19 pandemic has revealed how fragile many of our supply chains are. We’re now experiencing shortages of crucial parts like computer chips, which has hobbled not only the production of cars and trucks, but also comparatively smaller durable goods like home appliances. My recent experience attempting to purchase a printer — there were essentially none at my local electronics store — testifies to that. And good luck trying to find a new washing machine or dishwasher.

These supply chain constraints are rippling through the entire economy. Manufacturers in our region have reported having to curtail production because of difficulties securing raw materials. We’re also seeing low inventory of everything from shoes to backpacks to even chicken wings, which is a particularly troubling development as the NFL season is picking up. Unfortunately, there are indications that these constraints could persist for a couple of more years.

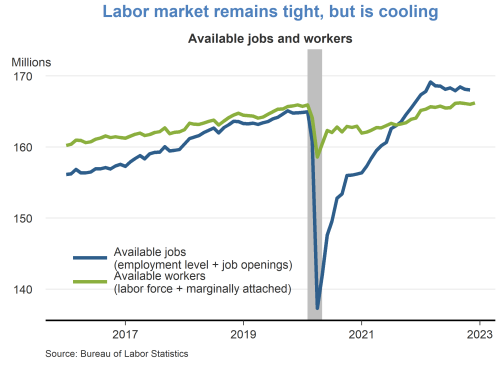
There’s another input lacking in supply as well, further constraining the economy: labor. It isn’t true, as was widely reported, that the economy only created 194,000 jobs in September. In reality, the U.S. economy has created many millions of jobs in recent months — we just can’t fill them. Indeed, job openings are at record highs, hitting nearly 10.5 million at the end of August. Simultaneously, more people are quitting their jobs, and the rate at which open positions are being filled is continuing to slow.

It seems that a combination of factors — trouble accessing childcare or eldercare, lingering fears about the virus, the rise in equities and home values spurring people to retire, and perhaps a general revaluation of life choices — is persuading a lot of Americans to stay on the sidelines even as the economy has reopened. And notably, the elimination of extra federal unemployment benefits has not — at least not yet — appeared to nudge people back into the workforce. I do expect that will change eventually and especially as other forbearance programs run out.

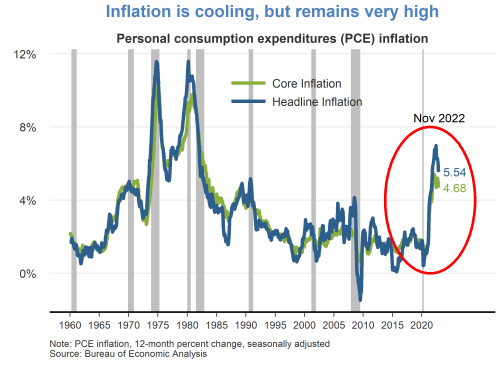
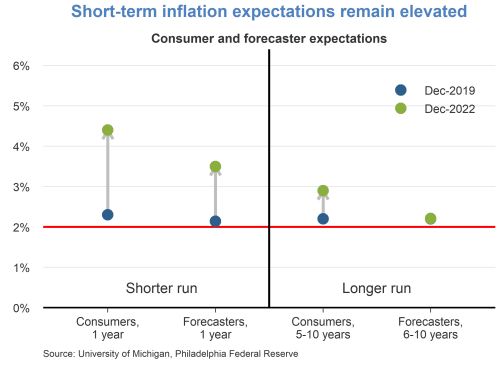
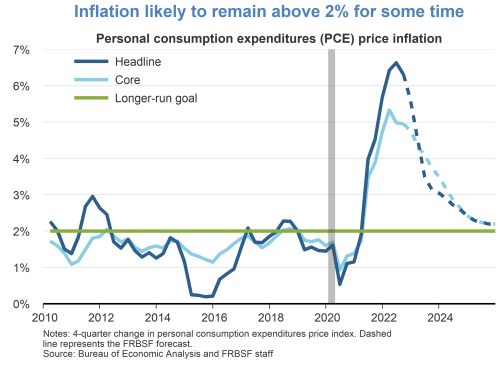
So, where does all of this leave us? For 2021, I would expect GDP growth to come in around 5.5 percent, which is a downward revision from before Delta took hold. Growth will then moderate to about 3.5 percent in 2022, and 2.5 percent in 2023. Inflation, meanwhile, should come in around 4 percent for 2021, though I do see upside risk here. After that, our modal forecast — that is, the average of all of our forecasts — calls for inflation of a bit over 2 percent for 2022 and right at 2 percent in 2023.

Fed Policy

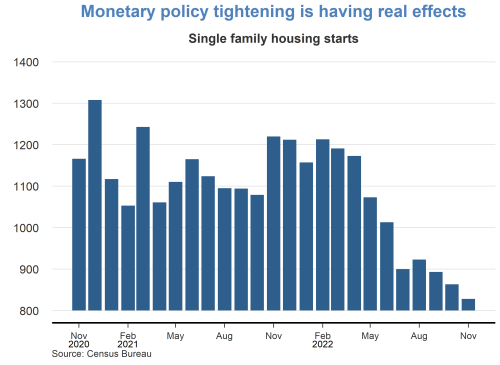
In terms of monetary policy, I am in the camp that believes it will soon be time to begin slowly and methodically — frankly, boringly — taper our $120 billion in monthly purchases of Treasury bills and mortgage-backed securities. This comes down to the efficacy of these purchases as a tool.

They were necessary to keep markets functioning during the acute phase of the crisis. But to the extent that we are still dealing with a labor force issue, the problem lies on the supply side, not with demand. You can’t go into a restaurant or drive down a commercial strip without noticing a sea of “Help Wanted” signs. Asset purchases aren’t doing much — or anything — to ameliorate that.

After we taper our asset purchases, we can begin to think about raising the federal funds rate. But I wouldn’t expect any hikes to interest rates until late next year or early 2023, unless the inflation picture changes dramatically.

Conclusion

Given the strong headwinds facing the economy, it is a testament to its underlying strength that growth continues at a relatively robust pace. That is a tribute, as always, to the ingenuity and tenacity of our people, especially in the face of huge challenges.

Thank you very much again for having me. And now let’s move on to questions.

Third Quarter 2019: Interest Rate Shift Helped Housing but Hurt Bank Net Interest Margins

(from the Federal Reserve Bank of San Francisco)

First Glance 12L provides a first look at banking and economic conditions within the 12th District. The report, “Interest Rate Shift Helped Housing but Hurt Bank Net Interest Margins,” [Archived PDF] notes that District banks’ average quarterly net interest margin slipped as lower interest rates and loan-to-asset ratios weighed on asset yields. The shifting asset mix contributed to margin compression but benefitted average liquidity and risk-based capital ratios. Districtwide loan and job growth cooled but remained above average, and lower interest rates boosted home prices, affordability, and homebuilding. In addition to supervisory hot topics, the report covers wildfire-related risks in California.

Read the full report [Archived PDF].

Essay 114: FRBSF Economic Letter: Involuntary Part-Time Work a Decade after the Recession

by Marianna Kudlyak

Involuntary part-time employment reached unusually high levels during the last recession and declined only slowly afterward. The speed of the decline was limited because of a combination of two factors: the number of people working part-time due to slack business conditions was declining, and the number of those who could find only part-time work continued to increase until 2013. Involuntary part-time employment recently returned to its pre-recession level but remains slightly elevated relative to historically low unemployment, likely due to structural factors.

Read the full article at the Federal Reserve Bank of San Francisco. [Archived PDF]

Index of Economic Letters.

Essay 70: Climate Change and the Fed

Speech by Governor Brainard on why climate change matters for monetary policy and financial stability.

At “The Economics of Climate Change” a research conference sponsored by the Federal Reserve Bank of San Francisco, San Francisco, California.

Released by the Board of Governors of the Federal Reserve System.
Visit them on the web at Federal Reserve Board.