Science-Watching: Why Do Batteries Sometimes Catch Fire and Explode?

[from Berkeley Lab News, by Theresa Duque]

Key Takeaways
  • Scientists have gained new insight into why thermal runaway, while rare, could cause a resting battery to overheat and catch fire.
  • In order to better understand how a resting battery might undergo thermal runaway after fast charging, scientists are using a technique called “operando X-ray microtomography” to measure changes in the state of charge at the particle level inside a lithium-ion battery after it’s been charged.
  • Their work shows for the first time that it is possible to directly measure current inside a resting battery even when the external current measurement is zero.
  • Much more work is needed before the findings can be used to develop improved safety protocols.

How likely would an electric vehicle battery self-combust and explode? The chances of that happening are actually pretty slim: Some analysts say that gasoline vehicles are nearly 30 times more likely to catch fire than electric vehicles. But recent news of EVs catching fire while parked have left many consumers – and researchers – scratching their heads over how these rare events could possibly happen.

Researchers have long known that high electric currents can lead to “thermal runaway” – a chain reaction that can cause a battery to overheat, catch fire, and explode. But without a reliable method to measure currents inside a resting battery, it has not been clear why some batteries go into thermal runaway, even when an EV is parked.

Now, by using an imaging technique called “operando X-ray microtomography,” scientists at Lawrence Berkeley National Laboratory (Berkeley Lab) and UC Berkeley have shown that the presence of large local currents inside batteries at rest after fast charging could be one of the causes behind thermal runaway. Their findings were reported in the journal ACS Nano.

“We are the first to capture real-time 3D images that measure changes in the state of charge at the particle level inside a lithium-ion battery after it’s been charged,” said Nitash P. Balsara, the senior author on the study. Balsara is a faculty senior scientist in Berkeley Lab’s Materials Sciences Division and a UC Berkeley professor of chemical and biomolecular engineering.

“What’s exciting about this work is that Nitash Balsara’s group isn’t just looking at images – They’re using the images to determine how batteries work and change in a time-dependent way. This study is a culmination of many years of work,” said co-author Dilworth Y. Parkinson, staff scientist and deputy for photon science operations at Berkeley Lab’s Advanced Light Source (ALS).

The team is also the first to measure ionic currents at the particle level inside the battery electrode.

3D microtomography experiments at the Advanced Light Source enabled researchers to pinpoint which particles generated current densities as high as 25 milliamps per centimeter squared inside a resting battery after fast charging. In comparison, the current density required to charge the test battery in 10 minutes was 18 milliamps per centimeter squared. (Credit: Nitash Balsara and Alec S. Ho/Berkeley Lab. Courtesy of ACS Nano)
Measuring a battery’s internal currents

In a lithium-ion battery, the anode component of the electrode is mostly made of graphite. When a healthy battery is charged slowly, lithium ions weave themselves between the layers of graphite sheets in the electrode. In contrast, when the battery is charged rapidly, the lithium ions have a tendency to deposit on the surface of the graphite particles in the form of lithium metal.

“What happens after fast charging when the battery is at rest is a little mysterious,” Balsara said. But the method used for the new study revealed important clues.

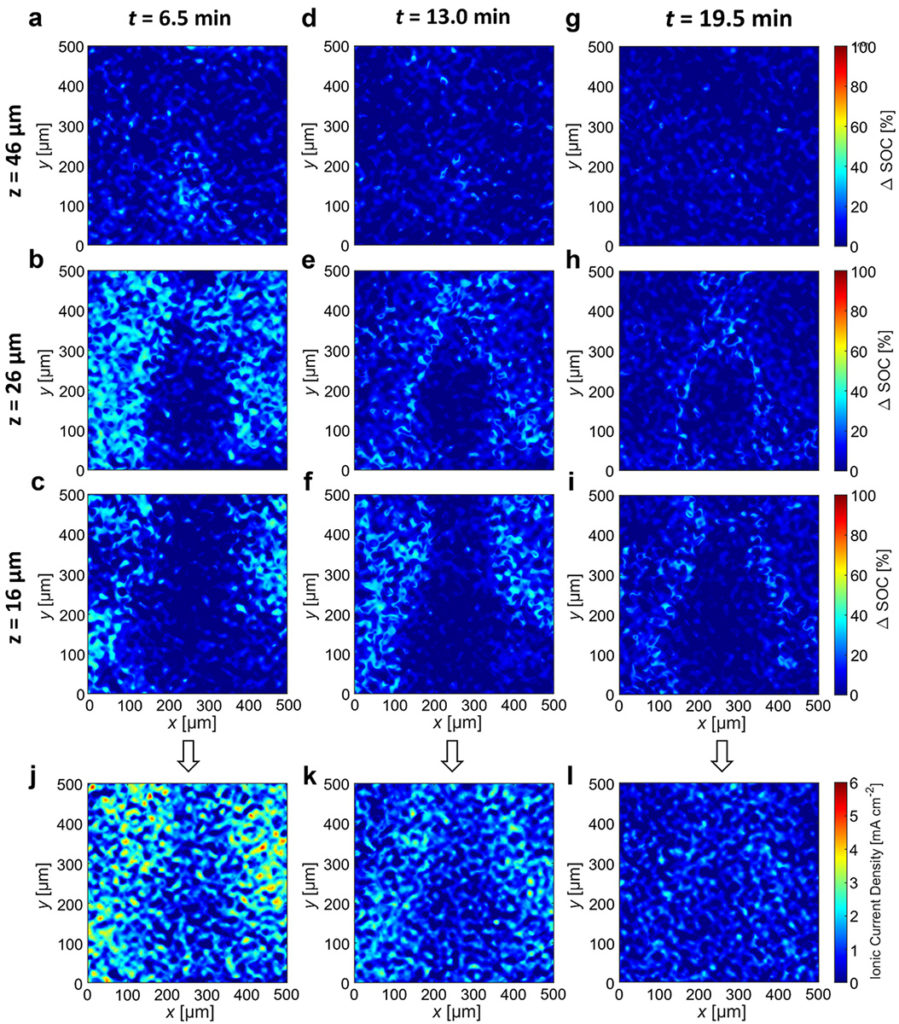
Experiments led by first author Alec S. Ho at the ALS show that when graphite is “fully lithiated” or fully charged, it expands a tiny bit, about a 10% change in volume – and that current in the battery at the particle level could be determined by tracking the local lithiation in the electrode. (Ho recently completed his Ph.D. in the Balsara group at UC Berkeley.)

A conventional voltmeter would tell you that when a battery is turned off, and disconnected from both the charging station and the electric motor, the overall current in the battery is zero.

But in the new study, the research team found that after charging the battery in 10 minutes, the local currents in a battery at rest (or currents inside the battery at the particle level) were surprisingly large. Parkinson’s 3D microtomography instrument at the ALS enabled the researchers to pinpoint which particles inside the battery were the “outliers” generating alarming current densities as high as 25 milliamps per centimeter squared. In comparison, the current density required to charge the battery in 10 minutes was 18 milliamps per centimeter squared.

The researchers also learned that the measured internal currents decreased substantially in about 20 minutes. Much more work is needed before their approach can be used to develop improved safety protocols.

Researchers from Argonne National Laboratory also contributed to the work.

The Advanced Light Source is a DOE Office of Science user facility at Berkeley Lab.

The work was supported by the Department of Energy’s Office of Science and Office of Energy Efficiency and Renewable Energy. Additional funding was provided by the National Science Foundation.

Economics-Watching: Multivariate Core Trend Inflation

[from the Federal Reserve Bank of New York]

Overview

The Multivariate Core Trend (MCT) model measures inflation’s persistence in the seventeen core sectors of the personal consumption expenditures (PCE) price index.

Whether inflation is short-lived or persistent, concentrated in a few sectors or broad-based, is of deep relevance to policymakers. We estimate a dynamic factor model on monthly data for the major sectors of the personal consumption expenditures (PCE) price index to assess the extent of inflation persistence and its broadness. The results give a measure of trend inflation and shed light on whether inflation dynamics are dominated by a trend common across sectors or are sector-specific.

The New York Fed updates the MCT estimates and share sectoral insights at or shortly after 2 p.m. on the first Monday after the release of personal consumption expenditures (PCE) price index data from the Bureau of Economic Analysis. Data are available for download.

September 2023 Update

  • Multivariate Core Trend (MCT) inflation was 2.9 percent in September, a 0.3 percentage point increase from August (which was revised up from 2.5 percent). The 68 percent probability band is (2.4, 3.3).
  • Services ex-housing accounted for 0.54 percentage point (ppt) of the increase in the MCT estimate relative to its pre-pandemic average, while housing accounted for 0.50 ppt. Core goods had the smallest contribution, 0.03 ppt.
  • A large part of the persistence in housing and services ex-housing is explained by the sector-specific component of the trend.

Latest Release: 2:00 p.m. ET October 31, 2023

View the Multivariate Core Trend of PCE Inflation data here.

Frequently Asked Questions

What is the goal of the Multivariate Core Trend (MCT) analysis?

The New York Fed aims to provide a measure of inflation’s trend, or “persistence,” and identify where the persistence is coming from.

What data are reported?

The New York Fed’s interactive charts report monthly MCT estimates from 1960 to the present. The New York Fed also provides estimates of how much three broad sectors (core goods, core services excluding housing, and housing) are contributing to overall trend inflation over the same time span. The New York Fed further distinguishes whether the persistence owes to common or sector-specific components. Data are available for download.

What is the release schedule?

The New York Fed updates the estimate of inflation persistence and share sectoral insights following the release of PCE price data from the U.S. Bureau of Economic Analysis each month.

What is the modeling strategy?

A dynamic factor model with time-varying parameters is estimated on monthly data for the seventeen major sectors of the PCE price index. The model decomposes each sector’s inflation as the sum of a common trend, a sector-specific trend, a common transitory shock, and a sector-specific transitory shock. The trend in PCE inflation is constructed as the sum of the common and the sector-specific trends weighted by the expenditure shares.

The New York Fed uses data from all seventeen of the PCE’s sectors; however, in constructing the trend in PCE inflation, we exclude the volatile non-core sectors (that is, food and energy). The approach builds on Stock and Watson’s 2016 “Core Inflation and Trend Inflation.”

How does the MCT measure differ from the core personal consumption expenditures (PCE) inflation measure?

The core inflation measure simply removes the volatile food and energy components. The MCT model seeks to further remove the transitory variation from the core sectoral inflation rates. This has been key in understanding inflation developments in recent years because, during the pandemic, many core sectors (motor vehicles and furniture, for example) were hit by unusually large transitory shocks. An ideal measure of inflation persistence should filter those out.

PCE data are subject to revision by the Bureau of Economic Analysis (BEA). How does that affect MCT estimates?

BEA monthly revisions as well as other BEA periodic revisions to PCE price data do lead to reassessments of the estimated inflation persistence as measured by the MCT estimates. Larger revisions may lead to a more significant reassessment. A recent example of the latter case is described on Liberty Street Economics in “Inflation Persistence: Dissecting the News in January PCE Data.”

Historical estimates in our MCT data series back to 1960 are based on the latest vintage of data available and incorporate all prior revisions.

How does the MCT Inflation measure relate to other inflation measures?

The MCT model adds to the set of tools that aim at measuring the persistent component of PCE price inflation. Some approaches, such as the Cleveland Fed’s Median PCE and the Dallas Fed’s Trimmed Mean, rely on the cross-sectional distribution of price changes in each period. Other approaches, such as the New York Fed’s Underlying Inflation Gauge (UIG), rely on frequency-domain time series smoothing methods. The MCT approach shares some features with them, namely: exploiting the cross-sectional distribution of price changes and using time series smoothing techniques. But the MCT model also has some unique features that are relevant to inflation data. For example, it allows for outliers and for the noisiness of the data and for the relation with the common component to change over time.

How useful can MCT data be for policymakers?

The MCT model provides a timely measure of inflationary pressure and provides insights on how much price changes comove across sectors.

View the Multivariate Core Trend of PCE Inflation data here.