FRBSF Economic Letter: Can Monetary Policy Tame Rent Inflation?

[from the Federal Reserve Bank of San Francisco Economic Letter]

by Zheng Liu and Mollie Pepper

Rent inflation has surged since early 2021. Because the cost of housing is an important component of total U.S. consumer spending, high rent inflation has contributed to elevated levels of overall inflation. Evidence suggests that, as monetary policy tightening cools housing markets, it can also reduce rent inflation, although this tends to adjust relatively slowly. A policy tightening equivalent to a 1 percentage point increase in the federal funds rate could reduce rent inflation as much as 3.2 percentage points over 2½ years.

“We’ve had a time of red-hot housing market all over the country… Shelter inflation is going to remain high for some time. We’re looking for it to come down, but it’s not exactly clear when that will happen. Hope for the best, plan for the worst.”

Federal Reserve Chair Jerome Powell (2022)

The rapid run-up of shelter costs—both house prices and rents—during the recovery from the pandemic has raised questions about how inflation pressures might affect housing affordability. Since March 2022, the Federal Reserve has rapidly lifted its federal funds rate target from near zero to over 4%, and policymakers have signaled that they are open to keeping the monetary policy stance sufficiently restrictive to return inflation to the longer-run goal of 2% on average. The tightened financial conditions following those policy changes, especially the surge in mortgage interest rates, have helped cool house price growth. However, rent inflation remains elevated.

This Economic Letter examines the effectiveness of monetary policy tightening for reducing rent inflation. We estimate that, during the period from 1988 to 2019, a policy tightening equivalent to a 1 percentage point increase in the federal funds rate can reduce rent inflation—measured by 12-month percentage changes in the personal consumption expenditures (PCE) housing price index—by about 3.2 percentage points, but the full impact takes about 2½ years to materialize. Based on housing costs’ share in total PCE, this translates to a reduction in headline PCE inflation of about 0.5 percentage point over the same time horizon.

Rising housing costs

Following the COVID-19 recession, house prices and rents both surged in the United States. For example, the 12-month growth rate of Standard & Poor’s CoreLogic Case-Shiller Home Price Index accelerated from about 10% in December 2020 to over 20% in March 2022. After the Federal Reserve started raising the target for the federal funds rate in March, house price growth has slowed significantly, to about 9% in October 2022.

Rent inflation also accelerated during the pandemic period. Figure 1 shows that rent inflation—measured using 12-month changes in the PCE housing price index and including rents for tenant-occupied housing and imputed rents for owner-occupied housing—rose from a low point of about 2% in early 2021 to 7.7% by December 2022, the highest level since 1986. During the same period, rent inflation measured by 12-month changes in the shelter component of the consumer price index (CPI) experienced a similar increase. Thus, following the tightening of monetary policy, house price growth has slowed but rent inflation continues to rise.

Figure 1: PCE and CPI measures of rent inflation
Source: Bureau of Economic Analysis, Bureau of Labor Statistics, and Haver Analytics.
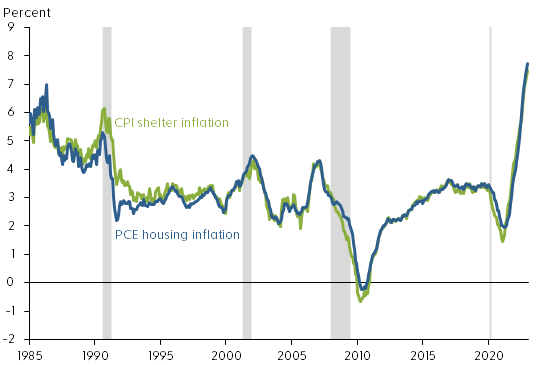
Note: Twelve-month percentage changes. Gray shading indicates NBER recession dates.

Economic theory suggests that some common forces such as changes in housing demand can drive both rents and house prices. For example, the expansion of remote work since the COVID-19 pandemic has increased demand for housing, raising both house prices and rents (Kmetz, Mondragon, and Wieland 2022). To the extent that the stream of current and future rents reflects the fundamental value of a house, house prices can be a leading indicator of future rent inflation (Lansing, Oliveira, and Shapiro 2022). Thus, monetary policy can affect both house prices and rents by cooling housing demand.

Housing demand responds to changes in financial conditions, such as increases in mortgage interest rates. However, theory suggests that house prices are more sensitive than rental prices to changes in financial conditions, because home purchases typically require longer-term mortgage financing. In addition, unlike rents, house prices can be partly driven by investor sentiments or beliefs, which explains the observed larger swings in house prices than in rents over business cycles (Dong et al. 2022). Long-term rental contracts can also contribute to slow adjustments in rent inflation.

Rent inflation is an important contributor to overall inflation because housing costs are an important component of total consumption expenditures. On average, housing expenditures represent about 15% of total PCE and 25% of the services component of PCE. In CPI, shelter costs represent an even larger share, accounting for about 30% of total consumption of all urban consumers and about 40% of core consumption expenditures excluding volatile food and energy components.

The contribution of rent inflation to overall PCE inflation has increased since early 2021. As Figure 2 shows, in the first quarter of 2021, rent inflation accounted for about 22% of the four-quarter change in the PCE services price index, excluding energy: 0.5 of the 2.3 percentage points increase in service prices was attributable to rent inflation. By the third quarter of 2022, the contribution of rent inflation had climbed to about one-third, or 1.5 of the 4.7 percentage point increase in service prices.

Figure 2: Rising contribution of rent inflation to services inflation
Source: Bureau of Economic Analysis, Haver Analytics, and authors’ calculations.
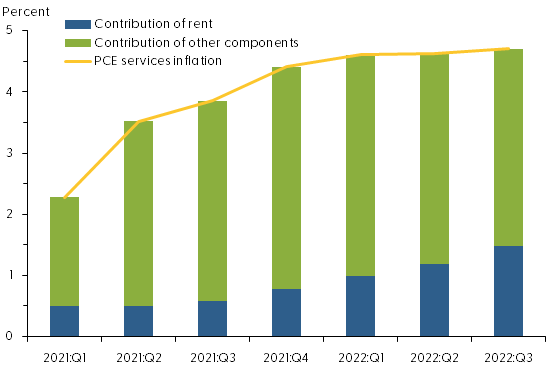
Note: Four-quarter changes in PCE services price index excluding energy.

Measuring policy effects

Given the rising contribution of rent inflation to overall inflation, it is important to assess the quantitative effects of monetary policy tightening on rent inflation.

For our analysis, we use a measure of monetary policy surprises constructed by Bauer and Swanson (2022). Their measure focuses on high-frequency changes in financial market indicators within a short period surrounding the Federal Open Market Committee (FOMC) policy announcements. If the public fully anticipates a policy change, then the financial market would not react to new policy announcements. However, if the market does react to an announcement, then the policy change must contain a surprise element. Thus, changes in financial market indicators, such as the price of Eurodollar futures, in a narrow window around an FOMC announcement can capture policy surprises. In practice, however, the data constructed this way are not complete surprises because they can be predicted by some macro and financial variables shortly before FOMC announcements. We follow the approach of Bauer and Swanson (2022) to purge the influences of those macro and financial variables from the measure of policy surprises. We use the resulting quarterly time series to measure monetary policy shocks, with a sample period from 1988 to 2019.

We then use a local projections model—a statistical tool proposed by Jordà (2005)—to project how rent inflation responds over time to a tightening of monetary policy equivalent to a 1 percentage point unanticipated increase in the federal funds rate in a given quarter. The model takes into account how monetary policy shocks interact with other macroeconomic variables, including lags of rent inflation, real GDP growth, and core PCE inflation.

In the final step, we compute the responses of rent inflation relative to its preshock level over a period up to 20 quarters after the initial increase in the federal funds rate.

Gradual impact of policy tightening on rent inflation

Figure 3 shows the response of rent inflation during the first 20 quarters after an unanticipated tightening of monetary policy (solid blue line). The shaded area shows the confidence band, indicating the statistical uncertainty in estimating the responses. Under the assumption that the model is correct, the shaded area contains the actual value of the rent inflation responses to the monetary policy shock roughly two-thirds of the time. The policy shock is normalized such that it is equivalent to a 1 percentage point unanticipated increase in the federal funds rate.

Figure 3: Response of rent inflation to monetary policy tightening
Source: Bureau of Economic Analysis, Bauer and Swanson (2022), and authors’ calculations.
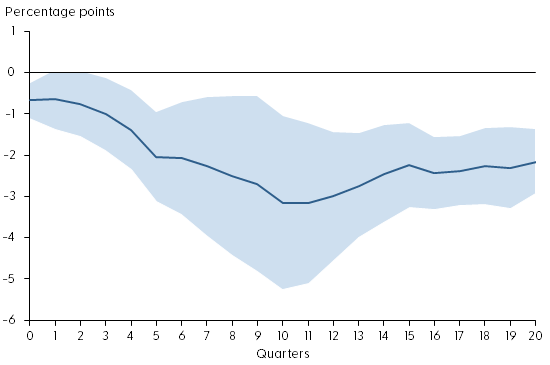
Note: Response of rent inflation to a monetary policy shock equivalent to a 1 percentage point surprise increase in the federal funds rate. Shaded region shows 68% confidence band around the estimate.

The figure shows that monetary policy tightening has significant and gradual effects on rent inflation. On impact, a 1 percentage point increase in the federal funds rate reduces rent inflation about 0.6 percentage point relative to its preshock level. Over time, rent inflation declines gradually, falling about 3.2 percentage points in the 10 quarters following the impact. The slow adjustment in rent inflation partly reflects the stickiness in nominal rents due to long-term rental contracts. Since housing expenditures account for about 15% of total PCE, this estimate translates to a reduction in headline PCE inflation of about 0.5 percentage point, stemming from the decline in rent inflation over a period of 2½ years.

The rent component of PCE is measured based on average rents, including those locked in long-term rental contracts, which are slow to adjust to changes in economic and financial conditions. Rents on new leases, however, are more flexible. For example, the 12-month growth in Zillow’s observed rent index, which measures changes in asking rents on new leases, has slowed significantly since March 2022 (see Figure 4). Asking rents are typically a leading indicator of future average rents. Thus, the slowdown in asking rent growth could portend lower future rent inflation.

Figure 4: Year-over-year observed rent growth starting to slow
Source: Zillow and Haver Analytics.
Note: Twelve-month percentage changes in Zillow’s observed rent index. Gray shading indicates NBER recession dates.

Conclusion

Rents are an important component of consumer expenditures. Recent surges in rent inflation have led to concerns that overall inflation might stay persistently high despite tightening of monetary policy. We present evidence that monetary policy tightening is effective for reducing rent inflation, although the full impact takes time to materialize. A policy tightening equivalent to a 1 percentage point increase in the federal funds rate can reduce rent inflation up to 3.2 percentage points over the course of 2½ years. This translates to a maximum reduction in headline PCE inflation of about 0.5 percentage point over the same time horizon. Although average rents are slow to respond to policy changes, growth of asking rents on new leases has started to slow following recent monetary policy tightening. Our finding suggests that this tightening will gradually bring rent inflation down over time, thereby helping to reduce overall inflation.

Zheng Liu — Vice President and Director of the Center for Pacific Basin Studies, Economic Research Department, Federal Reserve Bank of San Francisco

Mollie Pepper — Research Associate, Economic Research Department, Federal Reserve Bank of San Francisco

[Archived PDF]

Economics-Watching: FRBSF Economic Letter

[from the Federal Reserve Bank of San Francisco]

Are Inflation Expectations Well Anchored in Mexico?

by Remy Beauregard, Jens H.E. Christensen, Eric Fischer and Simon Zhu

Price inflation has increased sharply since early 2021 in many countries, including Mexico. If sustained, high inflation in Mexico could raise questions about the ability of its central bank to bring inflation down to its 3% inflation target. However, analyzing the difference between market prices of nominal and inflation-indexed government bonds suggests investors’ long-term inflation expectations in Mexico are close to the central bank’s inflation target and are projected to remain so in coming years.


Inflation has risen substantially in many countries, including Mexico, since early 2021, driven in part by unique factors related to the COVID-19 pandemic. Sustained elevated inflation could be particularly challenging for inflation-targeting central banks in emerging economies given their higher macroeconomic uncertainty and greater sensitivity to external shocks compared with more developed economies. To examine this risk for a representative emerging economy affected by COVID-era disruptions in much the same way as the United States, we focus on Mexico, which has conducted monetary policy since 2002 according to an inflation targeting regime with a target rate for consumer price inflation of 3% per year.

In this Economic Letter, we assess whether recent higher inflation is leading businesses and households in Mexico to expect inflation to remain high over the long run. Specifically, we focus on what rising market-based measures of inflation compensation may imply about bond investors’ outlook for inflation. The rise in inflation compensation since spring 2021 could reflect three factors: an increase in investorsinflation expectations, an uptick in the premium investors demand for assuming inflation risk, or changes in other risk and liquidity premiums. We explore the relative importance of each of these factors using a novel dynamic term structure model of nominal and inflation-adjusted yields described in Beauregard et al. (2021, henceforth BCFZ). Overall, our results for five-year inflation expectations five years from now suggest Mexican bond investors’ long-term inflation expectations have been little affected by the recent rise in inflation. Instead, the rise in inflation compensation reflects a notable uptick in the inflation risk premium to the high end of its historical range. This suggests that, despite inflation expectations being little changed on average, some investors are particularly concerned about the risk that inflation will remain above expected levels.

The recent rise in Mexican inflation

Figure 1 shows the year-over-year change in the Mexican consumer price index (CPI) measured both by the headline CPI (green line) and the more stable core CPI (blue line) that strips out volatile food and energy prices. Also shown with a horizontal gray line is the 3% inflation target of the nation’s central bank, the Bank of Mexico.

Figure 1: Mexican consumer price index inflation
Mexican consumer price index inflation
Source: Instituto Nacional de Estadística y Geografía.

We note that Mexican CPI inflation has averaged somewhat above the Bank of Mexico’s target since its adoption in 2002. More importantly, CPI inflation in Mexico appears to have become more volatile and somewhat higher over the past five years. Although previous research by De Pooter et al. (2014) found inflation expectations in Mexico to be well anchored, the significant global economic dislocations caused by the coronavirus pandemic and related inflationary pressures could impact inflation expectations of businesses and households.

To assess the persistence of the recent rise in Mexican inflation, we turn to financial market data, which reflect forward-looking expectations among a large and diverse group of investors and financial market participants. Specifically, we consider prices of conventional fixed-coupon bonds that pay a nominal interest rate and inflation-indexed bonds that pay a real interest rate because their cash flows are adjusted with the change in the CPI and therefore maintain their purchasing power. Both types of securities are issued and guaranteed by the Mexican government.

The difference between nominal and real yields for bonds of the same maturity is known as breakeven inflation (BEI). This represents a market-based measure of inflation compensation used to assess financial market participants’ inflation expectations. Figure 2 shows BEI rates at different maturities, meaning annual average rates of inflation compensation between now and maturity, from 1 to 10 years at the end of March 2021 (green line) and at the end of November 2022 (blue line). The slightly upward-sloping BEI curve of close to 3% in 2021 contrasts with the higher downward-sloping BEI curve in 2022.

Figure 2: BEI curves for 1-year to 10-year Mexican bond maturities
BEI curves for 1-year to 10-year Mexican bond maturities
Source: Authors’ calculations using bond prices from Bloomberg.

The increase for shorter maturities, the left end of the 2022 BEI curve, is closely tied to the current high level of inflation and suggests inflation may remain elevated for some time. In contrast, the increase at longer maturities, the right end of the 2022 BEI curve, suggests that investors’ longer-term inflation expectations may be drifting above the Bank of Mexico’s inflation target. To better understand the shape and sources of variation of the BEI curve we use a yield curve model.

A yield curve model of nominal and real yields

Market-based measures of inflation compensation such as BEI rates contain three components. First, they include the average CPI inflation rate expected by bond investors, which is the focus here. Second is an inflation risk premium to compensate investors for the uncertainty of future inflation. This premium is embedded in nominal yields that provide no inflation protection. Third is the difference in relative market liquidity between standard fixed-coupon and inflation-indexed bonds. As discussed in BCFZ, both of these types of Mexican bonds are less liquid than U.S. Treasuries, and their prices therefore contain a discount to compensate investors for their liquidity risk. Neither the inflation risk premium nor the liquidity premiums are directly observable and must therefore be estimated.

To adjust for these challenges, we first use the nominal and real yields model developed in BCFZ to identify liquidity premiums in standard fixed-coupon and inflation-indexed bond prices as a function of the time since issuance and the remaining time to maturity. The time since issuance serves as a proxy for declining liquidity as, over time, a larger fraction of bonds gets locked into buy-and-hold strategies. We refer to the observed BEI net of estimated liquidity premiums as the adjusted BEI. In a second step, we then separate adjusted BEI into components representing investorsinflation expectations using a formula based on the absence of bond market arbitrage opportunities and the residual inflation risk premium.

Results

To assess whether investorsinflation outlook has fundamentally changed, we follow De Pooter et al. (2014) and examine the five-year forward BEI rate that starts five years ahead, denoted 5yr5yr BEI. This is a horizon sufficiently long into the future that most transitory shocks to the economy can be expected to have vanished. Hence, the embedded inflation expectations are presumably less affected by current high inflation and pandemic-related transitory conditions and can therefore speak to the question about the anchoring of inflation expectations in Mexico.

Figure 3 shows the breakdown of 5yr5yr BEI into its various components according to our model. The dark blue line is the observed BEI, and the red line is the estimated adjusted BEI without liquidity risk premiums or other residual disturbances. The difference between these two measures of BEI—the yellow shaded area—represents the model’s estimate of the net liquidity premium or distortion of the observed BEI series due to risk premiums in both nominal and inflation-indexed bond prices. The adjusted BEI is entirely above the observed BEI, suggesting the liquidity risk distortions are systematically larger in the inflation-indexed bond prices, consistent with similar evidence from the U.S. Treasury market (Andreasen and Christensen 2016). Note that the net BEI liquidity premium widened around the financial turmoil in spring 2020 at the start of the pandemic and remains elevated.

Figure 3: Components of 5yr5yr breakeven inflation for Mexico
Components of 5yr5yr breakeven inflation for Mexico
Source: Survey forecasts from Consensus Economics and authors’ calculations using bond prices from Bloomberg.

The model also allows us to break down the adjusted BEI into an expected inflation component (light blue line) and the residual inflation risk premium (green line). Also shown is the Bank of Mexico’s 3% inflation target (gray horizontal line). For comparison, the figure also shows the 5yr5yr expected CPI inflation in Mexico reported semiannually in the Consensus Forecasts surveys (dark blue squares). We note that both observed and adjusted BEI have trended higher since the start of the pandemic in early 2020. Importantly, the breakdown indicates that long-term expected inflation in Mexico has remained stable, slightly above the 3% inflation target. As a result, the increase in BEI can be attributed to the inflation risk premium, which is at the high end of its historical range towards the end of our sample. Given the elevated levels of current inflation, this suggests some investors are concerned that inflation could remain elevated for longer than currently anticipated.

This raises the question of whether long-term inflation expectations in Mexico are likely to remain anchored near their current level going forward. To assess this risk, we simulate 10,000-factor paths over a three-year horizon using the estimated factors and factor dynamics as of November 2022—that is, the simulations are conditioned on the shapes of the nominal and real yield curves and investors’ embedded forward-looking expectations as of November 2022. These simulated factor paths are then converted into forecasts of 5yr5yr expected inflation. Figure 4 shows the median projection (solid green line) and the 5th and 95th percentile values (dashed green lines) for the simulated 5yr5yr expected inflation over a three-year horizon.

Figure 4: Three-year projections of 5yr5yr expected inflation, Mexico
Three-year projections of 5yr5yr expected inflation, Mexico
Source: Authors’ calculations.

Our model projections indicate that long-term inflation expectations are likely to deviate only modestly from their current level, consistent with the variation of the historical estimates back to 2009. Overall, our findings represent tangible evidence that long-term inflation expectations remain well-anchored in Mexico despite the recent rise in inflation.

Conclusion

Global inflation pressures in the aftermath of the pandemic have raised fears about a sustained increase in the level of inflation around the world, which could be particularly challenging for developing economies with monetary policy guided by an inflation target. In this Letter, to assess this risk for a major emerging economy with an established inflation target, we examine the variation in Mexico’s nominal and inflation-indexed bond prices, while accounting for their respective liquidity risk premiums. This allows us to estimate Mexican bond investors’ inflation expectations and associated risk premiums. The results reveal that the inflation risk premium has pushed up Mexican BEI rates in recent years, while investors’ long-term inflation expectations have remained stable near the Bank of Mexico’s inflation target despite the rise in inflation.

The policy path needed to keep inflation expectations anchored in a situation with highly elevated inflation may involve tradeoffs. The Bank of Mexico responded early and forcefully to inflation pressures starting in June 2021 and has indicated further tightening of the policy rate would likely be appropriate to bring inflation back down to target over the medium term. This could lower economic growth in Mexico in both 2022 and 2023. On the other hand, history shows that it may be difficult and costly to reverse extended departures from announced inflation targets. Thus, it will be important for central banks with inflation-targeting frameworks to monitor measures of long-term inflation expectations in the current situation.

Remy Beauregard
Economics Ph.D. student, University of California at Davis

Jens H.E. Christensen
Research Advisor, Economic Research Department, Federal Reserve Bank of San Francisco

Eric Fischer
Financial modeling and quantitative analytics principal, Markets Group, Federal Reserve Bank of New York

Simon Zhu
Economics Ph.D. student, University of Texas at Austin

References

Andreasen, Martin M. and Jens H.E. Christensen. 2016. “TIPS Liquidity and the Outlook for Inflation.” [PDFFRBSF Economic Letter 2016-35 (November 21).

Beauregard, Remy, Jens H.E. Christensen, Eric Fischer, and Simon Zhu. 2021. “Inflation Expectations and Risk Premia in Emerging Bond Markets: Evidence from Mexico.” [PDF] FRB San Francisco Working Paper 2021-08.

De Pooter, Michiel, Patrice Robitaille, Ian Walker, and Michael Zdinak. 2014. “Are Long-Term Inflation Expectations Well Anchored in Brazil, Chile, and Mexico?” [PDFInternational Journal of Central Banking 10(2), pp. 337–400.

[Archived PDF]

OFR Working Paper Finds Cash Biases Measurement of the Stock Return Correlations

[from the U.S. Office of Financial Research]

Today, the U.S. Office of Financial Research published a working paper, “Cash-Hedged Stock Returns” [archived PDF], and an accompanying blog (below), regarding firms’ cash holdings and the implications for asset prices and financial stability.

Cash holdings are important for financial stability because of their value in crises.  Corporate cash piles vary across companies and over time. Firms’ cash holdings typically earn low returns, and their cash returns are correlated across firms.  Thus, the asset pricing results are important for investors managing a portfolio’s risk and policymakers concerned about sources of vulnerability.

The working paper [archived PDF] shows how investors can hedge cash on firms’ balance sheets when making portfolio choices.  Cash generates variation in beta estimates, and the working paper decomposes stock betas into components that depend on the firm’s cash holding, return on cash, and cash-hedged return. Common asset pricing premia have large implicit cash positions, and portfolios of cash-hedged premia often have higher Sharpe ratios, used by investors to understand a return on investment, because of the correlation between firms’ cash returns. The paper shows the value of a dollar increased in 2020, and firms hold cash because they are riskier.

Read the working paper [archived PDF].

OFR Finds Large Cash Holdings Can Lead to Mismeasuring Risk

[from the OFR blog, by Sharon Ross]

Cash is necessary for companies’ operations. Firms use cash to make payments, finance investments, and manage risk. But holding cash comes at a cost: its low pecuniary return. Published today by the OFR, the working paper, “Cash-Hedged Stock Returns” [archived PDF], shows that the cash returns of publicly traded, non-financial firms are correlated. Since cash returns are a part of equity returns, investors that are using equity return correlations to measure risk can mismeasure risk.

We show the importance of cash for systemic risk by documenting the value of cash in crises, showing that firms hold cash in part due to risk management and studying how cash biases the measurement of the interconnectedness of stock returns. The consequences of cash are important for policymakers monitoring aggregate risks, and sources of market vulnerability and for investors making portfolio choices.

Cash holdings are important for financial stability because of their value in crises. Several papers document a “dash for cash” during the initial panicked stages of the coronavirus 2019 (COVID-19) pandemic when firms rushed to hold cash in their coffers. The dash for cash was driven by firms drawing down on lines of credit from banks, which in turn affected bank lending. The dash for cash highlighted the critical role of firms’ cash holdings and returns in understanding risk in the financial system.

We show the value of a dollar increased in 2020. Moreover, our results show that firms may hold cash because they are riskier, as opposed to firms with high cash shares being less risky due to their cash holdings. Our results are consistent with a precautionary savings motive for holding cash. In other words, firms hold cash for risk management, in part to weather bad times.

Cash is a growing share of public firmsassets. The value-weighted U.S. stock market held 22% of its assets in cash in December 2020 compared to 8% in the 1980s. An investor buying the market in 2020 ends up with an implicit cash position three times larger than in 1980. Individual firms vary in how much cash they hold. As cash holdings increase, it is important to understand how cash holdings affect returns, which in turn impacts who chooses to invest in the firms.

Cash returns are correlated across firms, and cash biases measurement of the interconnectedness of stock returns, making it a risk for financial stability. As a result, the asset pricing results are important both for investors managing portfolio risk and for policymakers concerned about interconnected returns.

We argue that the value of corporate cash is distinct, and we can separate the value of cash and the value of the firm’s primary business. We show how investors can explicitly account for the effect of corporate cash holdings when forming a portfolio. When an investor owns stock in a company with substantial cash, the investor has an implicit cash position managed by the company—something the investor might not intend. We argue that investors should account for the effect of corporate cash holdings in the portfolio decision to measure a portfolio’s risk. Firms’ cash management is not consistent across firms, and investors may want to manage their cash positions themselves. Policymakers should be aware of investors’ choices in cash because of investorsportfolio risk and the implications for aggregate risk.

We separate a company’s stock return into its cash and non-cash components, and we show that using the non-cash return gives a more informative correlation structure across stocks. In other words, if investors take out the correlated cash returns, the remaining return is less correlated, yielding portfolios that provide better diversification. We show how cash holdings and returns affect the returns of standard asset pricing strategies and asset pricing models like the capital asset pricing model (CAPM).

As cash holdings of public firms increase, it is important that policymakers understand how these increases impact stock returns for both individual firms and the aggregate market. Cash returns are correlated across firms, and cash biases the measurement of the interconnectedness of stock returns. This correlation is important both for investors who are managing a portfolio’s risk and policymakers concerned about sources of vulnerability stemming from interconnected returns.

Education and “Then and Now” Thinking: Zola’s Novel L’Argent

It is amazing to see how certain nineteenth century phenomena, such as Émile Zola’s novel L’Argent (“Money”), eerily echo with our own times. The novel has fundamentalist evangelical Christianity, international financial chicanery, anti-Semitism, the signs of full-blown “casino capitalism” convulsing the whole of society, global technical innovations. The historical background as all this unfolds is explosive and complex.

L’Argent is the eighteenth novel in the Rougon-Macquart series by Émile Zola. It was serialized in the periodical Gil Blas beginning in November 1890, before being published in novel form by Charpentier et Fasquelle in March 1891.

The novel focuses on the financial world of the Second French Empire as embodied in the Paris Bourse and exemplified by the fictional character of Aristide Saccard. Zola’s intent was to show the terrible effects of speculation and fraudulent company promotion, the culpable negligence of company directors, and the impotency of contemporary financial laws. (Think of Dodd-Frank in our time and how insiders have “noiselessly” dismantled it.)

The novel takes place in 1864-1869, beginning a few months after the death of Saccard’s second wife Renée (see La Curée). Saccard is bankrupt and an outcast among the Bourse financiers. Searching for a way to reestablish himself, Saccard is struck by plans developed by his upstairs neighbor, the engineer Georges Hamelin, who dreams of restoring Christianity to the Middle East through great public works: rail lines linking important cities, improved roads and transportation, renovated eastern Mediterranean ports, and fleets of modern ships to move goods around the world.

Saccard decides to institute a financial establishment to fund these projects. He is motivated primarily by the potential to make incredible amounts of money and reestablish himself on the Bourse. In addition, Saccard has an intense rivalry with his brother Eugène Rougon, a powerful Cabinet minister who refuses to help him after his bankruptcy and who is promoting a more liberal, less Catholic agenda for the Empire. Furthermore, Saccard, an intense anti-Semite, sees the enterprise as a strike against the Jewish bankers who dominate the Bourse. From the beginning, Saccard’s Banque Universelle (Universal Bank) stands on shaky ground.

In order to manipulate the price of the stock, Saccard and his colleagues in the syndicate, which he has set up to jumpstart the enterprise, buy their own stock and hide the proceeds of this illegal practice in a dummy account fronted by a straw man.

While Hamelin travels to Constantinople to lay the groundwork for their enterprise, the Banque Universelle goes from strength to strength. Stock prices soar, going from 500 francs a share to more than 3,000 francs in three years. Furthermore, Saccard buys several newspapers which serve to maintain the illusion of legitimacy, promote the Banque, excite the public, and attack Rougon.

The novel follows the fortunes of about 20 characters, cutting across all social strata, showing the effects of stock market speculation on rich and poor. The financial events of the novel are played against Saccard’s personal life. Hamelin lives with his sister Caroline, who, against her better judgment, invests in the Banque Universelle and later becomes Saccard’s mistress. Caroline learns that Saccard fathered a son, Victor, during his first days in Paris. She rescues Victor from his life of abject poverty, placing him in a charitable institution. But Victor is completely unredeemable, given over to greed, laziness, and thievery. After he attacks one of the women at the institution, he disappears into the streets, never to be seen again.

Eventually, the Banque Universelle cannot sustain itself. Saccard’s principal rival on the Bourse, the Jewish financier Gundermann, learns about Saccard’s financial trickery and attacks, losing stock upon the market, devaluing its price, and forcing Saccard to buy millions of shares to keep the price up. At the final collapse, the Banque holds one-fourth of its own shares worth 200 million francs. The fall of the Banque is felt across the entire financial world. Indeed, all of France feels the force of its collapse. The effects on the characters of L’Argent are disastrous, including complete ruin, suicide, and exile, though some of Saccard’s syndicate members escape and Gundermann experiences a windfall.

History itself is of course “bubbling along” and does not go away:

Because the financial world is closely linked with politics, L’Argent encompasses many historical events, including:

By the end of the novel, the stage is set for the Franco-Prussian War (1870–1871) and the fall of the Second Empire.

The twentieth century world and the twenty-first century one do resonate with Zola’s novel. That tells you, the student, that there are deep structures underlying endless changes.

The arrival of cars and planes, computers and lasers, internet and AI have not altered these substructures entirely and that is educational, since “then and now” thinking is part of a meta-intelligent (i.e., perspectival) education process.

Germany-Watching: Economics (U.S. Money Market Fund Reform)

from Deutsche Bundesbank Eurosystem’s Bundesbank Research Centre:

You Can’t Always Get What You Want (Where You Want It): Cross-Border Effects of the U.S. Money Market Fund Reform [PDF]

Authors: Daniel Fricke, Stefan Greppmair, Karol Paludkiewicz

Non-technical summary
Research Question

Money market funds (MMFs) are an important part of the growing segment of non-bank financial intermediaries. This paper contributes to this literature by analyzing the cross-border effects of the 2014 U.S. MMF reform, which was implemented several years prior to the EU Regulation. We study whether euro area MMFs received inflows as a consequence of the reform and investigate the (unintended) economic effects on the basis of the non-synchronized implementation dates of the regulatory changes in the U.S. and the EU.

Contribution

To the best of our knowledge, we are the first to examine the cross-border effects of the 2014 U.S. MMF reform. Prior work has shown that the reform led to a substantial decline of the institutional prime segment in the U.S. (MMFs that invest primarily in non-sovereign debt instruments). Moreover, these funds increased their risk-taking due to the increased competition and newly imposed liquidity restrictions left these funds more prone to large outflows (run risks).

Results

We document both positive and negative effects of the U.S. reform on institutional MMFs in the euro area. These funds, particularly those from the prime segment, experienced substantial inflows from foreign investors around the implementation of the U.S. reform and we show that these cross-border flows were largely motivated by the search for money-like instruments. While euro area MMFs reduced their risk-taking, the industry as a whole has become more concentrated and possibly more exposed to run risks. This risk materialized in the COVID-19 induced stress period during which these funds faced large outflows by foreign investors.

Read the full discussion paper [archived PDF].

China Monitor: How Immigration Is Shaping Chinese Society

(from MERICS China Monitor)

To the surprise of many, China has emerged as a destination country for immigration: As China’s population ages and its workforce shrinks, China needs more immigrants.

The background of immigrants to China is becoming more diverse. While the number of high-earning expatriates from developed countries has peaked, China is now also attracting more students than ever from all over the world, including many from lesser developed countries. Low-skilled labor and migration for marriage are also on the rise. The main areas that attract foreigners are the large urban centers along the coast (Guangzhou, Shanghai, Beijing) and borderland regions in the South, Northeast and Northwest, but smaller numbers are also making their way to smaller cities across China.

In the new MERICS China MonitorHow immigration is shaping Chinese society” [archived PDF], MERICS Director Frank N. Pieke and colleagues from other European universities and institutions discuss the most salient issues confronting the Chinese government and foreign residents themselves.

According to their analysis, for many foreigners China has become considerably less accommodating over the last ten years, particularly with regard to border control, public security, visa categories, and work and residence permits. China’s immigration policy is still driven by narrow concerns of regulation, institutionalization and control. It remains predicated on attracting high-quality professionals, researchers, entrepreneurs and investors. Long-term challenges like the emerging demographic transition, remain to be addressed.

The authors detect a worrying trend towards intolerance to ethnic and racial difference, fed by increasing nationalism and ethnic chauvinism. They argue that the Chinese government, civil society, foreign diplomatic missions, employers of foreigners and international organizations present in China should take a clear stance against racism and discrimination. China’s immigration policy needs to include the integration of foreigners into society and provide clear and predictable paths to acquiring permanent residence.

[Archived PDF]

Essay 95: Education and “Then and Now” Thinking

Ben Shalom Bernanke was Chairman of the Board of Governors of the Federal Reserve System from February 1, 2006, to January 31, 2014.

In many interviews in financial and economic periodicals, he blurts out the fact that his guide in the years surrounding the Great Recession of 2008, in his decisions by the advice of Walter Bagehot of the Economist of London whose main book is called Lombard Street [Project Gutenberg ebook] from 1873:

Lombard Street is known for its analysis of the Bank of England’s response to the Overend-Gurney crisis. Bagehot’s advice (sometimes referred to as “Bagehot’s dictum”) for the lender of last resort during a credit crunch may be summarized by  as follows:

  • Lend freely.
  • At a high rate of interest.
  • On good banking securities.

(Nonetheless, other economists emphasize that many of these ideas were spelled out earlier by Henry Thornton’s book The Paper Credit of Great Britain [archived PDF].)

Bagehot’s dictum has been summarized by as follows: “To avert panic, central banks should lend early and freely (i.e., without limit), to solvent firms, against good collateral, and at ‘high rates’.”

In Bagehot’s own words (Lombard Street [Project Gutenberg ebook], Chapter 7, paragraphs 57–58), lending by the central bank in order to stop a banking panic should follow two rules:

First. That these loans should only be made at a very high rate of interest. This will operate as a heavy fine on unreasonable timidity, and will prevent the greatest number of applications by persons who do not require it. The rate should be raised early in the panic, so that the fine may be paid early; that no one may borrow out of idle precaution without paying well for it; that the Banking reserve may be protected as far as possible.

Secondly. That at this rate these advances should be made on all good banking securities, and as largely as the public ask for them. The reason is plain. The object is to stay alarm, and nothing therefore should be done to cause alarm. But the way to cause alarm is to refuse some one who has good security to offer… No advances indeed need be made by which the Bank will ultimately lose. The amount of bad business in commercial countries is an infinitesimally small fraction of the whole business… The great majority, the majority to be protected, are the ‘sound’ people, the people who have good security to offer. If it is known that the Bank of England is freely advancing on what in ordinary times is reckoned a good security—on what is then commonly pledged and easily convertible—the alarm of the solvent merchants and bankers will be stayed. But if securities, really good and usually convertible, are refused by the Bank, the alarm will not abate, the other loans made will fail in obtaining their end, and the panic will become worse and worse.

We have to ask ourselves: how is it possible that advice from 1873 (i.e., Bagehot’s Lombard Street [Project Gutenberg ebook] crisis-management for that time) can be applicable in 2008?

Does this confirm the off-handed comment in This Time is Different by Ken Rogoff of Harvard that there must be true-but-opaque deep rhythms in history including financial history? Otherwise advice would be useless due to the passage of time and useful patterns would not be discernible.

In fact, Lawrence Summers at Treasury “deluged” Mexico and Latin America with loans to avert an earlier banking crisis following Bagehot’s advice. The logic is that investors must sense that Mexico, etc. will be bailed out at all costs. The idea is to avert a “downward spiral of confidence” by means of visible massive interventions.

Education should always ponder these “then and now” puzzles as part of a beneficial “argument without end.”