(Speech by Governor Lael Brainard, at the Presentation of the 2019 William F. Butler Award New York Association for Business Economics, New York, New York)
It is a pleasure to be here with you. It is an honor to join the 45 outstanding economic researchers and practitioners who are past recipients of the William F. Butler Award. I want to express my deep appreciation to the New York Association for Business Economics (NYABE) and NYABE President Julia Coronado.
I will offer my preliminary views on the Federal Reserve’s review of its monetary policy strategy, tools, and communications after first touching briefly on the economic outlook. These remarks represent my own views. The framework review is ongoing and will extend into 2020, and no conclusions have been reached at this time.1
Outlook and Policy
There are good reasons to expect the economy to grow at a pace modestly above potential over the next year or so, supported by strong consumers and a healthy job market, despite persistent uncertainty about trade conflict and disappointing foreign growth. Recent data provide some reassurance that consumer spending continues to expand at a healthy pace despite some slowing in retail sales. Consumer sentiment remains solid, and the employment picture is positive. Housing seems to have turned a corner and is poised for growth following several weak quarters.
Business investment remains downbeat, restrained by weak growth abroad and trade conflict. But there is little sign so far that the softness in trade, manufacturing, and business investment is affecting consumer spending, and the effect on services has been limited.
Employment remains strong. The employment-to-population ratio for prime-age adults has moved up to its pre-recession peak, and the three-month moving average of the unemployment rate is near a 50-year low.2 Monthly job gains remain above the pace needed to absorb new entrants into the labor force despite some slowing since last year. And initial claims for unemployment insurance—a useful real-time indicator historically—remain very low despite some modest increases.
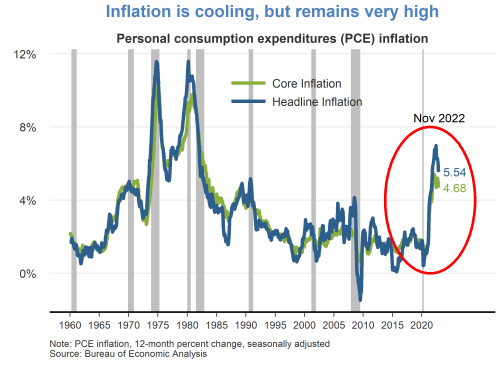
Data on inflation have come in about as I expected, on balance, in recent months. Inflation remains below the Federal Reserve’s 2 percent symmetric objective, which has been true for most of the past seven years. The price index for core personal consumption expenditures (PCE), which excludes food and energy prices and is a better indicator of future inflation than overall PCE prices, increased 1.7 percent over the 12 months through September.
Foreign growth remains subdued. While there are signs that the decline in euro-area manufacturing is stabilizing, the latest indicators on economic activity in China remain sluggish, and the news in Japan and in many emerging markets has been disappointing. Overall, it appears third-quarter foreign growth was weak, and the latest indicators point to little improvement in the fourth quarter.
More broadly, the balance of risks remains to the downside, although there has been some improvement in risk sentiment in recent weeks. The risk of a disorderly Brexit in the near future has declined significantly, and there is some hope that a U.S.–China trade truce could avert additional tariffs. While risks remain, financial market indicators suggest market participants see a diminution in such risks, and probabilities of recessions from models using market data have declined.
The baseline is for continued moderate expansion, a strong labor market, and inflation moving gradually to our symmetric 2 percent objective. The Federal Open Market Committee (FOMC) has taken significant action to provide insurance against the risks associated with trade conflict and weak foreign growth against a backdrop of muted inflation. Since July, the Committee has lowered the target range for the federal funds rate by ¾ percentage point, to the current range of 1½ to 1¾ percent. It will take some time for the full effect of this accommodation to work its way through economic activity, the labor market, and inflation. I will be watching the data carefully for signs of a material change to the outlook that could prompt me to reassess the appropriate path of policy.
Review
The Federal Reserve is conducting a review of our monetary policy strategy, tools, and communications to make sure we are well positioned to advance our statutory goals of maximum employment and price stability.3 Three key features of today’s new normal call for a reassessment of our monetary policy strategy: the neutral rate is very low here and abroad, trend inflation is running below target, and the sensitivity of price inflation to resource utilization is very low.4
First, trend inflation is below target.5 Underlying trend inflation appears to be running a few tenths below the Committee’s symmetric 2 percent objective, according to various statistical filters. This raises the risk that households and businesses could come to expect inflation to run persistently below our target and change their behavior in a way that reinforces that expectation. Indeed, with inflation having fallen short of 2 percent for most of the past seven years, inflation expectations may have declined, as suggested by some survey-based measures of long-run inflation expectations and by market-based measures of inflation compensation.
Second, the sensitivity of price inflation to resource utilization is very low. This is what economists mean when they say that the Phillips curve is flat. A flat Phillips curve has the important advantage of allowing employment to continue expanding for longer without generating inflationary pressures, thereby providing greater opportunities to more people. But it also makes it harder to achieve our 2 percent inflation objective on a sustained basis when inflation expectations have drifted below 2 percent.
Third, the long-run neutral rate of interest is very low, which means that we are likely to see more frequent and prolonged episodes when the federal funds rate is stuck at its effective lower bound (ELB).6 The neutral rate is the level of the federal funds rate that would keep the economy at full employment and 2 percent inflation if no tailwinds or headwinds were buffeting the economy. A variety of forces have likely contributed to a decline in the neutral rate, including demographic trends in many large economies, some slowing in the rate of productivity growth, and increases in the demand for safe assets. When looking at the Federal Reserve’s Summary of Economic Projections (SEP), it is striking that the Committee’s median projection of the longer-run federal funds rate has moved down from 4¼ percent to 2½ percent over the past seven years.7 A similar decline can be seen among private forecasts.8 This decline means the conventional policy buffer is likely to be only about half of the 4½ to 5 percentage points by which the FOMC has typically cut the federal funds rate to counter recessionary pressures over the past five decades.
This large loss of policy space will tend to increase the frequency or length of periods when the policy rate is pinned at the ELB, unemployment is elevated, and inflation is below target.9 In turn, the experience of frequent or extended periods of low inflation at the ELB risks eroding inflation expectations and further compressing the conventional policy space. The risk is a downward spiral where conventional policy space gets compressed even further, the ELB binds even more frequently, and it becomes increasingly difficult to move inflation expectations and inflation back up to target. While consumers and businesses might see very low inflation as having benefits at the individual level, at the aggregate level, inflation that is too low can make it very challenging for monetary policy to cut the short-term nominal interest rate sufficiently to cushion the economy effectively.10
The experience of Japan and of the euro area more recently suggests that this risk is real. Indeed, the fact that Japan and the euro area are struggling with this challenging triad further complicates our task, because there are important potential spillovers from monetary policy in other major economies to our own economy through exchange rate and yield curve channels.11
In light of the likelihood of more frequent episodes at the ELB, our monetary policy review should advance two goals. First, monetary policy should achieve average inflation outcomes of 2 percent over time to re-anchor inflation expectations at our target. Second, we need to expand policy space to buffer the economy from adverse developments at the ELB.
Achieving the Inflation Target
The apparent slippage in trend inflation below our target calls for some adjustments to our monetary policy strategy and communications. In this context and as part of our review, my colleagues and I have been discussing how to better anchor inflation expectations firmly at our objective. In particular, it may be helpful to specify that policy aims to achieve inflation outcomes that average 2 percent over time or over the cycle. Given the persistent shortfall of inflation from its target over recent years, this would imply supporting inflation a bit above 2 percent for some time to compensate for the period of underperformance.
One class of strategies that has been proposed to address this issue are formal “makeup” rules that seek to compensate for past inflation deviations from target. For instance, under price-level targeting, policy seeks to stabilize the price level around a constant growth path that is consistent with the inflation objective.12 Under average inflation targeting, policy seeks to return the average of inflation to the target over some specified period.13
To be successful, formal makeup strategies require that financial market participants, households, and businesses understand in advance and believe, to some degree, that policy will compensate for past misses. I suspect policymakers would find communications to be quite challenging with rigid forms of makeup strategies, because of what have been called time-inconsistency problems. For example, if inflation has been running well below—or above—target for a sustained period, when the time arrives to maintain inflation commensurately above—or below—2 percent for the same amount of time, economic conditions will typically be inconsistent with implementing the promised action. Analysis also suggests it could take many years with a formal average inflation targeting framework to return inflation to target following an ELB episode, although this depends on difficult-to-assess modeling assumptions and the particulars of the strategy.14
Thus, while formal average inflation targeting rules have some attractive properties in theory, they could be challenging to implement in practice. I prefer a more flexible approach that would anchor inflation expectations at 2 percent by achieving inflation outcomes that average 2 percent over time or over the cycle. For instance, following five years when the public has observed inflation outcomes in the range of 1½ to 2 percent, to avoid a decline in expectations, the Committee would target inflation outcomes in a range of, say, 2 to 2½ percent for the subsequent five years to achieve inflation outcomes of 2 percent on average overall. Flexible inflation averaging could bring some of the benefits of a formal average inflation targeting rule, but it would be simpler to communicate. By committing to achieve inflation outcomes that average 2 percent over time, the Committee would make clear in advance that it would accommodate rather than offset modest upward pressures to inflation in what could be described as a process of opportunistic reflation.15
Policy at the ELB
Second, the Committee is examining what monetary policy tools are likely to be effective in providing accommodation when the federal funds rate is at the ELB.16 In my view, the review should make clear that the Committee will actively employ its full toolkit so that the ELB is not an impediment to providing accommodation in the face of significant economic disruptions.
The importance and challenge of providing accommodation when the policy rate reaches the ELB should not be understated. In my own experience on the international response to the financial crisis, I was struck that the ELB proved to be a severe impediment to the provision of policy accommodation initially. Once conventional policy reached the ELB, the long delays necessitated for policymakers in nearly every jurisdiction to develop consensus and take action on unconventional policy sapped confidence, tightened financial conditions, and weakened recovery. Economic conditions in the euro area and elsewhere suffered for longer than necessary in part because of the lengthy process of building agreement to act decisively with a broader set of tools.
Despite delays and uncertainties, the balance of evidence suggests forward guidance and balance sheet policies were effective in easing financial conditions and providing accommodation following the global financial crisis.17 Accordingly, these tools should remain part of the Committee’s toolkit. However, the quantitative asset purchase policies that were used following the crisis proved to be lumpy both to initiate at the ELB and to calibrate over the course of the recovery. This lumpiness tends to create discontinuities in the provision of accommodation that can be costly. To the extent that the public is uncertain about the conditions that might trigger asset purchases and how long the purchases would be sustained, it undercuts the efficacy of the policy. Similarly, significant frictions associated with the normalization process can arise as the end of the asset purchase program approaches.
For these reasons, I have been interested in exploring approaches that expand the space for targeting interest rates in a more continuous fashion as an extension of our conventional policy space and in a way that reinforces forward guidance on the policy rate.18 In particular, there may be advantages to an approach that caps interest rates on Treasury securities at the short-to-medium range of the maturity spectrum—yield curve caps—in tandem with forward guidance that conditions liftoff from the ELB on employment and inflation outcomes.
To be specific, once the policy rate declines to the ELB, this approach would smoothly move to capping interest rates on the short-to-medium segment of the yield curve. The yield curve ceilings would transmit additional accommodation through the longer rates that are relevant for households and businesses in a manner that is more continuous than quantitative asset purchases. Moreover, if the horizon on the interest rate caps is set so as to reinforce forward guidance on the policy rate, doing so would augment the credibility of the yield curve caps and thereby diminish concerns about an open-ended balance sheet commitment. In addition, once the targeted outcome is achieved, and the caps expire, any securities that were acquired under the program would roll off organically, unwinding the policy smoothly and predictably. This is important, as it could potentially avoid some of the tantrum dynamics that have led to premature steepening at the long end of the yield curve in several jurisdictions.
Forward guidance on the policy rate will also be important in providing accommodation at the ELB. As we saw in the United States at the end of 2015 and again toward the second half of 2016, there tends to be strong pressure to “normalize” or lift off from the ELB preemptively based on historical relationships between inflation and employment. A better alternative would have been to delay liftoff until we had achieved our targets. Indeed, recent research suggests that forward guidance that commits to delay the liftoff from the ELB until full employment and 2 percent inflation have been achieved on a sustained basis—say over the course of a year—could improve performance on our dual-mandate goals.19
To reinforce this commitment, the forward guidance on the policy rate could be implemented in tandem with yield curve caps. For example, as the federal funds rate approaches the ELB, the Committee could commit to refrain from lifting off the ELB until full employment and 2 percent inflation are sustained for a year. Based on its assessment of how long this is likely take, the Committee would then commit to capping rates out the yield curve for a period consistent with the expected horizon of the outcome-based forward guidance. If the outlook shifts materially, the Committee could reassess how long it will take to get inflation back to 2 percent and adjust policy accordingly. One benefit of this approach is that the forward guidance and the yield curve ceilings would reinforce each other.
The combination of a commitment to condition liftoff on the sustained achievement of our employment and inflation objectives with yield curve caps targeted at the same horizon has the potential to work well in many circumstances. For very severe recessions, such as the financial crisis, such an approach could be augmented with purchases of 10-year Treasury securities to provide further accommodation at the long end of the yield curve. Presumably, the requisite scale of such purchases—when combined with medium-term yield curve ceilings and forward guidance on the policy rate—would be relatively smaller than if the longer-term asset purchases were used alone.
Monetary Policy and Financial Stability
Before closing, it is important to recall another important lesson of the financial crisis: The stability of the financial system is important to the achievement of the statutory goals of full employment and 2 percent inflation. In that regard, the changes in the macroeconomic environment that underlie our monetary policy review may have some implications for financial stability. Historically, when the Phillips curve was steeper, inflation tended to rise as the economy heated up, which prompted the Federal Reserve to raise interest rates. In turn, the interest rate increases would have the effect of tightening financial conditions more broadly. With a flat Phillips curve, inflation does not rise as much as resource utilization tightens, and interest rates are less likely to rise to restrictive levels. The resulting lower-for-longer interest rates, along with sustained high rates of resource utilization, are conducive to increasing risk appetite, which could prompt reach-for-yield behavior and incentives to take on additional debt, leading to financial imbalances as an expansion extends.
To the extent that the combination of a low neutral rate, a flat Phillips curve, and low underlying inflation may lead financial stability risks to become more tightly linked to the business cycle, it would be preferable to use tools other than tightening monetary policy to temper the financial cycle. In particular, active use of macroprudential tools such as the countercyclical buffer is vital to enable monetary policy to stay focused on achieving maximum employment and average inflation of 2 percent on a sustained basis.
Conclusion
The Federal Reserve’s commitment to adapt our monetary policy strategy to changing circumstances has enabled us to support the U.S. economy throughout the expansion, which is now in its 11th year. In light of the decline in the neutral rate, low trend inflation, and low sensitivity of inflation to slack as well as the consequent greater frequency of the policy rate being at the effective lower bound, this is an important time to review our monetary policy strategy, tools, and communications in order to improve the achievement of our statutory goals. I have offered some preliminary thoughts on how we could bolster inflation expectations by achieving inflation outcomes of 2 percent on average over time and, when policy is constrained by the ELB, how we could combine forward guidance on the policy rate with caps on the short-to-medium segment of the yield curve to buffer the economy against adverse developments.
- I am grateful to Ivan Vidangos of the Federal Reserve Board for assistance in preparing this text. These remarks represent my own views, which do not necessarily represent those of the Federal Reserve Board or the Federal Open Market Committee. (return to text)
- Claudia Sahm shows that a ½ percentage point increase in the three-month moving average of the unemployment rate relative to the previous year’s low is a good real-time recession indicator. See Claudia Sahm (2019), “Direct Stimulus Payments to Individuals” [archived PDF], Policy Proposal, The Hamilton Project at the Brookings Institution (Washington: THP, May 16). (return to text)
- Information about the review of monetary policy strategy, tools, and communications is available on the Board’s website. Also see Richard H. Clarida (2019), “The Federal Reserve’s Review of Its Monetary Policy Strategy, Tools, and Communication Practices” [archived PDF], speech delivered at the 2019 U.S. Monetary Policy Forum, sponsored by the Initiative on Global Markets at the University of Chicago Booth School of Business, New York, February 22; and Jerome H. Powell (2019), “Monetary Policy: Normalization and the Road Ahead” [archived PDF] speech delivered at the 2019 SIEPR Economic Summit, Stanford Institute of Economic Policy Research, Stanford, Calif., March 8. (return to text)
- See Lael Brainard (2016), “The ‘New Normal’ and What It Means for Monetary Policy” [archived PDF] speech delivered at the Chicago Council on Global Affairs, Chicago, September 12. (return to text)
- See Lael Brainard (2017), “Understanding the Disconnect between Employment and Inflation with a Low Neutral Rate” [archived PDF], speech delivered at the Economic Club of New York, September 5; and James H. Stock and Mark W. Watson (2007), “Why Has U.S. Inflation Become Harder to Forecast?” [archived PDF], Journal of Money, Credit and Banking, vol. 39 (s1, February), pp. 3–33. (return to text)
- See Lael Brainard (2015), “Normalizing Monetary Policy When the Neutral Interest Rate Is Low” [archived PDF] speech delivered at the Stanford Institute for Economic Policy Research, Stanford, Calif., December 1. (return to text)
- The projection materials for the Federal Reserve’s SEP are available on the Board’s website. (return to text)
- For example, the Blue Chip Consensus long-run projection for the three-month Treasury bill has declined from 3.6 percent in October 2012 to 2.4 percent in October 2019. See Wolters Kluwer (2019), Blue Chip Economic Indicators, vol. 44 (October 10); and Wolters Kluwer (2012), Blue Chip Economic Indicators, vol. 37 (October 10). (return to text)
- See Michael Kiley and John Roberts (2017), “Monetary Policy in a Low Interest Rate World” [archived PDF], Brookings Papers on Economic Activity, Spring, pp. 317–72; Eric Swanson (2018), “The Federal Reserve Is Not Very Constrained by the Lower Bound on Nominal Interest Rates” [archived PDF] NBER Working Paper Series 25123 (Cambridge, Mass.: National Bureau of Economic Research, October); and Hess Chung, Etienne Gagnon, Taisuke Nakata, Matthias Paustian, Bernd Schlusche, James Trevino, Diego Vilán, and Wei Zheng (2019), “Monetary Policy Options at the Effective Lower Bound: Assessing the Federal Reserve’s Current Policy Toolkit” [archived PDF], Finance and Economics Discussion Series 2019-003 (Washington: Board of Governors of the Federal Reserve System, January). (return to text)
- The important observation that some consumers and businesses see low inflation as having benefits emerged from listening to a diverse range of perspectives, including representatives of consumer, labor, business, community, and other groups during the Fed Listens events; for details, see this page. (return to text)
- See Lael Brainard (2017), “Cross-Border Spillovers of Balance Sheet Normalization” [archived PDF] speech delivered at the National Bureau of Economic Research’s Monetary Economics Summer Institute, Cambridge, Mass., July 13. (return to text)
- See, for example, James Bullard (2018), “A Primer on Price Level Targeting in the U.S.” [archived PDF], a presentation before the CFA Society of St. Louis, St. Louis, Mo., January 10. (return to text)
- See, for example, Lars Svensson (2019), “Monetary Policy Strategies for the Federal Reserve” [archived PDF] presented at “Conference on Monetary Policy Strategy, Tools and Communication Practices,” sponsored by the Federal Reserve Bank of Chicago, Chicago, June 5. (return to text)
- See Board of Governors of the Federal Reserve System (2019), “Minutes of the Federal Open Market Committee, September 17–18, 2019,” press release, October 9; and David Reifschneider and David Wilcox (2019), “Average Inflation Targeting Would Be a Weak Tool for the Fed to Deal with Recession and Chronic Low Inflation” [archived PDF] Policy Brief PB19-16 (Washington: Peterson Institute for International Economics, November). (return to text)
- See Janice C. Eberly, James H. Stock, and Jonathan H. Wright (2019), “The Federal Reserve’s Current Framework for Monetary Policy: A Review and Assessment” [archived PDF] paper presented at “Conference on Monetary Policy Strategy, Tools and Communication Practices,” sponsored by the Federal Reserve Bank of Chicago, Chicago, June 4. (return to text)
- See Board of Governors of the Federal Reserve System (2019), “Minutes of the Federal Open Market Committee, July 31–August 1, 2018” [archived PDF] press release, August 1; and Board of Governors (2019), “Minutes of the Federal Open Market Committee, October 29–30, 2019” [archived PDF] press release, October 30. (return to text)
- For details on purchases of securities by the Federal Reserve, see this page. For a discussion of forward guidance, see this page. See, for example, Simon Gilchrist and Egon Zakrajšek (2013), “The Impact of the Federal Reserve’s Large-Scale Asset Purchase Programs on Corporate Credit Risk,” Journal of Money, Credit and Banking, vol. 45, (s2, December), pp. 29–57; Simon Gilchrist, David López-Salido, and Egon Zakrajšek (2015), “Monetary Policy and Real Borrowing Costs at the Zero Lower Bound,” American Economic Journal: Macroeconomics, vol. 7 (January), pp. 77–109; Jing Cynthia Wu and Fan Dora Xia (2016), “Measuring the Macroeconomic Impact of Monetary Policy at the Zero Lower Bound,” Journal of Money, Credit and Banking, vol. 48 (March–April), pp. 253–91; and Stefania D’Amico and Iryna Kaminska (2019), “Credit Easing versus Quantitative Easing: Evidence from Corporate and Government Bond Purchase Programs” [archived PDF], Bank of England Staff Working Paper Series 825 (London: Bank of England, September). (return to text)
- See Board of Governors of the Federal Reserve System (2010), “Strategies for Targeting Interest Rates Out the Yield Curve,” memorandum to the Federal Open Market Committee, October 13, available at this page; and Ben Bernanke (2016), “What Tools Does The Fed Have Left? Part 2: Targeting Longer-Term Interest Rates” [archived PDF] blog post, Brookings Institution, March 24. (return to text)
- See Ben Bernanke, Michael Kiley, and John Roberts (2019), “Monetary Policy Strategies for a Low-Rate Environment” [archived PDF], Finance and Economics Discussion Series 2019-009 (Washington: Board of Governors of the Federal Reserve System) and Chung and others, “Monetary Policy Options at the Effective Lower Bound,” in note 9. (return to text)
