While economic activity in the United States has remained resilient, recent data show some softening in the labor market. Swings in net exports affected GDP in the first half of 2025, with imports surging in the first quarter followed by imports declining in the second quarter. Inflation remains above the Fed’s 2% goal, and a near-term rise from tariffs appears likely. Job gains in recent months have slowed. Downward revisions for recent job growth estimates have been large, but the magnitudes of these revisions are not out of line with historical values. Job growth estimates remain reliable despite data collection challenges. With the balance of risks surrounding the Fed’s dual mandate now shifting, market participants are projecting an easing of monetary policy in coming months.
by Hamza Abdelrahman, Luiz Edgard Oliveira and Aditi Poduri
Information the San Francisco Fed collects from businesses and community sources for the Beige Book provides timely insights into economic activity at both the national and regional levels. Two new indexes based on Beige Book questionnaire responses track business sentiment across the western United States. The indexes track data on economic activity and inflation, serving as early indicators of official data releases and helping improve near-term forecasting accuracy. The latest index readings suggest weakening economic growth and intensifying inflationary pressures over the coming months.
This Economic Letter examines the economic information collected through the SF Fed’s Beige Book questionnaire over the past 10-plus years. We analyze this information by constructing sentiment indexes from the qualitative data and comparing them with quantitative measures of national and regional economic activity and inflation. We introduce two indexes—the SF Fed Business Sentiment Index and the SF Fed Inflation Gauge Index—which track our contacts’ views and expectations for economic growth and inflation, respectively. We find that these new indexes serve as reliable early indicators of official data releases and help improve near-term forecast accuracy. The SF Fed Business Sentiment Index has generally exhibited patterns similar to other recent business and household sentiment indexes, and the SF Fed Inflation Gauge Index has shown a strong uptick in expected inflation. To regularly monitor changes in these two indexes, the San Francisco Fed has launched a new Twelfth District Business Sentiment data page.
Constructing regional sentiment indexes
The San Francisco Fed sends out a Beige Book questionnaire to business and community contacts across the District eight times a year to gather regional information. In addition to answering questions regarding their organizations, respondents share their views on regional and national topics, including economic activity and inflationary pressures.
In two questions, respondents indicate whether they see national output growth and inflation rates increasing, decreasing, or staying stable over the coming year using a standard five-tiered scale. We use these responses since 2014 to formulate two business sentiment indexes, one on economic activity and another on inflation. We assign standard weights to the five-tiered qualitative scale that are symmetrical around zero. For example, we ask if activity is expected to “decrease significantly” = –2, “decrease” = –1, “remain unchanged” = 0, “increase” = 1, or “increase significantly” = 2. We add up the weighted shares of responses for each tier within each index. We then normalize each resulting series by its own average and standard deviation for ease of comparison with traditional economic indicators.
Tracking business sentiment
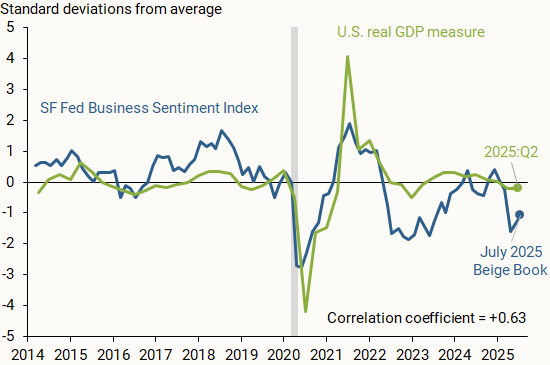
Figure 1 shows how the SF Fed Business Sentiment Index (blue line), compiled from responses to the question on national economic activity, compares with data on changes in national GDP (green line). We measure national output as the four-quarter change in inflation-adjusted, or real, GDP, normalized by its average and standard deviation so that it is centered around zero and, hence, more directly comparable to the SF Fed Business Sentiment Index. The vertical axis shows how many standard deviations away each observation is from its respective measure’s average from 2014 to mid-2025.
Figure 1 Economic growth versus business sentiment
The SF Fed Business Sentiment Index generally tracks the movements in national GDP over the past decade; a correlation coefficient of +0.63 on a scale of –1 to 1 indicates a moderately strong positive relationship between the two measures. A relatively recent exception started in 2022, when our index began showing a considerable decline relative to the national GDP measure. Respondents across the District were downbeat about economic growth and reported expectations of a sharp decline in consumer spending and overall household financial health following the depletion of pandemic-era savings (Abdelrahman and Oliveira 2023). A similar decline appeared in other measures of business and household sentiment. Nevertheless, overall economic growth continued at a solid pace. This decoupling between sentiment and hard data that began in 2022 was dubbed a “vibecession” (Daly 2024, Scanlon 2022).
Another possible reason for the divergence between national real GDP and our Business Sentiment Index is the influence of the regional economy. Although respondents are asked about their views of national GDP, their responses may be affected by regional outcomes. Thus, our index may also reflect a regional perspective from our business and community contacts.
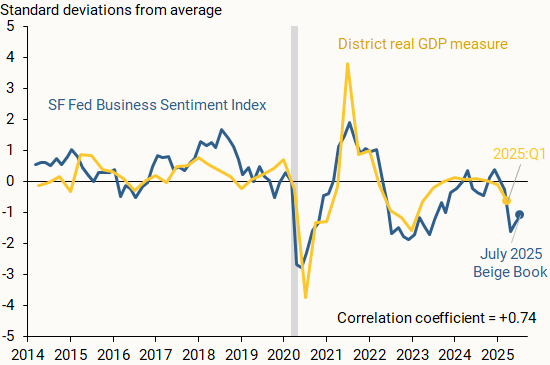
Figure 2 supports this rationale, showing the SF Fed Business Sentiment Index alongside a measure of regional output growth (gold line). We find that the measures closely track one another, including for 2022 and 2023, with a correlation coefficient of +0.74. We define District real GDP growth as the year-over-year percent change in the total output of the District’s nine states as reported by the Bureau of Economic Analysis (BEA). We normalize the series as described before.
Figure 2 Regional economic growth and business sentiment
Our findings indicate that the SF Fed Business Sentiment Index can serve as an accurate early indicator for national and regional output growth. Since the regional Beige Book questionnaire is collected twice each quarter, it provides particularly timely insights into economic activity during the current quarter. By contrast, the first GDP data release for any given quarter usually arrives a full month after that quarter has ended, and initial data releases for state-level output growth arrive with even more delay.
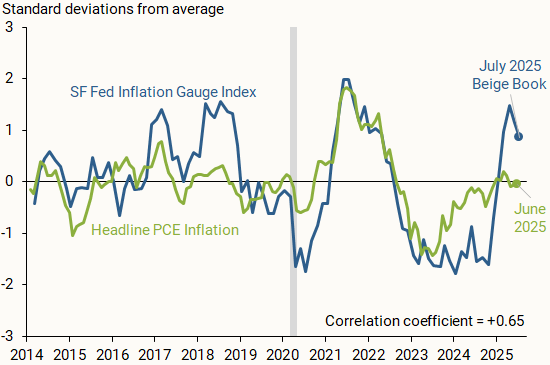
Our Beige Book questionnaire responses also provide insights into how business and community contacts in the District see national inflation evolving. Figure 3 compares the SF Fed Inflation Gauge Index (blue line) with monthly changes in the year-over-year headline personal consumption expenditures (PCE) inflation rate published by the BEA (green line). We normalize the inflation series and index as discussed earlier.
Figure 3 SF Fed Inflation Gauge Index versus realized inflation
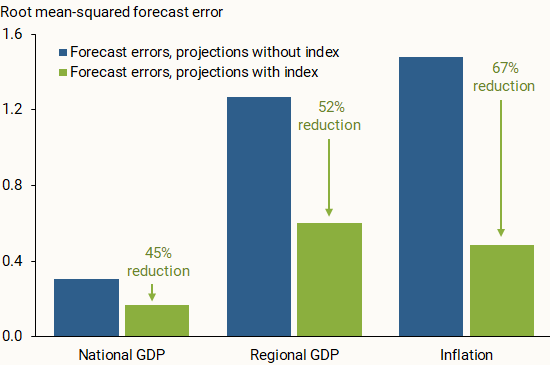
Beyond tracking data on national and regional economic conditions, we consider whether our two indexes can help improve one-year-ahead projections of output growth and overall inflation. We run linear regressions on a 2014–2022 data sample and estimate out-of-sample projections for the period starting in the first quarter of 2023. We run this analysis for the three economic measures—national GDP, regional GDP, and inflation—once with our index included on the right-hand side of the regression equation and once without the index. For this analysis, we use versions of the SF Fed Business Sentiment Index and the SF Fed Inflation Gauge Index that have been aggregated quarterly.
Figure 4 compares the out-of-sample projection accuracy of the two iterations. Across all economic measures, incorporating the SF Fed Business Sentiment Index or the SF Fed Inflation Gauge Index in the regression noticeably reduced the forecast errors for the out-of-sample period. This general result appears to hold when we project output growth and inflation one quarter ahead, in line with other studies that incorporate soft data from the Beige Book in short-term projections (Balke and Petersen 2002). The results are also consistent when using a local projections method from Jordà (2005) for one-year-ahead projections of output growth and shorter-term projections of inflation. This further supports the usefulness of our qualitative measures as early indicators of the future economic landscape over the short term.
Figure 4 Forecast errors with and without SF Fed sentiment indexes
Information collected from businesses and communities through the San Francisco Fed’s regional Beige Book questionnaire can provide valuable insights into the national and regional economies. Sentiment indexes described in this Letter use responses from Twelfth District Beige Book contacts to generally track economic activity and inflation. Our two indexes serve as reliable early indicators of official data, which could help improve near-term forecast accuracy. The SF Fed Business Sentiment Index remained negative for much of 2022 and 2023, possibly reflecting more subdued growth within the District relative to the United States. Meanwhile, the SF Fed Inflation Gauge Index spiked in recent months following adjustments to trade policy.
“We’ve had a time of red-hot housing market all over the country… Shelter inflation is going to remain high for some time. We’re looking for it to come down, but it’s not exactly clear when that will happen. Hope for the best, plan for the worst.”
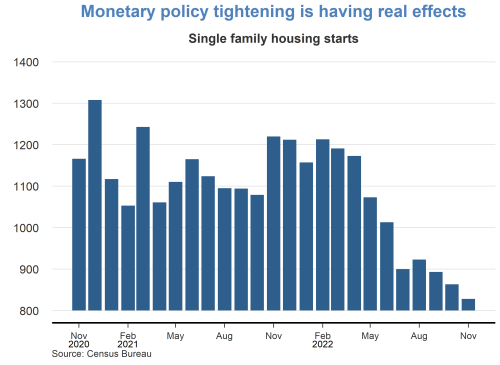
The rapid run-up of shelter costs—both house prices and rents—during the recovery from the pandemic has raised questions about how inflation pressures might affect housing affordability. Since March 2022, the Federal Reserve has rapidly lifted its federal funds rate target from near zero to over 4%, and policymakers have signaled that they are open to keeping the monetary policy stance sufficiently restrictive to return inflation to the longer-run goal of 2% on average. The tightened financial conditions following those policy changes, especially the surge in mortgageinterest rates, have helped cool house price growth. However, rentinflation remains elevated.
This Economic Letter examines the effectiveness of monetary policy tightening for reducing rentinflation. We estimate that, during the period from 1988 to 2019, a policy tightening equivalent to a 1 percentage point increase in the federal funds rate can reduce rentinflation—measured by 12-month percentage changes in the personal consumption expenditures (PCE)housing price index—by about 3.2 percentage points, but the full impact takes about 2½ years to materialize. Based on housing costs’ share in total PCE, this translates to a reduction in headline PCEinflation of about 0.5 percentage point over the same time horizon.
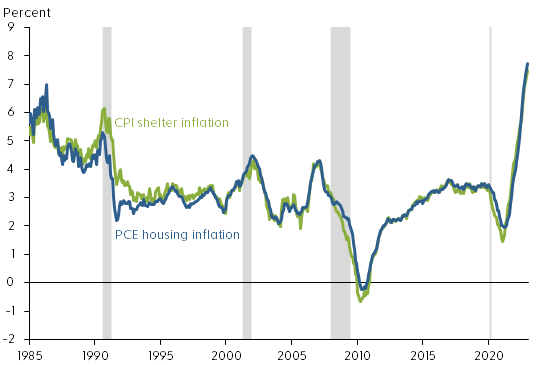
Rentinflation also accelerated during the pandemic period. Figure 1 shows that rentinflation—measured using 12-month changes in the PCEhousing price index and including rents for tenant-occupied housing and imputed rents for owner-occupied housing—rose from a low point of about 2% in early 2021 to 7.7% by December 2022, the highest level since 1986. During the same period, rentinflation measured by 12-month changes in the shelter component of the consumer price index (CPI) experienced a similar increase. Thus, following the tightening of monetary policy, house price growth has slowed but rentinflation continues to rise.
Economic theory suggests that some common forces such as changes in housing demand can drive both rents and house prices. For example, the expansion of remote work since the COVID-19 pandemic has increased demand for housing, raising both house prices and rents (Kmetz, Mondragon, and Wieland 2022). To the extent that the stream of current and future rents reflects the fundamental value of a house, house prices can be a leading indicator of future rentinflation (Lansing, Oliveira, and Shapiro 2022). Thus, monetary policy can affect both house prices and rents by cooling housing demand.
Housing demand responds to changes in financial conditions, such as increases in mortgageinterest rates. However, theory suggests that house prices are more sensitive than rental prices to changes in financial conditions, because home purchases typically require longer-term mortgage financing. In addition, unlike rents, house prices can be partly driven by investor sentiments or beliefs, which explains the observed larger swings in house prices than in rents over business cycles (Dong et al. 2022). Long-term rental contracts can also contribute to slow adjustments in rentinflation.
Rentinflation is an important contributor to overall inflation because housing costs are an important component of total consumption expenditures. On average, housing expenditures represent about 15% of total PCE and 25% of the services component of PCE. In CPI, shelter costs represent an even larger share, accounting for about 30% of total consumption of all urban consumers and about 40% of core consumption expenditures excluding volatile food and energy components.
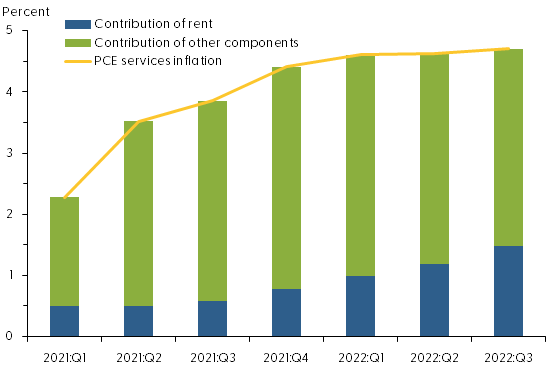
The contribution of rentinflation to overall PCEinflation has increased since early 2021. As Figure 2 shows, in the first quarter of 2021, rentinflation accounted for about 22% of the four-quarter change in the PCE services price index, excluding energy: 0.5 of the 2.3 percentage points increase in service prices was attributable to rentinflation. By the third quarter of 2022, the contribution of rentinflation had climbed to about one-third, or 1.5 of the 4.7 percentage point increase in service prices.
Figure 2: Rising contribution of rent inflation to services inflation
For our analysis, we use a measure of monetary policy surprises constructed by Bauer and Swanson (2022). Their measure focuses on high-frequency changes in financial marketindicators within a short period surrounding the Federal Open Market Committee (FOMC) policy announcements. If the public fully anticipates a policy change, then the financial market would not react to new policy announcements. However, if the market does react to an announcement, then the policy change must contain a surprise element. Thus, changes in financial marketindicators, such as the price of Eurodollar futures, in a narrow window around an FOMC announcement can capture policy surprises. In practice, however, the data constructed this way are not complete surprises because they can be predicted by some macro and financial variables shortly before FOMC announcements. We follow the approach of Bauer and Swanson (2022) to purge the influences of those macro and financial variables from the measure of policy surprises. We use the resulting quarterly time series to measure monetary policy shocks, with a sample period from 1988 to 2019.
We then use a local projections model—a statistical tool proposed by Jordà (2005)—to project how rentinflation responds over time to a tightening of monetary policy equivalent to a 1 percentage point unanticipated increase in the federal funds rate in a given quarter. The model takes into account how monetary policy shocks interact with other macroeconomic variables, including lags of rentinflation, real GDP growth, and core PCEinflation.
In the final step, we compute the responses of rentinflation relative to its preshock level over a period up to 20 quarters after the initial increase in the federal funds rate.
Gradual impact of policy tightening on rent inflation
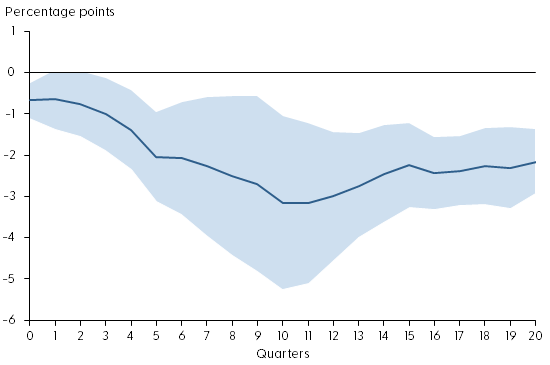
Figure 3 shows the response of rentinflation during the first 20 quarters after an unanticipated tightening of monetary policy (solid blue line). The shaded area shows the confidence band, indicating the statistical uncertainty in estimating the responses. Under the assumption that the model is correct, the shaded area contains the actual value of the rentinflation responses to the monetary policy shock roughly two-thirds of the time. The policy shock is normalized such that it is equivalent to a 1 percentage point unanticipated increase in the federal funds rate.
Figure 3: Response of rent inflation to monetary policy tightening
Source: Bureau of Economic Analysis, Bauer and Swanson (2022), and authors’ calculations. Note: Response of rentinflation to a monetary policy shock equivalent to a 1 percentage point surprise increase in the federal funds rate. Shaded region shows 68% confidence band around the estimate.
The figure shows that monetary policy tightening has significant and gradual effects on rentinflation. On impact, a 1 percentage point increase in the federal funds rate reduces rentinflation about 0.6 percentage point relative to its preshock level. Over time, rentinflation declines gradually, falling about 3.2 percentage points in the 10 quarters following the impact. The slow adjustment in rentinflation partly reflects the stickiness in nominal rents due to long-term rental contracts. Since housing expenditures account for about 15% of total PCE, this estimate translates to a reduction in headline PCEinflation of about 0.5 percentage point, stemming from the decline in rentinflation over a period of 2½ years.
The rent component of PCE is measured based on average rents, including those locked in long-term rental contracts, which are slow to adjust to changes in economic and financial conditions. Rents on new leases, however, are more flexible. For example, the 12-month growth in Zillow’s observed rent index, which measures changes in asking rents on new leases, has slowed significantly since March 2022 (see Figure 4). Asking rents are typically a leading indicator of future average rents. Thus, the slowdown in asking rent growth could portend lower future rentinflation.
Figure 4: Year-over-year observed rent growth starting to slow
Source: Zillow and Haver Analytics. Note: Twelve-month percentage changes in Zillow’s observed rent index. Gray shading indicates NBER recession dates.
Conclusion
Rents are an important component of consumer expenditures. Recent surges in rentinflation have led to concerns that overall inflation might stay persistently high despite tightening of monetary policy. We present evidence that monetary policy tightening is effective for reducing rentinflation, although the full impact takes time to materialize. A policy tightening equivalent to a 1 percentage point increase in the federal funds rate can reduce rentinflation up to 3.2 percentage points over the course of 2½ years. This translates to a maximum reduction in headline PCEinflation of about 0.5 percentage point over the same time horizon. Although average rents are slow to respond to policy changes, growth of asking rents on new leases has started to slow following recent monetary policy tightening. Our finding suggests that this tightening will gradually bring rentinflation down over time, thereby helping to reduce overall inflation.
In this Economic Letter, we assess whether recent higher inflation is leading businesses and households in Mexico to expect inflation to remain high over the long run. Specifically, we focus on what rising market-based measures of inflation compensation may imply about bondinvestors’ outlook for inflation. The rise in inflation compensation since spring 2021 could reflect three factors: an increase in investors’ inflation expectations, an uptick in the premium investors demand for assuming inflation risk, or changes in other risk and liquidity premiums. We explore the relative importance of each of these factors using a novel dynamic term structure model of nominal and inflation-adjusted yields described in Beauregard et al. (2021, henceforth BCFZ). Overall, our results for five-year inflation expectations five years from now suggest Mexicanbondinvestors’ long-term inflation expectations have been little affected by the recent rise in inflation. Instead, the rise in inflation compensation reflects a notable uptick in the inflation risk premium to the high end of its historical range. This suggests that, despite inflation expectations being little changed on average, some investors are particularly concerned about the risk that inflation will remain above expected levels.
The recent rise in Mexican inflation
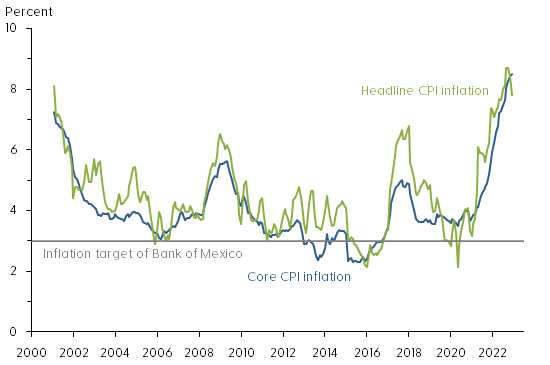
Figure 1 shows the year-over-year change in the Mexicanconsumer price index (CPI) measured both by the headline CPI (green line) and the more stable core CPI (blue line) that strips out volatile food and energy prices. Also shown with a horizontal gray line is the 3% inflation target of the nation’s central bank, the Bank of Mexico.
Figure 1: Mexican consumer price index inflation
Source: Instituto Nacional de Estadística y Geografía.
We note that MexicanCPIinflation has averaged somewhat above the Bank of Mexico’s target since its adoption in 2002. More importantly, CPIinflation in Mexico appears to have become more volatile and somewhat higher over the past five years. Although previous research by De Pooter et al. (2014) found inflation expectations in Mexico to be well anchored, the significant global economic dislocations caused by the coronavirus pandemic and related inflationary pressures could impact inflation expectations of businesses and households.
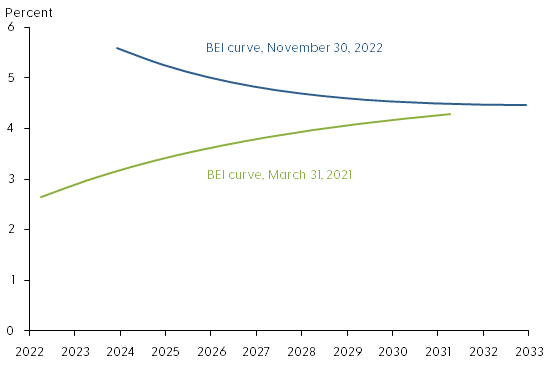
The difference between nominal and real yields for bonds of the same maturity is known as breakeven inflation (BEI). This represents a market-based measure of inflation compensation used to assess financial market participants’ inflation expectations. Figure 2 shows BEI rates at different maturities, meaning annual average rates of inflation compensation between now and maturity, from 1 to 10 years at the end of March 2021 (green line) and at the end of November 2022 (blue line). The slightly upward-sloping BEI curve of close to 3% in 2021 contrasts with the higher downward-sloping BEI curve in 2022.
Figure 2: BEI curves for 1-year to 10-year Mexican bond maturities
Source: Authors’ calculations using bond prices from Bloomberg.
The increase for shorter maturities, the left end of the 2022 BEI curve, is closely tied to the current high level of inflation and suggests inflation may remain elevated for some time. In contrast, the increase at longer maturities, the right end of the 2022 BEI curve, suggests that investors’ longer-term inflation expectations may be drifting above the Bank of Mexico’s inflation target. To better understand the shape and sources of variation of the BEI curve we use a yield curve model.
A yield curve model of nominal and real yields
Market-based measures of inflation compensation such as BEI rates contain three components. First, they include the average CPIinflation rate expected by bondinvestors, which is the focus here. Second is an inflation risk premium to compensate investors for the uncertainty of future inflation. This premium is embedded in nominal yields that provide no inflation protection. Third is the difference in relative market liquidity between standard fixed-coupon and inflation-indexed bonds. As discussed in BCFZ, both of these types of Mexicanbonds are less liquid than U.S. Treasuries, and their prices therefore contain a discount to compensate investors for their liquidity risk. Neither the inflation risk premium nor the liquidity premiums are directly observable and must therefore be estimated.
To adjust for these challenges, we first use the nominal and real yields model developed in BCFZ to identify liquidity premiums in standard fixed-coupon and inflation-indexed bond prices as a function of the time since issuance and the remaining time to maturity. The time since issuance serves as a proxy for declining liquidity as, over time, a larger fraction of bonds gets locked into buy-and-hold strategies. We refer to the observed BEI net of estimated liquidity premiums as the adjusted BEI. In a second step, we then separate adjusted BEI into components representing investors’ inflation expectations using a formula based on the absence of bond market arbitrage opportunities and the residual inflation risk premium.
Results
To assess whether investors’ inflation outlook has fundamentally changed, we follow De Pooter et al. (2014) and examine the five-year forward BEI rate that starts five years ahead, denoted 5yr5yr BEI. This is a horizon sufficiently long into the future that most transitory shocks to the economy can be expected to have vanished. Hence, the embedded inflation expectations are presumably less affected by current high inflation and pandemic-related transitory conditions and can therefore speak to the question about the anchoring of inflation expectations in Mexico.
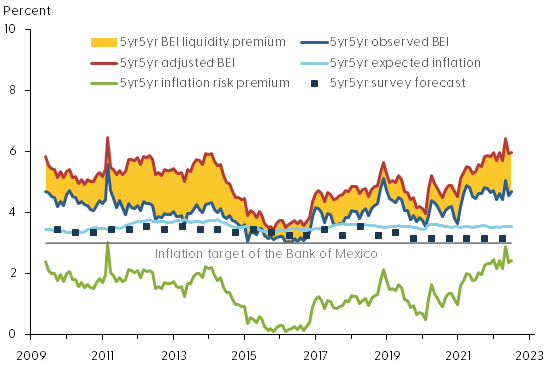
Figure 3 shows the breakdown of 5yr5yr BEI into its various components according to our model. The dark blue line is the observed BEI, and the red line is the estimated adjusted BEI without liquidity risk premiums or other residual disturbances. The difference between these two measures of BEI—the yellow shaded area—represents the model’s estimate of the net liquidity premium or distortion of the observed BEI series due to risk premiums in both nominal and inflation-indexed bond prices. The adjusted BEI is entirely above the observed BEI, suggesting the liquidity risk distortions are systematically larger in the inflation-indexed bond prices, consistent with similar evidence from the U.S. Treasury market (Andreasen and Christensen 2016). Note that the net BEI liquidity premium widened around the financial turmoil in spring 2020 at the start of the pandemic and remains elevated.
Figure 3: Components of 5yr5yr breakeven inflation for Mexico
Source: Survey forecasts from Consensus Economics and authors’ calculations using bond prices from Bloomberg.
The model also allows us to break down the adjusted BEI into an expected inflation component (light blue line) and the residual inflation risk premium (green line). Also shown is the Bank of Mexico’s 3% inflation target (gray horizontal line). For comparison, the figure also shows the 5yr5yr expected CPIinflation in Mexico reported semiannually in the Consensus Forecasts surveys (dark blue squares). We note that both observed and adjusted BEI have trended higher since the start of the pandemic in early 2020. Importantly, the breakdown indicates that long-term expected inflation in Mexico has remained stable, slightly above the 3% inflation target. As a result, the increase in BEI can be attributed to the inflation risk premium, which is at the high end of its historical range towards the end of our sample. Given the elevated levels of current inflation, this suggests some investors are concerned that inflation could remain elevated for longer than currently anticipated.
This raises the question of whether long-term inflation expectations in Mexico are likely to remain anchored near their current level going forward. To assess this risk, we simulate 10,000-factor paths over a three-year horizon using the estimated factors and factor dynamics as of November 2022—that is, the simulations are conditioned on the shapes of the nominal and real yield curves and investors’ embedded forward-looking expectations as of November 2022. These simulated factor paths are then converted into forecasts of 5yr5yr expected inflation. Figure 4 shows the median projection (solid green line) and the 5th and 95th percentile values (dashed green lines) for the simulated 5yr5yr expected inflation over a three-year horizon.
Figure 4: Three-year projections of 5yr5yr expected inflation, Mexico
Source: Authors’ calculations.
Our model projections indicate that long-term inflation expectations are likely to deviate only modestly from their current level, consistent with the variation of the historical estimates back to 2009. Overall, our findings represent tangible evidence that long-term inflation expectations remain well-anchored in Mexico despite the recent rise in inflation.
Conclusion
Global inflation pressures in the aftermath of the pandemic have raised fears about a sustained increase in the level of inflation around the world, which could be particularly challenging for developing economies with monetary policy guided by an inflation target. In this Letter, to assess this risk for a major emerging economy with an established inflation target, we examine the variation in Mexico’s nominal and inflation-indexed bond prices, while accounting for their respective liquidity risk premiums. This allows us to estimate Mexicanbond investors’ inflation expectations and associated risk premiums. The results reveal that the inflation risk premium has pushed up Mexican BEI rates in recent years, while investors’ long-term inflation expectations have remained stable near the Bank of Mexico’s inflation target despite the rise in inflation.
The policy path needed to keep inflation expectations anchored in a situation with highly elevated inflation may involve tradeoffs. The Bank of Mexico responded early and forcefully to inflation pressures starting in June 2021 and has indicated further tightening of the policy rate would likely be appropriate to bring inflation back down to target over the medium term. This could lower economic growth in Mexico in both 2022 and 2023. On the other hand, history shows that it may be difficult and costly to reverse extended departures from announced inflation targets. Thus, it will be important for central banks with inflation-targeting frameworks to monitor measures of long-term inflation expectations in the current situation.
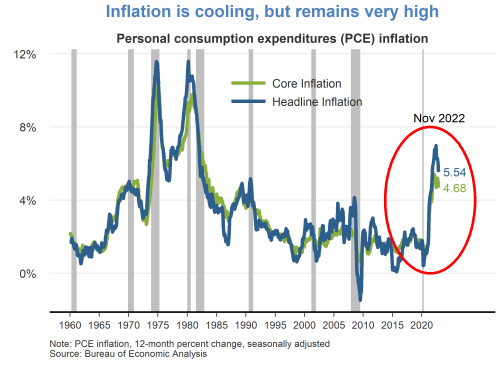
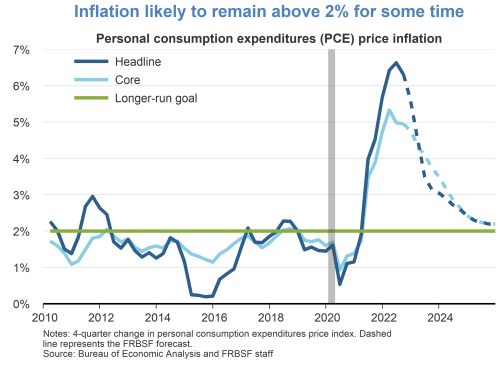
While continuing to cool over the last several months, 12-month inflation remains at historically high levels. The headline personal consumption expenditures (PCE) price index rose 5.5% in November 2022 from a year earlier. This marks a decline in inflation to a level last observed in October 2021, but still well above the Fed’s longer-run goal of 2%. A portion of the inflation moderation is attributable to recent declines in energy prices. Core PCE inflation, which removes food and energy prices, has shown less easing.
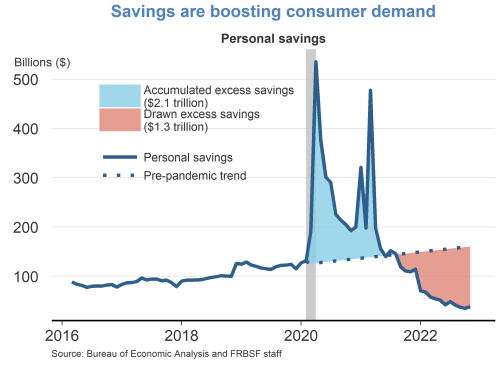
Owing to fiscal relief efforts and lower household spending over the course of the pandemic, consumers accumulated over $2 trillion dollars in excess savings, based on pre-pandemic trends. Since then, consumers have drawn down over half of this excess savings which has helped support recent growth in personal consumption expenditures. A considerable amount of accumulated savings remains for some consumers to support spending in 2023.
In the wake of the pandemic, consumer spending patterns shifted away from services towards goods. While there appears to be some normalization of spending behavior, this shift has generally persisted. Real goods spending remains significantly above its pre-pandemic trend, driven by strong demand for durables such as furniture, electronics, and recreational goods. Spending on services has shown a resurgence but remains below its pre-pandemic trend.
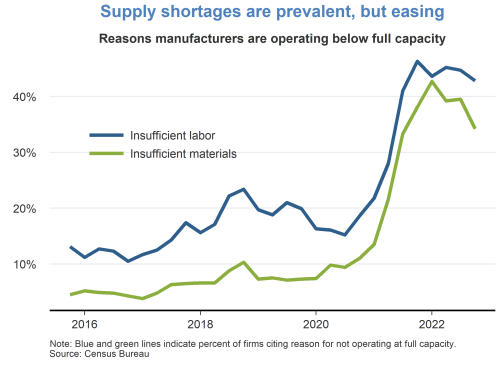
Supply chainbottlenecks for materials and labor remain a constraint on production, although there are some recent signs of easing. The fraction of manufacturers who reported operating below capacity due to insufficient materials peaked in late 2021 and has moderately declined over the past year. However, the fraction of manufacturers reporting insufficient labor has persisted at high levels.
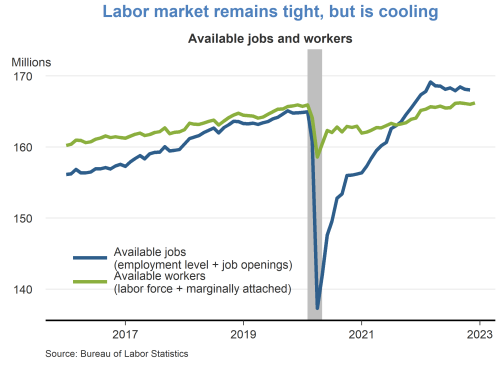
The labor market remains tight, despite some signs of cooling. The number of available jobs remains well above the number of available workers, although vacancy postings have been trending down in recent months. The tight labor market has put continued upward pressure on wages and labor market turnover.
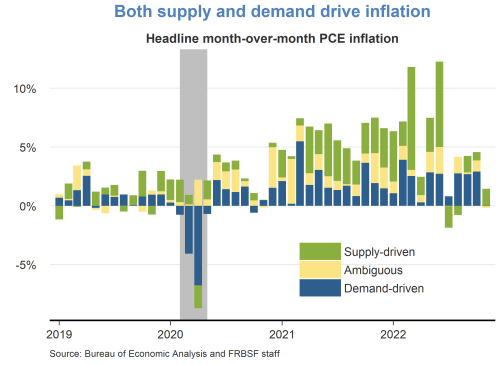
A decomposition of headline PCE inflation into supply– and demand-driven components shows that both supply and demand factors are responsible for the recent rise in inflation. The surge in inflation in early 2021 was mainly due to an increase in demand-driven factors. Subsequently, supply factors became more prevalent for the remainder of 2021. Supply-driven inflation has moderated significantly over recent months, while demand-driven inflation remains elevated.
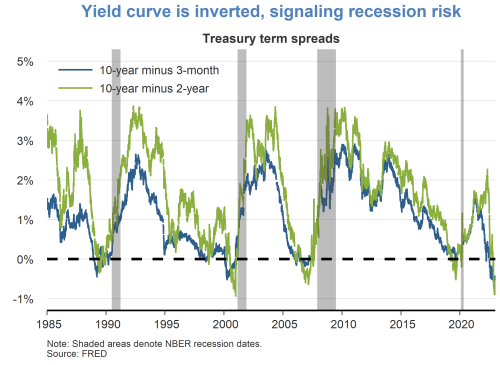
Although the labor market is currently very strong, financial markets are pointing to some downside risks. Namely, the difference between longer- and shorter-term interest rates has turned negative, which historically tends to occur immediately preceding recessions. It remains unclear whether lower longer-term yields are indicative of anticipated slower growth or lower inflation.
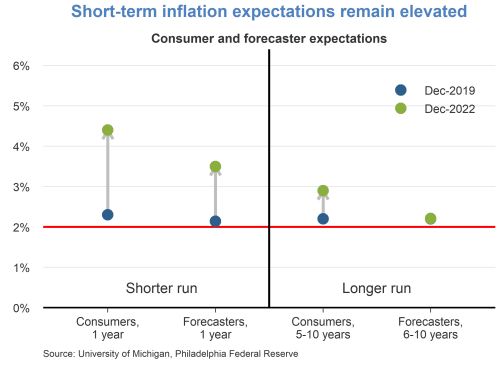
Short-term inflation expectations remain elevated relative to their pre-pandemic levels in December 2019. Consumers are expecting prices to rise 5% this year, while professional forecasters are expecting prices to rise 3.5%. Longer-term inflation expectations remain more subdued, indicating that both consumers and professionals believe inflation pressures will eventually dissipate.
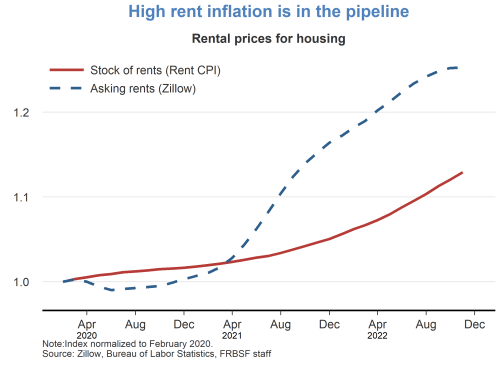
Rentinflation is expected to remain high over the next year. The prices for asking rents have grown quite substantially over the last two years. As new leases begin and existing leases are renewed, these higher asking rents will flow into the stock of rental units, putting upward pressure on rentinflation.
First Glance 12L provides a first look at banking and economic conditions within the 12th District. The report, “Interest Rate Shift Helped Housing but Hurt Bank Net Interest Margins,” [Archived PDF] notes that District banks’ average quarterly net interest margin slipped as lower interest rates and loan-to-asset ratios weighed on asset yields. The shifting asset mix contributed to margin compression but benefitted average liquidity and risk-based capital ratios. Districtwide loan and job growth cooled but remained above average, and lower interest rates boosted home prices, affordability, and homebuilding. In addition to supervisory hot topics, the report covers wildfire-related risks in California.