Federal Reserve policymakers need current information about economic conditions to make well-informed monetary policy decisions. But hard data, such as GDP and the unemployment rate, is released with a significant lag, making it difficult to get a precise, real-time read on the economy, especially during times of rapid change.
Hard data is based on precise quantitative measurements, such as sales figures or the specific prices firms are charging. By contrast, soft data is qualitative, focusing on trends, expectations, and sentiment around economic activity. And while hard data looks backward, soft data from the regional surveys can look forward—providing important information about expectations for the future and emerging trends.
The surveys are sent to over 300 business executives and managers at firms across industries during the first week of every month. While about two-thirds of participating firms have 100 or fewer employees, some have hundreds or thousands of workers.
Leaders at the firms fill out a short questionnaire asking if business activity has increased, decreased, or stayed the same compared to the prior month. The surveys ask about indicators such as prices–yielding insights into inflationary pressures–as well as employment, orders, and capital spending. Respondents answer questions about how they expect these indicators to change over the next six months, offering a forward-looking perspective on the economy’s trajectory.
From the responses, New York Fed researchers construct diffusion indexes by calculating the difference between the percentage of firms reporting increased activity and those reporting decreased activity. Positive values indicate that more firms say activity increased than decreased, suggesting activity expanded over the month. Higher positive values indicate stronger growth, while lower negative values indicate stronger declines.
The surveys include local businesses, like restaurants and car dealerships, as well as firms with national and global reach, such as software manufacturers and shipping enterprises. As a result, the economic indicators derived from the surveys are often early predictors of national economic patterns, frequently aligning with hard data released later.
In addition to providing data to track economic conditions, the regional surveys also provide a channel to hear directly from local business leaders. Every month, survey respondents are asked for their comments, offering the opportunity for businesses to share their thoughts, concerns, and experiences with the New York Fed. This helps researchers and policymakers understand how businesses are being affected by economic conditions.
The surveys act as one of the bridges between the New York Fed and the business community, ensuring the voices of regional businesses are considered in economic assessments and policy discussions as well as enhancing the ability of policymakers to make informed decisions to respond effectively to economic challenges.
Executives, owners, or managers of businesses in New York, northern New Jersey, or Fairfield County, Conn., interested in participating in the New York Fed’s monthly business surveys can find more information here. The next survey results will be released on Oct. 15 and 16.
Fourth District contacts reported a slight increase in overall business activity in recent weeks and expected activity to rise modestly in the months ahead. Consumer spending was flat, with retailers noting continued affordability concerns among consumers. Manufacturers also reported flat demand for goods, citing trade policy uncertainty as the main driver. Demand for professional and business services grew moderately, albeit at a slower pace than in the past three reporting periods. Contacts generally reported flat employment levels and modest wage pressures. Nonlabor cost pressures remained robust, and selling prices continued to grow modestly.
Following the inflationary surge from 2021 to 2023, which was touched off by supply chain constraints and shipping bottlenecks, we evaluate a new panel of own-firm price and unit cost growth expectations in the Atlanta Fed’s Survey of Business Uncertainty for signs that the anticipated impact from tariffs is broadening beyond directly affected firms. We find evidence for the potential of tariffs to touch off another bout of high inflation. First, firms that are directly exposed to tariffs have increased their year-ahead price growth expectations sharply (by 0.7 percentage points). Second, firms that are not directly exposed to tariffs but are operating in industries that are highly exposed to tariffs anticipate a moderately higher trajectory for year-ahead price growth (0.3 percentage points). Third, this broadening of overall price pressures—a key feature of the pandemic-era inflationary impulse—is only partially offset by lower price increases from tariff-exposed firms that are operating largely in industries not exposed to tariffs.
Key Findings
Firms, en masse, have increased their year-ahead price growth expectations since the end of 2024. This is especially true for firms directly exposed to tariffs.
We find evidence of a broadening out of the influence of tariffs beyond those directly exposed. Unexposed firms in exposed industries anticipate a moderately higher trajectory of year-ahead price growth.
The broadening of anticipated price growth is only partially offset by lower price growth expectations among tariff-exposed firms that are operating in largely unexposed industries.
Stone fruit production in Australia is forecast to decline in marketing year (MY) 2025/26, primarily due to the Bureau of Meteorology’s (BOM) projection of a wetter-than-average spring. If realized, these conditions are expected to negatively affect both yields and fruit quality. Cherry production is forecast to fall by ten percent, while peach and nectarine production is expected to drop by seven percent. Growing conditions to date have been favorable, with excellent winter chill hours supporting strong bud burst and production potential. However, the anticipated shift to wet spring weather is likely to undermine these early-season advantages. As a result, cherryexports are forecast to decrease by nine percent and peach and nectarineexports by seven percent. Imports, though starting from a low base, are projected to rise modestly in MY 2025/26.
Post projects exports of Chileancherries to grow significantly in the coming years, driven by strong international demand, particularly from China. Post estimates cherry production in marketing year (MY) 2024/25 to reach 730,000 metric tons (MT), a 6.7 increase over MY 2024/25. Chileancherryexports will increase by 7.2 percent reaching 670,000 MT. In MY 2024/25, Post estimates nectarine and peach production to total 205,000 MT, a 3.4 percent increase over MY 2024/25. Peach and nectarine exports will increase by 3.4 percent totaling 146,000 metric tons. This growth reflects the continued expansion of nectarine planting, which offsets the decline in fresh peach area planted.
China: Call for Domestic Comments on 30 National Food Safety Standards
On August 1, 2025, the Chinese government announced a public comment period for 30 national food safety standards, open until September 26, 2025, via the national standards management system. The standards have not yet been notified to the WTO. This report includes an unofficial translation of the announcement and the list of standards, and stakeholders are advised to review the regulations for potential market or regulatory impacts.
China: New CCP Regulation Expands Anti-Corruption and Frugality Measures
On May 18, 2025, the Chinese Communist Party and State Council issued a revised regulation on “Strict Economy and Opposing Waste by Party and Government Organs.” The regulation bans drinking alcohol at public receptions and events and discourages other forms of consumption that could be seen as extravagant. The FAS China offices are monitoring the potential impact on high-value U.S.agriculturalproducts.
China: Revised National Food Safety Standard for Paddy Rice Notified
On July 25, 2025, China notified a National Food Safety Standard for Paddy Rice to the WTO under G/TBT/N/CHN/2091. This national food safety standard includes mandatory requirements for quality, testing, inspection, packaging, and labeling of domestic and imported commercial paddy rice. This report provides an unofficial translation of the notified standard. Comments may be submitted to the China’s TBT National Notification and Enquiry Center at tbt@customs.gov.cn until August 24, 2025.
Japan’s fresh cherry production for the 2025/26 marketing year (MY) is projected to be 12,500 tons. This forecast is a result of production losses caused by high temperatures during the pollination period in the country’s largest cherry-producing region. While this represents an 8.7 percent increase compared to the previous year’s historically poor harvest, it is expected to be a low yield year with a 25 percent decrease from the average production year. Due to the poor domestic production, demand for U.S.cherries is expected to remain strong for the 2025/26 MY, continuing the trend from the previous year. For peach production in Japan, the absolute number of fruits is anticipated to be equivalent to the previous year; however, the total production volume by weight is forecasted to decrease by approximately 10 percent because of high temperatures and low rainfall during the critical fruit growing period.
Nicaragua’s peanutfarmers are expected to reduce harvested areas by at least five percent in marketing year (MY) 2025/26 in anticipation of lower prices due to increased Brazilianpeanut production. FASManagua expects farmers to be more rigorous in selecting production areas based on historical yields in MY 2025/26, excluding marginal lands with less fertile soil. Even with fluctuating marketprices and adjustments to planted areas, Nicaragua is expected to remain a stable peanut producer in the region, with exports of shelled peanuts exceeding 70,000 metric tons annually.
Ever since new tariffs were enacted in early 2025, a key policy question has been what is the extent to which businesses will pass tariff costs through to prices, and when? The effects of a tariff are rarely straightforward, given, among other things, competitive dynamics and the challenges of implementation, but the historically large and changing nature of these tariffs have created additional levels of uncertainty over the effects.
In uncertain times, anecdotal evidence from businesses can be especially insightful. We are learning how businesses are reacting to tariffs through the Richmond Fed’s business surveys as well as through hundreds of one-on-one conversations with Fifth District businesses since the start of 2025.
These conversations showcase that navigating tariffs is a complex and sometimes protracted process for firms, particularly when there is uncertainty. Firms describe several reasons they may not have experienced the full impact of proposed tariffs yet (even when goods and countries they deal with are subject to them), as well as reasons that even when they have incurred tariff-related cost increases, there can be a delayed impact on pricing decisions.
Reasons Firms May Not Have Incurred Tariffs Yet
Business contacts describe several strategies or circumstances that can delay or reduce the tariffs on inputs or other imported items. These include the following:
Delayed ordering. In response to announced tariffs, many firms ran down existing inventories or ran inventories lean in hopes that tariffs would become lower. For example, a national retailer said everyone was “delaying all we can delay in hopes we get more clarity on trade deals” and reported meeting with procurement teams multiple times per week to discuss ports and ship capacity, evolving tariffs, and inventories to keep goods flowing and prices as low as possible. One port said they have a crane waiting to be shipped but can’t do so now due to the tariffcost.
Cost-sharing.Vendor relationships are often long term, and many firms report partnering with suppliers and customers to share costs. When tariffs first rolled out, multiple firms (a beverage distributer, supply chainlogistics company) anticipated a “rule of thirds” where the cost was split evenly among the supplier, the importer, and the customer. A national retailer reported being large enough to force suppliers to bear much of the cost, though it varied by relationship and item. Interestingly, firms also reported that cost-sharing is not necessarily a permanent solution: A steeldistributer said that with the second round of tariffs announced in June, “The ‘kumbaya’ of cost-sharing was likely to come to an end.” Similarly, a fabricmanufacturer said that upon an announced trade deal with Vietnam that took tariffs from 10 percent to 20 percent, suppliers took a new stand on cost sharing: “Most vendors said you’re on your own” for the second 10 percent, and one even clawed back cost-sharing from the first round.
Transit time. It takes up to six weeks for container ships to arrive to the East Coast from China, so even if firms are ordering goods, there is a natural delay when the tariff is incurred. Shipping time in a world of rapidly changing tariff proposals add to uncertainty around tariffcosts.
Tariff implementation delays.Richmond FedeconomistMarina Azzimonti has found that a variety of tariff implementation delays help explain why actual tariffs as of May 2025 were much lower than expected. These factors include legacy exemptions and delays in customs system updates. Azzimonti also finds that a small percentage is explained by countries substituting away from high-tariff countries. For example, one national retailer we spoke with was in the process of dropping 10 percent of products sourced from China. Whether a company can change sourcing varies dramatically by type of firm and product.
As our monthly business surveys have found, many firms report deploying more than one strategy to delay tariffs. Notably, many of these delays are only temporary.
Reasons Tariffs May Have a Delayed Impact on Prices
Even when firms have incurred tariffs, they give several reasons why tariffs may not be immediately reflected in the prices they charge for their products. These include the following:
Waiting for tariff policy to clarify. Higher prices could reduce demand for goods and services and/or lead firms to lose market share, so many firms said they are hesitant to increase prices until they’re sure tariffs will remain in place. For example, a large national retailer said if tariffs are finalized at a sufficiently low level, they’ll absorb what they’ve incurred to date, but if high tariffs stick, they’ll have to raise prices. A steel fabricator for industrial equipment described being reluctant to raise prices on the 10 percent cost increases they’d seen thus far but would have to raise prices should the increases reach 12 to 13 percent. A grocery store chain was reluctant to raise prices and instead might reduce margins, which had recovered in recent years, to maintain their customer base. Some firms explicitly noted a strategy to both raise prices over time and pursue efficiency gains to cut costs and completely restore margins within a year or two.
Elasticity testing. Firms reported testing across goods whether consumers will accept price increases. A furnituremanufacturer said he’s seen competitors pass along just 5 percentage points of the tariffs at a time so it isn’t such a huge shock to customers, though in that sector, “We all end in the same place which is the customer bearing most of it.” A national retailer said most firms are doing a version of stair-stepping tariffs through, e.g., raising prices a small amount once or twice to see if consumer demand holds, and if so, trying again two months later. This retailer said prices were going up very marginally in early summer, would increase more in July and August, and would be up by 3 to 5 percent by the end of Q4 and into 2026. Another national retailer said they would start testing the extent to which demand falls with price increases, e.g., when the first items that were subject to tariffs—in this case back to school items—hit shelves in late July.
Blind margin. Some firms reported attempting to pass through cost in less noticeable ways. While any price increase to consumers will be captured in measures of aggregate inflation, the fact that price increases may occur on non-tariffedgoods might make it difficult to directly relate price increases to tariffs. An outdoor goodsretailer said, “Unless it’s a branded item where everyone knows the price, if something goes for $18, it can also go for $19.” A national retailer plans to print new shelf labels with updated pricing, which will be less noticeable for consumers compared to multiple new price stickers layered on top. This takes time (akin to a textbook “menu cost” in economics), so it will not be reflected in prices until July and August. A grocery store said their goal was to increase average prices across the store but focus on less visible prices.
Selling out of preexisting inventory: Many firms noted they still have productioninventory from before tariffs were announced, so they do not need to raise prices as long as they still sell these lower cost goods. A national retailer noted they have at least 25 weeks of inventory on hand for most importedproducts. A firm that produces grocery items said they will decide how much to raise prices as they get closer to selling tariff-affected products. Similarly, retailers order seasonal items quarters in advance. Many were receiving items for fall and winter when the new tariffs were going into effect in the spring. They paid the tariff then, but we won’t see the price increase until those items hit the shelves in the fall or winter. One retailer speculated that seasonal décor items will look the most like a one-time increase.
Pre-established prices. Many firms face infrequent pricing due to factors like annual contracts or pre-sales. For example, a dealer of farm equipment gets half its sales through incentivized pre-sales to lock in demand and smooth around crop cycles. They noted that while it would be difficult to retroactively ask those customers to pay for part of the tariff, they will pass tariffs directly through on spare parts. A steel fabricator for industrial equipment has a contract for steel through Q3, so they haven’t been impacted yet by price increases. However, they will face new costs once that contract expires.
In general, compared to small firms, large firms have more ability to negotiate with vendors, temporarily absorb costs, burn cash, wait for strategic opportunity, and test things out. This matters because large firms often lead pricing behavior among firms, so these strategic choices may influence the response of inflation to tariffs more generally. Even within firm size, one often hears that negotiations on price vary considerably by relationship and item.
Conclusion
A key question surrounding tariffs is whether any effects on inflation will resemble a short-lived price increase—as in the simplest textbook model of tariffs—or a more sustained increase to inflation that may warrant tighter Fedmonetary policy. When asked in May what will determine the answer, Fed ChairJerome Powellcited three factors [archived PDF]: 1) the size of the tariff effects; 2) how long it takes to work their way through to prices; and 3) whether inflation expectations remain anchored. The insights shared above suggest the process from proposed tariffs to the prices set by firms is far from instantaneous or clear-cut, particularly when tariff policy is changing.
Sensing from businesses suggests that the impact of tariffs on their price-setting [archived PDF] has been lagged, but it is starting to play out. Nonetheless, it remains highly uncertain how tariffs will impact consumerinflation. The discussion above makes clear that firms are nimble and innovative in the face of challenge, and they are concerned about losing customers in the current environment, particularly consumer-facing firms. We will continue to learn from our business contacts and share their insights.
Therefore, the behavior and the volatility of different asset classes have been impacted, altering global financial conditions. This scenario requires particular caution from emerging market economies amid heightened geopolitical tensions.
Regarding the domestic scenario, the set of indicators on economic activity has shown some moderation in growth, as expected, but the labor market is still showing strength.
The inflation outlook remains challenging in several dimensions. Copom assessed the international scenario, economic activity, aggregate demand, inflation expectations, and current inflation. Copom then discussed inflation projections and expectations before deliberating on the current decision and future communication.
The global environment is more adverse and uncertain. If, on the one hand, the approval of certain trade agreements, along with recent inflation and economic activity data from the U.S., could suggest a reduction in global uncertainty, on the other hand, the U.S. fiscal policy—and, particularly for Brazil, the U.S. trade policy—make the outlook more uncertain and adverse. The increase of tradetariffs by the U.S. to Brazil has significant sectoral impacts and still uncertain aggregate effects that depend on the unfolding of the next steps in the negotiations and the perception of risk inherent to this process. The Committee is closely monitoring the potential impacts on the real economy and financial assets. The prevailing assessment within the Committee is the increased global outlook uncertainty, and, therefore, Copom should maintain a cautious stance. As usual, the Committee will focus on the transmission mechanisms from the external environment to the domestic inflation dynamics and their impact on the outlook.
The domestic economic activity outlook has indicated a certain moderation in growth, while also presenting mixed data across sectors and indicators.
Overall, some moderation in growth is observed, supporting the scenario outlined by the Committee. This moderation, necessary for the widening of the output gap and the convergence of inflation to the target, is aligned with a contractionary monetary policy. Monthly sectoral surveys and more timely consumption data support a gradual slowdown in growth.
The credit market, which is more sensitive to financial conditions, has shown clearer moderation. A decline in non-earmarkedcredit granting and an increase in interest and delinquency rates have been observed. Moreover, regarding householdcredit, there has been an increase in the household debt–service ratio and a deepening of the negative credit flow—that is, households repaying more debt than taking on. It was emphasized during the discussion that some recent measures, such as private payroll-deducted loans, have had less impact than many market participants expected. Given the implementation agenda in this credit line, as well as the effects of introducing and removing taxes on other credit modalities, the Committee believes it should closely monitor upcoming credit data releases.
Fiscal policy has a short-term impact, mainly through stimulating aggregate demand, and a more structural dimension, which has the potential to affect perceptions of debt sustainability and influence the term premium in the yield curve. A fiscal policy that acts counter-cyclically and contributes to reducing the risk premium favors the convergence of inflation to the target. Copom reinforced its view that the slowdown in structural reform efforts and fiscal discipline, the increase in earmarkedcredit, and uncertainties over the public debt stabilization have the potential to raise the economy’s neutral interest rate, with deleterious impacts on the power of monetary policy and, consequently, on the cost of disinflation in terms of activity. The Committee remained firmly convinced that policies must be predictable, credible, and countercyclical. In particular, the Committee’s discussion once again highlighted the need for harmonious fiscal and monetary policy.
Inflation expectations, as measured by different instruments and obtained from various groups of agents, remained above the inflation target at all horizons, maintaining the adverse inflation outlook. For shorter-term horizons, following the release of the most recent data, there has been a decline in inflation expectations. For longer-term horizons, conversely, there has been no significant change in inflation expectations between Copom meetings, even though measures of breakeven inflation extracted from financial assets have declined. The Committee reaffirmed and renewed its commitment to re-anchoring expectations and to conducting a monetary policy that supports such a movement.
De-anchored inflation expectations is a factor of discomfort shared by all Committee members and must be tamed. Copom highlighted that environments with de-anchored expectations increase the disinflation cost in terms of activity. The scenario of inflation convergence to the target becomes more challenging with de-anchored expectations for longer horizons. When discussing this topic, the main conclusion obtained and shared by all members of Copom was that, in an environment of de-anchored expectations—as currently is the case—greater monetary restriction is required for a longer period than would be otherwise appropriate.
The inflation scenario has continued to show downside surprises in recent periods compared with analysts’ forecasts, but inflation has remained above the target Industrial goods inflation, which has already been showing weaker wholesale price pressures, continued to ease in the more recent period. Food prices also displayed slightly weaker-than-expected dynamics. Finally, servicesinflation, which has greater inertia, remains above the level required to meet the inflation target, in a context of a positive output gap. Beyond the changes in items, or even short-term oscillations, the core inflation measures have remained above the value consistent with the target achievement for months, corroborating the interpretation that inflation is pressured by demand and requires a contractionary monetary policy for a very prolonged period.
Copom then addressed the projections. In the reference scenario, the interest rate path is extracted from the Focus survey, and the exchange rate starts at USD/BRL 5.552 and evolves according to the purchasing power parity (PPP). The Committee assumes that oil prices follow approximately the futures market curve for the following six months and then start increasing 2% per year onwards. Moreover, the energy tariff flag is assumed to be “green” in December of the years 2025 and 2026.
In the reference scenario, four-quarter inflation projections for 2025 and for 2026 are 4.9% and 3.6%, respectively (Table 1). For the relevant horizon for monetary policy—2027 Q1—the inflation projection based on the reference scenario extracted from the Focus survey remained at 3.4%, above the inflation target.
Regarding the balance of risks, it was assessed that the scenario of greater uncertainty continues to present higher-than-usual upside and downside inflation risks to the inflation outlook. Copom assessed that, among the upside risks for the inflation outlook and inflation expectations, it should be emphasized (i) a more prolonged period of de-anchoring of inflation expectations; (ii) a stronger-than-expected resilience of servicesinflation due to a more positive output gap; and (iii) a conjunction of internal and external economic policies with a stronger-than-expected inflationary impact, for example, through a persistently more depreciatedcurrency. Among the downside risks, it should be noted (i) a greater-than-projected deceleration of domestic economic activity, impacting the inflation scenario; (ii) a steeper global slowdown stemming from the trade shock and the scenario of heightened uncertainty; and (iii) a reduction in commodity prices with disinflationary effects.
Prospectively, the Committee will continue monitoring the pace of economic activity, which is a fundamental driver of inflation, particularly services inflation; the exchange rate pass-through to inflation, after a process of increased exchange rate volatility; and inflation expectations, which remain de-anchored and are drivers of future inflation behavior. It was emphasized that inflationary vectors remain adverse, such as the economic activity resilience and labor market pressures, de-anchored inflation expectations, and high inflation projections. This scenario prescribes a significantly contractionary monetary policy for a very prolonged period to ensure the convergence of inflation to the target.
Copom then discussed the conduct of monetary policy, considering the set of projections evaluated, as well as the balance of risks for prospective inflation.
Following a swift and firm interest rate hike cycle, the Committee anticipates, as its monetary policy strategy, continuity of the interruption of the rate hiking cycle to observe the effects of the cycle already implemented. It was emphasized that, once the appropriate interest rate is determined, it should remain at a significantly contractionary level for a very prolonged period due to de-anchored expectations. The Committee emphasizes that it will remain vigilant, that future monetary policy steps can be adjusted and that it will not hesitate to proceed with the rate hiking cycle if appropriate.
The Committee has been closely monitoring with particular attention the announcements regarding the imposition by the U.S. of tradetariffs on Brazil, reinforcing its cautious stance in a scenario of heightened uncertainty. Moreover, it continues to monitor how the developments on the fiscal side impact monetary policy and financial assets. The current scenario continues to be marked by de-anchored inflation expectations, high inflation projections, resilience on economic activity, and labor market pressures. Ensuring the convergence of inflation to the target in an environment with de-anchored expectations requires a significantly contractionary monetary policy for a very prolonged period.
Copom decided to maintain the Selic rate at 15.00% p.a., and judges that this decision is consistent with the strategy for inflation convergence to a level around its target throughout the relevant horizon for monetary policy. Without compromising its fundamental objective of ensuring price stability, this decision also implies smoothing economic fluctuations and fostering full employment.
The current scenario, marked by heightened uncertainty, requires a cautious stance in monetary policy. If the expected scenario materializes, the Committee foresees a continuation of the interruption of the rate hiking cycle to examine its yet-to-be-seen cumulative impacts, and then evaluate whether the current interest rate level, assuming it stable for a very prolonged period, will be enough to ensure the convergence of inflation to the target. The Committee emphasizes that it will remain vigilant, that future monetary policy steps can be adjusted and that it will not hesitate to resume the rate hiking cycle if appropriate.
The following members of the Committee voted for this decision: Gabriel Muricca Galípolo (Governor), Ailton de Aquino Santos, Diogo Abry Guillen, Gilneu Francisco Astolfi Vivan, Izabela Moreira Correa, Nilton José Schneider David, Paulo Picchetti, Renato Dias de Brito Gomes, and Rodrigo Alves Teixeira.
Table 1
Inflation projections in the reference scenario Year-over-year IPCA change (%)
1 Unless explicitly stated otherwise, this update considers changes since the June Copom meeting (271st meeting).
2 It corresponds to the rounded value of the average exchange rate observed over the ten working days ending on the last day of the week prior to the Copom meeting, according to the procedure adopted since the 258th meeting.
Meeting information
Date: July 29-30 2025
Place: BCB Headquarters’ meeting rooms on the 8th floor (7/29 and 7/30 on the morning) and 20th floor (7/30 on the afternoon) – Brasilia – DF – Brazil
Starting and ending times:
July 29: 10:07 AM – 11:37 AM; 2:17 PM – 5:51 PM
July 30: 10:10 AM – 11:13 AM; 2:37PM – 6:34 PM
In attendance:
Members of the Copom
Gabriel Muricca Galípolo – Governor
Ailton de Aquino Santos
Diogo Abry Guillen
Gilneu Francisco Astolfi Vivan
Izabela Moreira Correa
Nilton José Schneider David
Paulo Picchetti
Renato Dias de Brito Gomes
Rodrigo Alves Teixeira
Department Heads in charge of technical presentations (attending on July 29 and on the morning of July 30)
André de Oliveira Amante
Open Market Operations Department
Euler Pereira Gonçalves de Mello
Research Department (also attending on the afternoon of 7/30)
Fábio Martins Trajano de Arruda
Department of Banking Operations and Payments System
Luís Guilherme Siciliano Pontes
International Reserves Department
Marcelo Antonio Thomaz de Aragão
Department of International Affairs
Ricardo Sabbadini
Department of Economics
Other participants (attending on July 29 and on the morning of July 30)
Alexandre de Carvalho
Office of Economic Advisor
André Maurício Trindade da Rocha
Head of the Financial System Monitoring Department
Angelo Jose Mont Alverne Duarte
Head of Office of the Deputy Governor for Licensing and Resolution (attending on the mornings of 7/29 and 7/30)
Arnaldo José Giongo Galvão
Press Office Advisor
Cristiano de Oliveira Lopes Cozer
General Counsel
Edson Broxado de França Teixeira
Head of Office of the Deputy Governor for Supervision
Eduardo José Araújo Lima
Head of Office of the Deputy Governor for Economic Policy
Fernando Alberto G. Sampaio C. Rocha
Head of the Department of Statistics
Isabela Ribeiro Damaso Maia
Head of the Sustainability and International Portfolio Investors Unit (attending on the mornings of 7/29 and 7/30)
Julio Cesar Costa Pinto
Head of Office of the Governor
Laura Soledad Cutruffo Comparini
Deputy Head of the Department of Economics
Leonardo Martins Nogueira
Head of Office of the Deputy Governor for Monetary Policy
Marcos Ribeiro de Castro
Deputy Head of the Research Department
Mardilson Fernandes Queiroz
Head of the Financial System Regulation Department
Olavo Lins Romano Pereira
Deputy Head of the Department of International Affairs
Renata Modesto Barreto
Deputy Head of the Department of Banking Operations and Payments System
Ricardo da Costa Martinelli
Deputy Head of the International Reserves Department
Ricardo Eyer Harris
Head of Office of the Deputy Governor for Regulation
Ricardo Franco Moura
Head of the Prudential and Foreign Exchange Regulation Department
Rogerio Antonio Lucca
Executive Secretary
Simone Miranda Burello
Advisor in the Office of the Deputy Governor for Monetary Policy
The twentieth centuryphilosopher, Ludwig Wittgenstein, tells us that his purpose is “to show the fly the way out of the fly-bottle.” Where the fly is, of course, ourselves. He then tells us, that perhaps the main reason is that one is unable to free oneself from bewitchment of the mind by “language games.”
In the song “Hotel California” by the Eagles, there’s the line, “‘We are all just prisoners here / Of our own device.’” In this context, “device” could be interpreted as a bad decision.
My Body and Myself
The Americanphilosophy professor, Samuel Todes, in his book Body and World, analyzes the human body, not as a meat-machine, but more like the silent partner of a person navigating their life. You can get a sense of this from Gabriel Marcel, when he writes:
Is my body my body, for instance, in the same sense in which I would say that my dog belongs to me? The question, let us first of all notice, of how the dog originally came into my hands is quite irrelevant here. Perhaps I found it wandering wretchedly about the streets, perhaps I bought it in a shop; I can say it is mine if nobody else puts in a claim for it—though this is still quite a negative condition of ownership. For the dog to be really, not merely nominally, mine there must exist between us a more positive set of relations. He must live, either with me, or as I, and I alone, have decided he shall live—lodged, perhaps, with a servant or a farmer; whether or not I look after him personally, I must assume the responsibility for his being looked after. And this implies something reciprocal in our relations. It is only it the dog recognizes me, obeys me, expresses by his behaviour towards me some feeling which I can interpret as affection or, at the very least, as wholesome fear, that he is really mine; I would become a laughingstock if I persisted in calling an animal that completely ignored me, that took no notice of me at all, my dog. And the mockery to which I would be exposed in such an instance is very significant. It is linked to a very positive idea of how things must be between my dog and me, before I can really say, ‘This dog is mine’.
We should recall, at this point, what we said in an earlier lecture about the body; the latter is not merely an instrument, it presents us with a kind of reality which is quite different from the reality of any sort of apparatus, in so far as it, my body, is also my way of being in the world.
When I try to make clear to myself the nature of my bond with my body, it appears to me chiefly as something of which I have the use (as one has the use of a piano, a saw, or a razor); but all these uses are extensions of the initial use, which is simply the use of the body. I have real priority to my body when it is a question of active use, but none whatever when it is a question of knowledge. The use is only possible on the basis of a certain felt community. But the community is indivisible; I cannot validly say ‘I and my body.’ The difficulty arises from the fact that I think of my relation with my body on the analogy of my relation with my instruments—whereas in fact the latter presupposes the former.
The connections between the trio of “me, myself and I” and the body is very elusive (as you may sense from your own introspection). This is another “argument without end.”
But, of course, it needed more than economic hardship, social discontent, and the frustration of political and social ambitions to make a revolution. To give cohesion to the discontents and aspirations of widely varying social classes there had to be some unifying body of ideas, a common vocabulary, of hope and protest, something, in short, like a common “revolutionarypsychology”. In the revolutions of our day, this ideological preparation has been the concern of political parties; but there were no such parties in eighteenth-centuryFrance.
“Labor marketindicators pointed to no growth in employment and a largely stable workweek,” said Jesus Cañas, Dallas Fed senior business economist. “Price pressures remained unchanged while wage growth eased slightly. Perceptions of broader business conditions continued to worsen in October, as pessimism notably increased.”
The revenueindex fell eight points to 0.7, with the near-zero reading suggesting little change in activity from September.
The employmentindex fell from 2.7 to 0.1, its lowest level in seven months.
The input pricesindex was flat at 37.3 and the selling pricesindex remained steady at 9.5.
The wages and benefitsindex fell two points to 17.0, approaching its average reading of 15.8.
The general business activity index dropped from -8.6 to -18.2, its lowest level since December of last year, while the company outlook index fell to -12.8, its lowest level in 16 months.
The sales index fell from -4.4 to -18.1, marking its sixth consecutive month in negative territory.
The employmentindex fell 13 points to -12.4 while the hours worked index fell from 0.6 to -12.1.
The general business activity index dropped from -10.2 to -23.0.
The Dallas Fed conducts the survey monthly to obtain a timely assessment of activity in the state’s service sector, which represents almost 70 percent of the state’s economy and employs about 9.5 million workers.
For this month’s survey, Texas business executives were asked supplemental questions on credit conditions. Results for these questions from the TexasManufacturing Outlook Survey, TexasService Sector Outlook Survey and TexasRetail Outlook Survey have been released together.
In this Economic Letter, we assess whether recent higher inflation is leading businesses and households in Mexico to expect inflation to remain high over the long run. Specifically, we focus on what rising market-based measures of inflation compensation may imply about bondinvestors’ outlook for inflation. The rise in inflation compensation since spring 2021 could reflect three factors: an increase in investors’ inflation expectations, an uptick in the premium investors demand for assuming inflation risk, or changes in other risk and liquidity premiums. We explore the relative importance of each of these factors using a novel dynamic term structure model of nominal and inflation-adjusted yields described in Beauregard et al. (2021, henceforth BCFZ). Overall, our results for five-year inflation expectations five years from now suggest Mexicanbondinvestors’ long-term inflation expectations have been little affected by the recent rise in inflation. Instead, the rise in inflation compensation reflects a notable uptick in the inflation risk premium to the high end of its historical range. This suggests that, despite inflation expectations being little changed on average, some investors are particularly concerned about the risk that inflation will remain above expected levels.
The recent rise in Mexican inflation
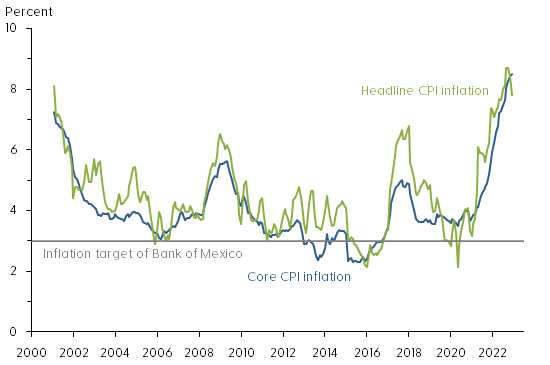
Figure 1 shows the year-over-year change in the Mexicanconsumer price index (CPI) measured both by the headline CPI (green line) and the more stable core CPI (blue line) that strips out volatile food and energy prices. Also shown with a horizontal gray line is the 3% inflation target of the nation’s central bank, the Bank of Mexico.
Figure 1: Mexican consumer price index inflation
Source: Instituto Nacional de Estadística y Geografía.
We note that MexicanCPIinflation has averaged somewhat above the Bank of Mexico’s target since its adoption in 2002. More importantly, CPIinflation in Mexico appears to have become more volatile and somewhat higher over the past five years. Although previous research by De Pooter et al. (2014) found inflation expectations in Mexico to be well anchored, the significant global economic dislocations caused by the coronavirus pandemic and related inflationary pressures could impact inflation expectations of businesses and households.
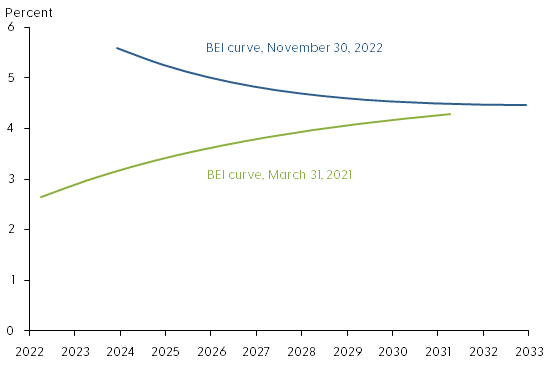
The difference between nominal and real yields for bonds of the same maturity is known as breakeven inflation (BEI). This represents a market-based measure of inflation compensation used to assess financial market participants’ inflation expectations. Figure 2 shows BEI rates at different maturities, meaning annual average rates of inflation compensation between now and maturity, from 1 to 10 years at the end of March 2021 (green line) and at the end of November 2022 (blue line). The slightly upward-sloping BEI curve of close to 3% in 2021 contrasts with the higher downward-sloping BEI curve in 2022.
Figure 2: BEI curves for 1-year to 10-year Mexican bond maturities
Source: Authors’ calculations using bond prices from Bloomberg.
The increase for shorter maturities, the left end of the 2022 BEI curve, is closely tied to the current high level of inflation and suggests inflation may remain elevated for some time. In contrast, the increase at longer maturities, the right end of the 2022 BEI curve, suggests that investors’ longer-term inflation expectations may be drifting above the Bank of Mexico’s inflation target. To better understand the shape and sources of variation of the BEI curve we use a yield curve model.
A yield curve model of nominal and real yields
Market-based measures of inflation compensation such as BEI rates contain three components. First, they include the average CPIinflation rate expected by bondinvestors, which is the focus here. Second is an inflation risk premium to compensate investors for the uncertainty of future inflation. This premium is embedded in nominal yields that provide no inflation protection. Third is the difference in relative market liquidity between standard fixed-coupon and inflation-indexed bonds. As discussed in BCFZ, both of these types of Mexicanbonds are less liquid than U.S. Treasuries, and their prices therefore contain a discount to compensate investors for their liquidity risk. Neither the inflation risk premium nor the liquidity premiums are directly observable and must therefore be estimated.
To adjust for these challenges, we first use the nominal and real yields model developed in BCFZ to identify liquidity premiums in standard fixed-coupon and inflation-indexed bond prices as a function of the time since issuance and the remaining time to maturity. The time since issuance serves as a proxy for declining liquidity as, over time, a larger fraction of bonds gets locked into buy-and-hold strategies. We refer to the observed BEI net of estimated liquidity premiums as the adjusted BEI. In a second step, we then separate adjusted BEI into components representing investors’ inflation expectations using a formula based on the absence of bond market arbitrage opportunities and the residual inflation risk premium.
Results
To assess whether investors’ inflation outlook has fundamentally changed, we follow De Pooter et al. (2014) and examine the five-year forward BEI rate that starts five years ahead, denoted 5yr5yr BEI. This is a horizon sufficiently long into the future that most transitory shocks to the economy can be expected to have vanished. Hence, the embedded inflation expectations are presumably less affected by current high inflation and pandemic-related transitory conditions and can therefore speak to the question about the anchoring of inflation expectations in Mexico.
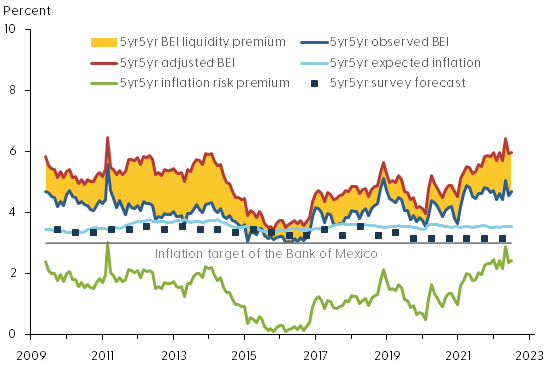
Figure 3 shows the breakdown of 5yr5yr BEI into its various components according to our model. The dark blue line is the observed BEI, and the red line is the estimated adjusted BEI without liquidity risk premiums or other residual disturbances. The difference between these two measures of BEI—the yellow shaded area—represents the model’s estimate of the net liquidity premium or distortion of the observed BEI series due to risk premiums in both nominal and inflation-indexed bond prices. The adjusted BEI is entirely above the observed BEI, suggesting the liquidity risk distortions are systematically larger in the inflation-indexed bond prices, consistent with similar evidence from the U.S. Treasury market (Andreasen and Christensen 2016). Note that the net BEI liquidity premium widened around the financial turmoil in spring 2020 at the start of the pandemic and remains elevated.
Figure 3: Components of 5yr5yr breakeven inflation for Mexico
Source: Survey forecasts from Consensus Economics and authors’ calculations using bond prices from Bloomberg.
The model also allows us to break down the adjusted BEI into an expected inflation component (light blue line) and the residual inflation risk premium (green line). Also shown is the Bank of Mexico’s 3% inflation target (gray horizontal line). For comparison, the figure also shows the 5yr5yr expected CPIinflation in Mexico reported semiannually in the Consensus Forecasts surveys (dark blue squares). We note that both observed and adjusted BEI have trended higher since the start of the pandemic in early 2020. Importantly, the breakdown indicates that long-term expected inflation in Mexico has remained stable, slightly above the 3% inflation target. As a result, the increase in BEI can be attributed to the inflation risk premium, which is at the high end of its historical range towards the end of our sample. Given the elevated levels of current inflation, this suggests some investors are concerned that inflation could remain elevated for longer than currently anticipated.
This raises the question of whether long-term inflation expectations in Mexico are likely to remain anchored near their current level going forward. To assess this risk, we simulate 10,000-factor paths over a three-year horizon using the estimated factors and factor dynamics as of November 2022—that is, the simulations are conditioned on the shapes of the nominal and real yield curves and investors’ embedded forward-looking expectations as of November 2022. These simulated factor paths are then converted into forecasts of 5yr5yr expected inflation. Figure 4 shows the median projection (solid green line) and the 5th and 95th percentile values (dashed green lines) for the simulated 5yr5yr expected inflation over a three-year horizon.
Figure 4: Three-year projections of 5yr5yr expected inflation, Mexico
Source: Authors’ calculations.
Our model projections indicate that long-term inflation expectations are likely to deviate only modestly from their current level, consistent with the variation of the historical estimates back to 2009. Overall, our findings represent tangible evidence that long-term inflation expectations remain well-anchored in Mexico despite the recent rise in inflation.
Conclusion
Global inflation pressures in the aftermath of the pandemic have raised fears about a sustained increase in the level of inflation around the world, which could be particularly challenging for developing economies with monetary policy guided by an inflation target. In this Letter, to assess this risk for a major emerging economy with an established inflation target, we examine the variation in Mexico’s nominal and inflation-indexed bond prices, while accounting for their respective liquidity risk premiums. This allows us to estimate Mexicanbond investors’ inflation expectations and associated risk premiums. The results reveal that the inflation risk premium has pushed up Mexican BEI rates in recent years, while investors’ long-term inflation expectations have remained stable near the Bank of Mexico’s inflation target despite the rise in inflation.
The policy path needed to keep inflation expectations anchored in a situation with highly elevated inflation may involve tradeoffs. The Bank of Mexico responded early and forcefully to inflation pressures starting in June 2021 and has indicated further tightening of the policy rate would likely be appropriate to bring inflation back down to target over the medium term. This could lower economic growth in Mexico in both 2022 and 2023. On the other hand, history shows that it may be difficult and costly to reverse extended departures from announced inflation targets. Thus, it will be important for central banks with inflation-targeting frameworks to monitor measures of long-term inflation expectations in the current situation.
The provision of financial services and products is undergoing rapid transformation, including through the development of stablecoins, which seek to stabilize the price of a digital currency by linking its value to that of a pool of assets. Stablecoins can potentially serve as a means of payment and store of value, and may contribute to the development of global payment arrangements that are faster, cheaper, and more inclusive. Yet these potential benefits can only be realized if significant risks are addressed. Stablecoin initiatives built on an existing big tech platform with a global customer base may have the potential to scale rapidly, and could pose regulatory and oversight challenges and risks related to consumer protection, fair competition, and the combating of money laundering and terrorism financing, among others, as well as have a significant impact on public policy goals such as financial stability and monetary policy transmission. This paper, written jointly by G7 members, the BIS, and the IMF, including RESMF staff, scopes the causes and implications of the adoption of global stablecoins, and the potential policy efforts to rein in the risks they can bring about.
We study the optimal design of a central bank digital currency (CBDC) in an environment where agents sort into cash, CBDC and bank deposits according to their preferences over anonymity and security; and where network effects make the convenience of payment instruments dependent on the number of their users. CBDC can be designed with attributes similar to cash or deposits, and can be interest-bearing: a CBDC that closely competes with deposits depresses bankcredit and output, while a cash-like CBDC may lead to the disappearance of cash. Then, the optimal CBDC design trades off bank intermediation against the social value of maintaining diverse payment instruments. When network effects matter, an interest-bearing CBDC alleviates the central bank’s tradeoff.
We estimate world cycles using a new quarterly dataset of output, credit and assetprices assembled using IMF archives and covering a large set of advanced and emerging economies since 1950. World cycles, both real and financial, exist and are generally driven by US shocks. But their impact is modest for most countries. The global financial cycle is also much weaker when looking at credit rather than assetprices. We also challenge the view that synchronization has increased over time. Although this is true for prices (goods and assets), this not true for quantities (output and credit). The world business and credit cycles were as strong during Bretton Woods (1950–1972) as during the Globalization period (1984-2006). For most countries, the way their output co-moves with the rest of the world has changed little over the last 70 years. We discuss the reasons behind these new findings and their policy implications for small open economies.
by Nina Biljanovska, Lucyna Gornicka & Alexandros Vardoulakis
An asset bubble relaxes collateral constraints and increases borrowing by credit-constrained agents. At the same time, as the bubble deflates when constraints start binding, it amplifies downturns. We show analytically and quantitatively that the macroprudential policy should optimally respond to building asset price bubbles non-monotonically depending on the underlying level of indebtedness. If the level of debt is moderate, policy should accommodate the bubble to reduce the incidence of a binding collateral constraint. If debt is elevated, policy should lean against the bubble more aggressively to mitigate the pecuniary externalities from a deflating bubble when constraints bind.
by Senay Agca, Deniz O Igan, Fuhong Li & Prachi Mishra
Why do firms lobby? This paper exploits the unanticipated sequestration of federal budget accounts in March 2013 that reduced the availability of government funds disbursed through procurement contracts to shed light on this question. Following this event, firms with little or no prior exposure to the federal accounts that experienced cuts reduced their lobbying spending. In contrast, firms with a high degree of exposure to the cuts maintained and even increased their lobbying spending. This suggests that, when the same number of contractors competed for a piece of a reduced pie, the more affected firms likely intensified their lobbying efforts to distinguish themselves from the others and improve their chances of procuring a larger share of the smaller overall. These findings are stronger in government-dependent sectors and when there is intense competition. The evidence is more consistent with a rent-seeking explanation for lobbying.
by Deniz O Igan, Hala Moussawi, Alexander F. Tieman, Aleksandra Zdzienicka, Giovanni Dell’Ariccia, Paolo Mauro
We track direct public interventions and public holdings in 1,114 financial institutions over the period 2007–17 in 37 countries based on publicly available information. We use aggregate official data to validate this new dataset and estimate the fiscal impact of interventions, including the value of asset holdings remaining in state hands at end-2017. Direct public support to financial institutions amounted to $1.6 trillion ($3.5 trillion including guarantees), with larger amounts allocated to lower capitalized and less profitable banks. As of end-2017, only a few countries had fully divested the initial support they provided during the crisis. Public holdings were divested faster in better capitalized, more profitable, and more liquid banks, and in countries where the economy recovered faster. In countries where the government stake remained high relative to the initial intervention, private investment and credit growth were slower, financial access, depth, efficiency, and competition were worse, and financial stability improved less.
Over the past three decades, the price of machinery and equipment fell dramatically relative to other prices in advanced and emerging market and developing economies. Using cross-country and sectoral data, we show that the decline in the relative price of tangible tradablecapital goods provided a significant impetus to the capital deepening that took place during the same time period. The broad-based decline in the relative price of machinery and equipment, in turn, was driven by the faster productivity growth in the capital goods producing sectors relative to the rest of the economy, and deeper trade integration, which induced domestic producers to lower prices and increase their efficiency. Our findings suggest an additional channel through which rising trade tensions and sluggish productivity could threaten real investment growth going forward.
We study the impact of bankcredit on firm productivity. We exploit a matched firm-bank database covering all the credit relationships of Italiancorporations, together with a natural experiment, to measure idiosyncratic supply-side shocks to credit availability and to estimate a production model augmented with financial frictions. We find that a contraction in credit supply causes a reduction of firm TFP growth and also harms IT-adoption, innovation, exporting, and adoption of superior management practices, while a credit expansion has limited impact. Quantitatively, the credit contraction between 2007 and 2009 accounts for about a quarter of observed the decline in TFP.
by Antonio Fatás, Atish R. Ghosh, Ugo Panizza & Andrea F Presbitero
Governments issue debt for good and bad reasons. While the good reasons—intertemporal tax-smoothing, fiscal stimulus, and asset management—can explain some of the increases in public debt in recent years, they cannot account for all of the observed changes. Bad reasons for borrowing are driven by political failures associated with intergenerational transfers, strategic manipulation, and common pool problems. These political failures are a major cause of overborrowing though budgetary institutions and fiscal rules can play a role in mitigating governments’ tendencies to overborrow. While it is difficult to establish a clear causal link from high public debt to low output growth, it is likely that some countries pay a price—in terms of lower growth and greater output volatility—for excessive debt accumulation.
by Harald Hau, Peter Hoffmann, Sam Langfield & Yannick Timmer
New regulatory data reveal extensive price discrimination against non-financial clients in the FX derivatives market. The client at the 90th percentile pays an effective spread of 0.5%, while the bottom quarter incur transaction costs of less than 0.02%. Consistent with models of search frictions in over-the-counter markets, dealers charge higher spreads to less sophisticated clients. However, price discrimination is eliminated when clients trade through multi-dealer request-for-quote platforms. We also document that dealers extract rents from captive clients and market opacity, but only for contracts negotiated bilaterally with unsophisticated clients.