World-Watching: India: Building an Export-Oriented Apparel Sector

[from ICRIER, 28 July, 2025]

The Kotak-ICRIER Centre of Excellence for Agriculture Policy, Sustainability, and Innovations (KICEAPSI) is delighted to present its Agri-Food Trends and Analytics Bulletin (AF-TAB), Volume 5, Issue 1, on “Building an Export-oriented Apparel Sector.” [archived PDF] Amidst an evolving geopolitical landscape and shifting global trade patterns, India’s textiles and apparel (T&A) sector stands at a crucial juncture. The country has a rich cultural heritage in textiles and is one of the few nations with the entire T&A value chain, yet its export share in apparel market remains low and stagnant over the last two decades, at least. With China gradually vacating the export market space and global buyers looking to diversify sourcing, India must act swiftly.

This AF-TAB issue explores this window of opportunity through three interesting articles. The first article, ‘India’s Apparel Sector and the Window of Opportunity’, examines India’s stagnant export performance and the structural constraints that have prevented it from capturing a larger global share. It highlights how fragmentation, poor logistics, and high input costs weigh the sector down, despite strong domestic potential. The second article, ‘Missing the Closet: Is India Exporting What the World Wears?’ analyses India’s export basket against global demand trends. It reveals a mismatch between what India produces–largely cotton-based basics and what the global markets demand—man-made fibres (MMF)-based, fashion-forward garments. This misalignment is most visible in key markets like the U.S. and EU. The third article, ‘PM MITRA Parks—Can They Lift Apparel Exports?’, evaluates the government’s flagship scheme designed to address these inefficiencies. While PM MITRA is a much-needed step to create scale, plug-and-play infrastructure, and attract investment, its success depends on timely execution, policy alignment, and strategic targeting.

Read the bulletin [archived PDF].

Economics-Watching: Second-Quarter GDP Growth Estimate Unchanged

[from the Federal Reserve Bank of Atlanta]

The growth rate of real gross domestic product (GDP) is a key indicator of economic activity, but the official estimate is released with a delay. The Federal Reserve Bank of Atlanta’s GDPNow forecasting model provides a “nowcast” of the official estimate prior to its release by estimating GDP growth using a methodology similar to the one used by the U.S. Bureau of Economic Analysis.

GDPNow is not an official forecast of the Atlanta Fed. Rather, it is best viewed as a running estimate of real GDP growth based on available economic data for the current measured quarter. There are no subjective adjustments made to GDPNow—the estimate is based solely on the mathematical results of the model.

Recent forecasts for the GDPNow model are available here [archived PDF]. More extensive numerical details—including underlying source data, forecasts, and model parameters—are available as a separate spreadsheet [archived XLSX]. You can also view an archive of recent commentaries from GDPNow estimates.

Please note that the Atlanta Fed no longer supports the GDPNow app. Download the EconomyNow app to get the latest GDP nowcast and more economic data.

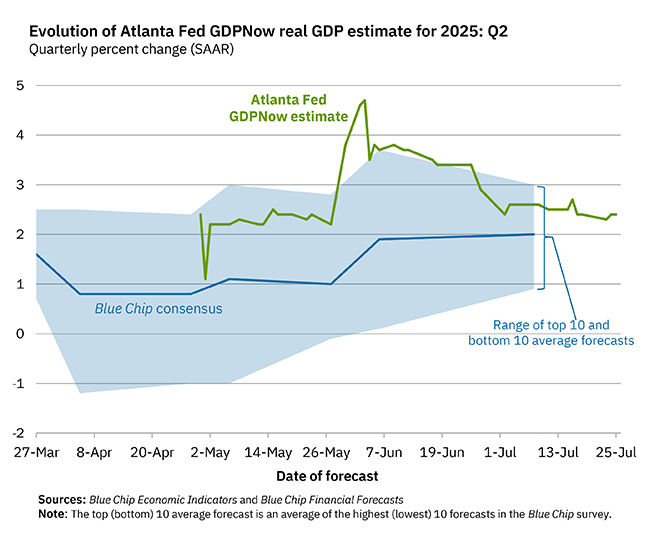
Latest estimate: 2.4 percent — July 25, 2025

The GDPNow model estimate for real GDP growth (seasonally adjusted annual rate) in the second quarter of 2025 is 2.4 percent on July 25, unchanged from July 18 after rounding. The forecasts of the major GDP subcomponents were all unchanged or little changed from their July 18 values after this week’s releases from the U.S. Census Bureau and the National Association of Realtors.

The growth rate of real gross domestic product (GDP) measured by the U.S. Bureau of Economic Analysis (BEA) is a key metric of the pace of economic activity. It is one of the four variables included in the economic projections of Federal Reserve Board members and Bank presidents for every other Federal Open Market Committee (FOMC) meeting. As with many economic statistics, GDP estimates are released with a lag whose timing can be important for policymakers. In preparation for FOMC meetings, policymakers have the Fed Board staff projection of this “advance” estimate at their disposal. These projections—available through 2008 at the Philadelphia Fed’s Real Time Data Center—have generally been more accurate than forecasts from simple statistical models. As stated by economists Jon Faust and Jonathan H. Wright in a 2009 paper, “by mirroring key elements of the data construction machinery of the Bureau of Economic Analysis, the Fed staff forms a relatively precise estimate of what BEA will announce for the previous quarter’s GDP even before it is announced.”

The Atlanta Fed GDPNow model also mimics the methods used by the BEA to estimate real GDP growth. The GDPNow forecast is constructed by aggregating statistical model forecasts of 13 subcomponents that comprise GDP. Other private forecasters use similar approaches to “nowcastGDP growth. However, these forecasts are not updated more than once a month or quarter, are not publicly available, or do not have forecasts of the subcomponents of GDP that add “color” to the top-line number. The Atlanta Fed GDPNow model fills these three voids.

The BEA’s advance estimates of the subcomponents of GDP use publicly released data from the U.S. Census Bureau, U.S. Bureau of Labor Statistics, and other sources. Much of this data is displayed in the BEA’s Key Source Data and Assumptions table that accompanies the “advance” GDP estimate. GDPNow relates these source data to their corresponding GDP subcomponents using a “bridge equation” approach similar to the one described in a Minneapolis Fed [archived PDF] study by Preston J. Miller and Daniel M. Chin. Whenever the monthly source data is not available, the missing values are forecasted using econometric techniques similar to those described in papers by James H. Stock and Mark W. Watson and Domenico Giannone, Lucrezia Reichlin, and David Small. A detailed description of the data sources and methods used in the GDPNow model is provided in an accompanying Atlanta Fed working paper [archived PDF].

As more monthly source data becomes available, the GDPNow forecast for a particular quarter evolves and generally becomes more accurate. That said, the forecasting error can still be substantial just prior to the “advance” GDP estimate release. It is important to emphasize that the Atlanta Fed GDPNow forecast is a model projection not subject to judgmental adjustments. It is not an official forecast of the Federal Reserve Bank of Atlanta, its president, the Federal Reserve System, or the FOMC.

World-Watching: Statement on the Commission’s Status Report in the Climate-Related Disclosure Rules Litigation

[from the U.S. Securities and Exchange Commission]

by Commissioner Caroline A. Crenshaw, July 23, 2025

On April 24, 2025—three months ago—the U.S. Court of Appeals for the Eighth Circuit directed the Commission to provide a status update in the ongoing litigation concerning the Climate-Related Disclosure Rules, which the Commission adopted in March of 2024.[1]

The Court “directed” the Commission to advise whether it “intends to review or reconsider the [R]ules at issue in this case.”[2] And, if the Commission has determined to take no action, the Court ordered the Commission to explain whether it “will adhere to the [R]ules if the petitions for review are denied and, if not, why it will not review or reconsider the [R]ules at this time.”[3]

The Court’s directive was straightforward; our answer is not.

The Commission’s Status Report, filed today, states plainly enough that it has no intention of revisiting the Rules at this time.[4] That, however, is where our responsiveness ends.[5] The Status Report goes on to argue that we cannot expound on what the Commission’s future plans might be in the event the rule-making petitions are denied, because we would be “prejudging” those policy decisions.[6] And, the Status Report explains, any future rule-making should benefit from a court ruling on our statutory authority.[7]

We also weigh in on a number of questions that the Court did not ask of us—for example, we opine that there are “no obstacle[s]” to reaching the merits of the case and that a “live controversy” remains.[8]

This purported response is wholly unresponsive.

The Court asked us in no uncertain terms “will [the Commission] adhere to the [R]ules if the petitions for review are denied[?]” We did not—but should have—answered that question. The unspoken truth under this Commission is that the answer is “no.” Three of the four current Commissioners have been vocal critics of the Rules.[9] They have also withdrawn the Commission from the defense of the Rules in litigation.[10] The Commission simply does not want to say what we all know to be true by now—it has no intention of allowing the Climate-Related Disclosure Rules to go into effect.

Once we acknowledge this answer, the rest of the Commission’s arguments fall away. There are no prejudgment issues, because there is nothing to prejudge. And, we do not need the Court to rule on our statutory authority for the Commission to engage in rule-making. If there is future rule-making in this space—whether to rescind the Rules or otherwise—that rule-making may present different legal issues. Whatever those issues may be, and whomever those aggrieved parties may be, they are not now before the Court. Federal courts are not in the business of giving advisory opinions to agencies.

What is crystal clear, however, is that this Commission is seeking to avoid its legal obligations under the guise of conserving “Commission time and resources.” No matter what, this comes at the expense of judicial resources. As I wrote previously in connection with the Commission’s decision to stop defending these Rules,[11] the Administrative Procedure Act governs the process by which we make and repeal rules. It includes a prescriptive framework for promulgation and rescission. If this Commission wants to rescind, repeal or modify the Rules, which were promulgated by-the-book, then it must do the statutorily-required work. It cannot take the easy way out. It must engage in notice-and-comment rule-making, with the benefit of economic analysis and a public, transparent process, even if inconvenient or if the Commission has other, more pressing priorities.[12] Indeed, other Commissioners have acknowledged that doing the work required to rescind the rule would be a difficult lift.[13] So, instead, we once again ask the Court to do the work for us. By asking the Court to carry water that we should shoulder ourselves, we do a grave disservice to our already taxed judicial system. This is not good governance.

The Commission has effectively ignored the Court’s order and thrown the ball back at the Court. The Court should decline to play these games.


[1] See State of Iowa v. Securities and Exchange Commission, 24-cv-1522 (8th Cir. Apr. 24, 2025) (“Status Update Order”); see also Enhancement and Standardization of Climate-Related Disclosures for Investors [archived PDF], Rel. No. 33-11275 (Mar. 6, 2024), 89 Fed. Reg. 21668 (Mar. 28, 2024) (“Climate-Related Disclosure Rules” or the “Rules”).

[2] Status Update Order.

[3] Id.

[4] Status Report of the Securities and Exchange Commission in Response to the Court’s April 24, 2025 Order, State of Iowa v. Securities and Exchange Commission, 24-cv-1522 (8th Cir. July 23, 2025)(“Status Report”) at 2 (“The Commission does not intend to review or reconsider the Rules at this time.”).

[5] These viewpoints do not reflect upon the efforts of the staff in our Office of the General Counsel.

[6] Status Report at 2.

[7] Id. at 2, 4, 5.

[8] Id. at 2, 3.

[9] See, e.g., Commissioner Hester M. Peirce, Green Regs and Spam: Statement on the Enhancement and Standardization of Climate-Related Disclosures for Investors (Mar. 6, 2025); Commissioner Mark T. Uyeda, A Climate Regulation under the Commission’s Seal: Dissenting Statement on the Enhancement and Standardization of Climate-Related Disclosures for Investors (Mar. 6, 2025); see generally Lesley Clark, “Trump SEC Pick Wants to Ditch Landmark Climate Disclosure Rule,” Politico (Dec. 9, 2024).

[10] See Status Report filed by SEC, State of Iowa v. Securities and Exchange Commission, 24-cv-1522 (8th Cir. Mar. 27, 2025); SEC Press Release No. 2025-58, SEC Votes to End Defense of Climate Disclosure Rules (Mar. 27, 2025) (According to then-Acting Chair Uyeda, “The goal of today’s Commission action and notification to the court is to cease the Commission’s involvement in the defense of the costly and unnecessarily intrusive climate change disclosure rules.”).

[11] Commissioner Caroline A. Crenshaw, Statement Regarding Climate-Related Disclosures Rule Litigation: The Commission has Left the Building (Mar. 27, 2025).

[12] Commissioner Mark T. Uyeda, Remarks at the “SEC Speaks” Conference 2025 (May 19, 2025) (“For the Commission to rescind the climate-related disclosure rule—and address the countless factual findings discussed in that 885-page release—would place a significant strain on the Commission’s resources. This effort would be a difficult lift, and it would potentially take away staff resources needed to advance the regulatory regime with respect to crypto and capital formation.”).

[13] Id.

Economics-Watching: Kuwait: GDP Returns to Growth in Q1 2025 as Impact of Oil Output Cuts Fades

[from NBK Economic Research, 21 July, 2025]

by Mohammad Al-Shehri, Assistant Economist & Omar Al-Nakib, Head of MENA Research

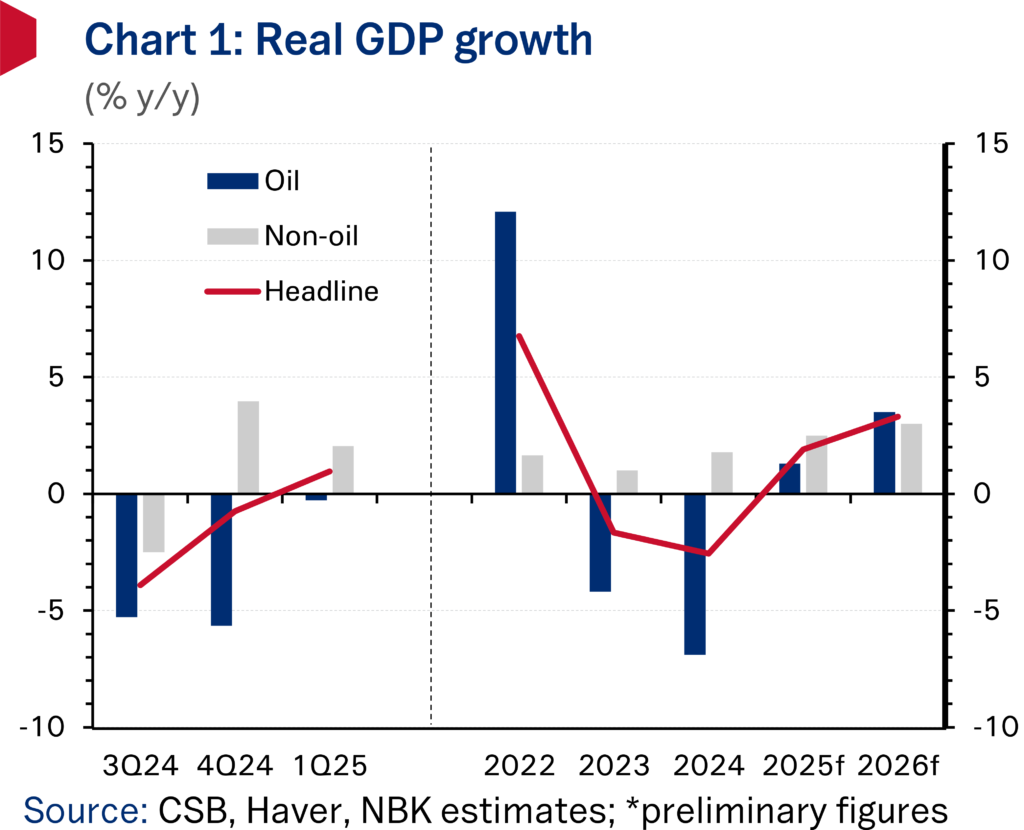
Preliminary official figures show GDP expanding 1% y/y in Q1 2025 following seven consecutive quarters of contraction, helped by a less severe downturn in oil output. With the negative effects of earlier voluntary oil production cuts beginning to fade, oil GDP recorded only a marginal decline, the softest since Q2 2023. Growth in non-oil activity remained positive though eased, weighed by a moderation in the manufacturing, real estate, and transport sectors. The near-term outlook for GDP is one of positive growth, lifted by rising oil production after Kuwait started to restore 135 kb/d of oil output cuts between April and September 2025, while the non-oil sector should also register further steady gains.

Non-oil GDP growth softens in Q1 2025 after strong performance in Q4 2024

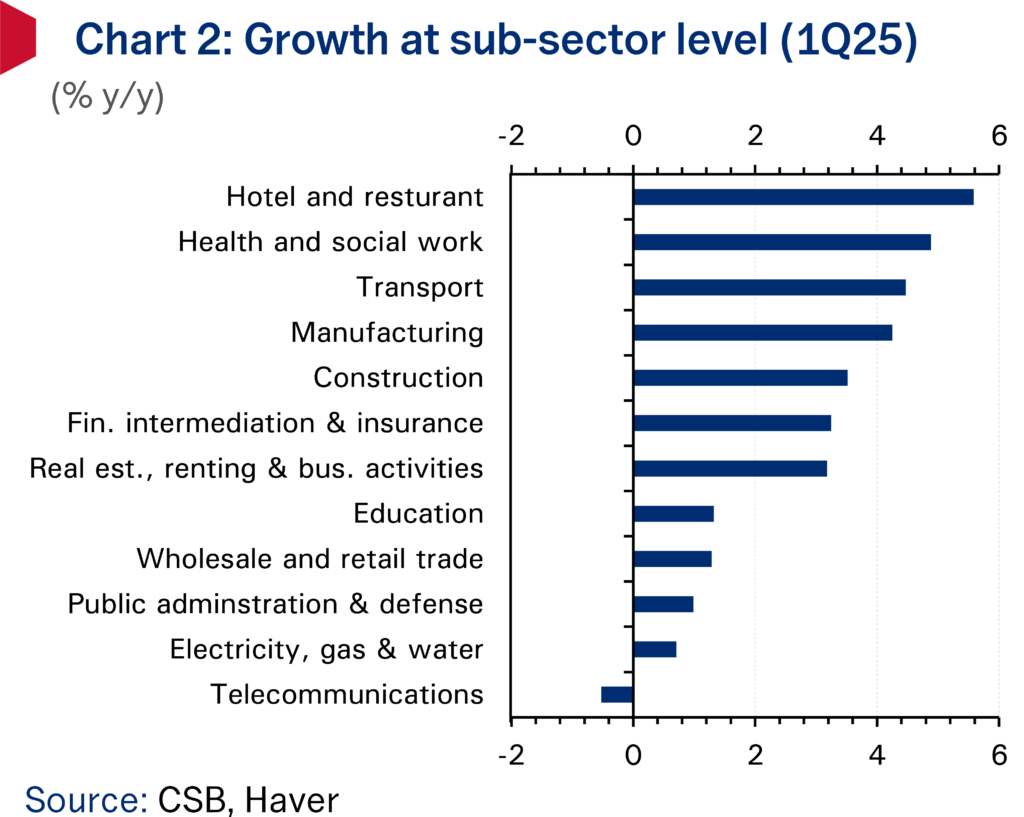
Growth in the non-oil sector weakened in Q1 2025, slowing to 2% y/y compared to 4% recorded in the prior quarter. (Chart 1.) The softer expansion in non-oil activity reflected, among other things, a moderation in the manufacturing sector, where activity grew at a still-solid 4.3% despite a decline in refined petroleum products output but slowed notably from the 12.2% reading registered in Q4 2024. Growth in other sectors including real estate, wholesale & retail trade, transport, and education also slowed. Offsetting the slowdown was stronger expansion in the non-oil economy’s largest segments: public administration and defense as well as financial intermediation and insurance, which grew 1% and 3.2% y/y, respectively. (Chart 2.)

Chart 1: Real GDP growth

Chart 2: Growth at sub-sector level (1Q25)

Oil sector logs marginal contraction, set to return to growth in Q2

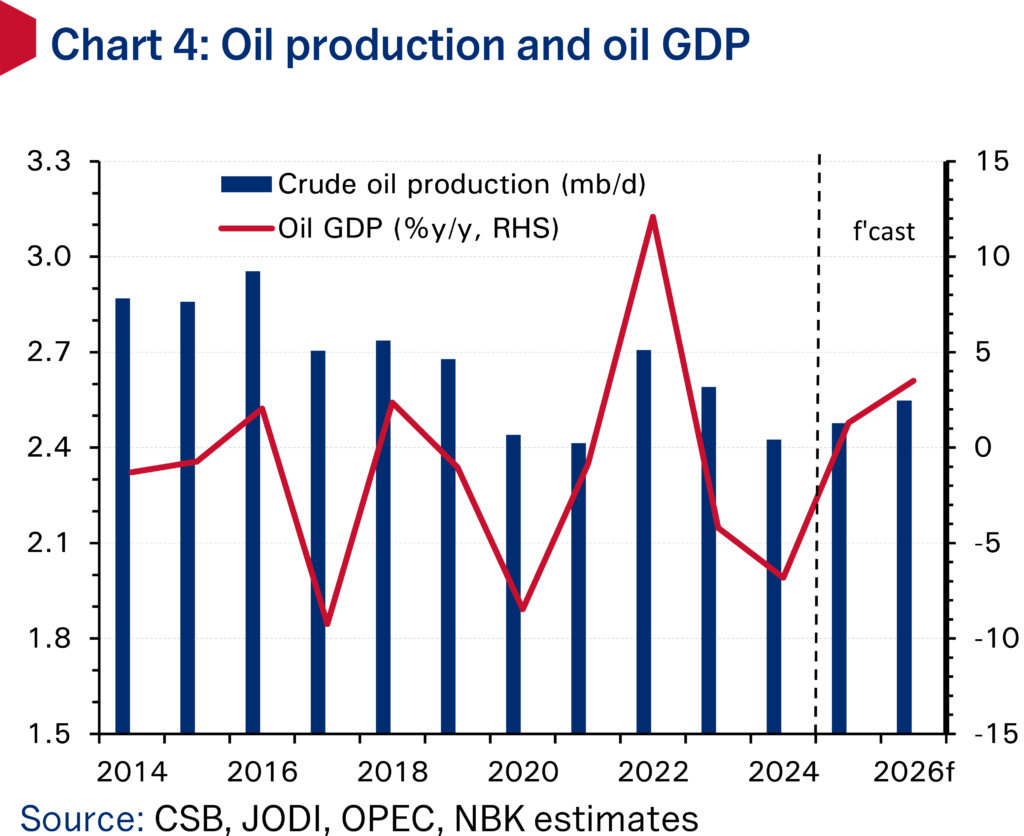
The contraction in oil GDP eased significantly to -0.3% y/y from -5.7% y/y in Q4 2024, registering the softest rate of decline since Kuwait embarked on cutting oil production in Q2 2023 after participating in the voluntary cuts scheme with 7 other OPEC+ members. (Chart 4.) Kuwait’s oil production averaged 2.415 mb/d in Q1 2025, a 0.7% decline from the same quarter last year, according to OPEC secondary sources. However, oil sector fortunes are set to shift in Q2 2025 and thereafter, after the OPEC-8 member alliance started unwinding the 2.2 mb/d voluntary cut tranche in April 2025. Originally planned to be unwound over the course of 18 months, OPEC+ has accelerated the pace of supply hikes with output now on a path to be fully restored in September, a full year ahead of schedule. For Kuwait, crude production rose by 0.5% q/q in Q2 to 2.426 mb/d and is set to accelerate further to average 2.533 mb/d in H2 2025. With the oil market so far able to absorb the additional OPEC and global supply and oil prices currently holding near $70/bbl, an upside risk to our oil sector outlook involves the potential unwinding of the outstanding OPEC-8 voluntary cuts (1.66 mb/d), of which Kuwait’s share is 128 kb/d.

Growth heading back into positive territory in 2025

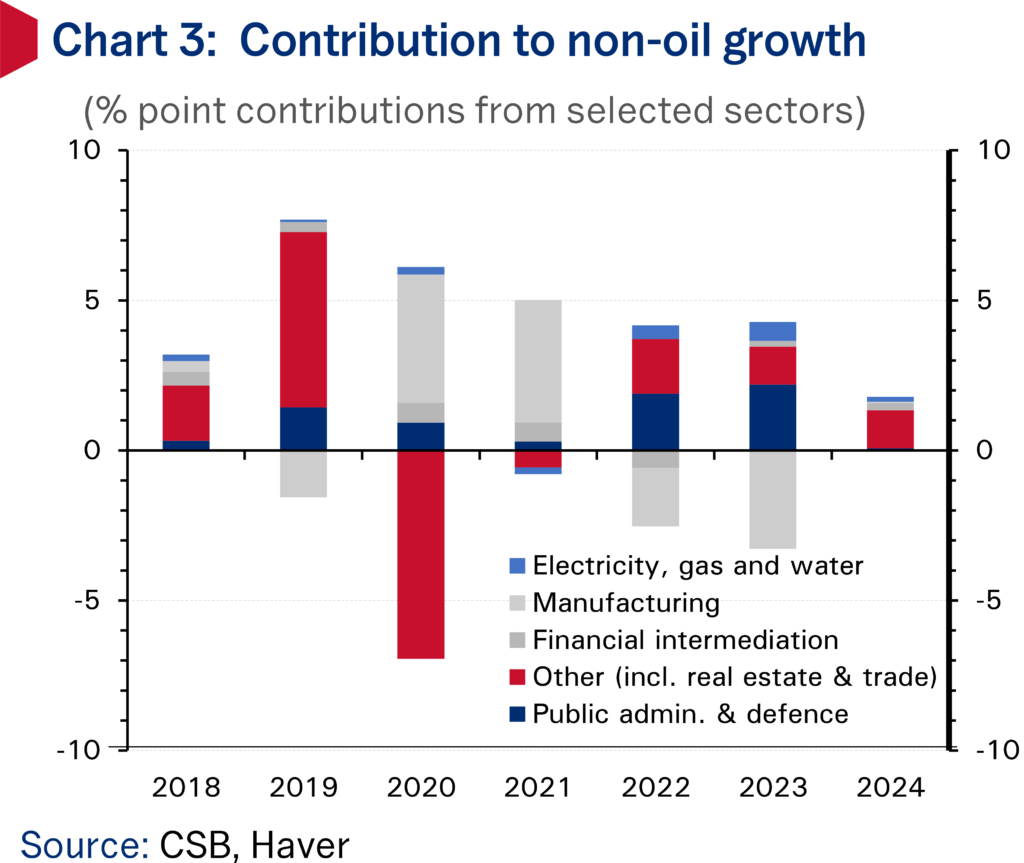
Growth in total GDP is set to remain on a positive trajectory in the near term, buoyed by further steady expansion in non-oil economic activity and increased oil production. Non-oil GDP is set to benefit from the government’s reform drive which includes the recent passing of the debt law that could catalyze the implementation of key development projects and the potential approval of the ‘mortgagelaw later in 2025, which could spur higher household borrowing and consumer spending. Economic indicators for Q2 2025 pointed to a healthy pace of non-oil economic activity. The key ‘output’ and ‘new orders’ balances in the non-oil private sector PMI gauge both averaged a very robust 57+ in Q2 2025, real estate activity continued to expand at a robust pace with earlier price falls in the residential sector abating, while credit growth stood at a healthy 5.5% y/y in May, and could benefit in coming months if interest rates are reduced further.

Nonetheless, there are also downside risks to the outlook. Local consumer spending growth (according to central bank card transactions data) turned negative in Q1 2025, extending the weakening trend now observed for more than a year. The government’s ongoing fiscal consolidation push will also weigh on wage and job growth. Overall, we see GDP growing 1.9% this year, boosted by expansions in both the oil and non-oil sectors of 1.2% and 2.5%, respectively.

Chart 3: Contribution to non-oil growth

Chart 4: Oil production and oil GDP

Read this article as an archived PDF.

World-Watching: U.S. Greenlighted H20 Chips Export on Its Own Initiative, China Says

Beijing clarifies its deal with Washington didn’t include NVIDIA’s 4th-best AI chip, disputing widely-reported comments by U.S. Commerce Secretary Howard Lutnick

by Zichen Wang, from Pekingnology

The U.S. greenlighted NVIDIA’s China-specific Artificial Intelligence chip, known as the H20, for export to China on its own initiative, China said on Friday.

In a statement dedicated to the recent U.S. approval of the semiconductor giant’s 4th-best Artificial Intelligence chip, China’s Ministry of Commerce said on its website that in early July, the U.S. had already lifted restrictions on China under the agreement reached between the two countries in London.

“We have taken note that Washington has now taken the initiative to announce it will authorize sales of NVIDIA’s H20 chips to China,” the trade ministry added.

Beijing’s clarification stands in stark contrast to widely reported public comments earlier this week by U.S. Commerce Secretary Howard Lutnick, who told Reuters on Tuesday that “We put that in the trade deal with the magnets,” referring to the agreement made to restart Chinese rare earth shipments to U.S. manufacturers. He did not provide additional details, according to Reuters.

NVIDIA’s H20 was designed to be technologically inferior. The company also sells three other chips that far surpass the H20’s power.

Commerce Secretary Howard Lutnick echoed NVIDIA CEO Jensen Huang’s view of why a U.S. company should sell chips to China. Andrew Harnik/Getty Images

On Monday, July 14, the Silicon Valley company announced in a blog post that the U.S. government had approved the sale of the H20, three months after the Donald Trump administration shut down NVIDIA’s artificial intelligence chip sales to China, after CEO Jensen Huang met President Trump in Washington D.C., and before he departed for Beijing.

Huang dominates Chinese headlines this week with his speech at an industry conference and public events with Chinese AI leaders. He visited China’s Ministry of Commerce and was received by Wang Wentao, the minister, on Thursday.

商务部新闻发言人就美批准对华销售英伟达H20芯片有关情况答记者问

MOFCOM Spokesperson Responds to Questions on the U.S. Approval of NVIDIA H20 Chip Sales to China

2025-07-18 13:43

Question:

U.S. officials have recently stated that Washington’s decision to approve sales of NVIDIA’s H20 chips to China is part of ChinaU.S. economic and trade negotiations. They also claimed that Chinese firms, including Huawei, are already producing equivalent chips domestically and that the United States does not want China to achieve full import substitution. How does the Ministry of Commerce (MOFCOM) view this?

Answer:

Following the ChinaU.S. economic and trade consultations in London, the two sides have maintained close communication, finalized the “London framework,” and moved forward with implementation. China, in accordance with its laws and regulations, approves export applications for controlled items that meet the necessary criteria. In early July, the United States reciprocally lifted the restrictions on China that had been discussed during those talks.

We have taken note that Washington has now taken the initiative to announce it will authorize sales of NVIDIA’s H20 chips to China. Beijing believes the United States should abandon a zero-sum mentality and continue to roll back a range of unwarranted trade and technology restrictions on China.

Cooperation and mutual benefit are the only viable path; suppression and containment lead nowhere. In May, the United States issued new export-control guidelines targeting Huawei’s Ascend chips, tightening restrictions on Chinese semiconductor products under unfounded pretexts. By wielding administrative power to distort fair market competition, these measures severely undermine the legitimate rights and interests of Chinese companies. China has made its position clear and firmly opposes such actions.

We look forward to the United States working with China in a spirit of equality to correct these erroneous practices, foster a sound environment for mutually beneficial cooperation between the two countries’ enterprises, and jointly safeguard the stability of global semiconductor supply chains.

Economics-Watching: BRICS Currency Creates Dilemma for the Dollar

by Christopher Whalen, from China Daily

The term “BRICS currency” typically refers to a hypothetical or proposed unified currency for the BRICS grouping. It’s not a single, physical currency currently in use, but rather a concept for a potential future monetary system that some suggest will reduce the dominance of the U.S. dollar in international trade and finance.

Is BRICS currency cooperation about immediate de-dollarization or long-term financial sovereignty? The answer is that BRICS cooperation may include reducing long-term dependence on the dollar as a means of exchange. The dollar is involved in more than half of all trade and 80 percent of all foreign exchange transactions. BRICS currency cooperation aims to gradually reduce the group’s dollar dependency, but challenges remain.

The BRICS concept came about not because the dollar is unsuitable as a means of exchange or unit of account, but rather because of the use of the dollar by Washington as a weapon. As I note in my book, Inflated: Money, Debt and the American Dream, the special role of the dollar in U.S. finance allows the U.S. government to impose harsh compliance and reporting requirements on foreign nationals and institutions. The U.S. is an arbitrary hegemon and does not follow reciprocity with other countries.

The global role of the dollar is an anomaly, the byproduct of two world wars had left the other antagonists broke by the time the Bretton Woods Agreement was signed in July 1944.

Choosing the fiat paper dollar as the default global reserve currency more than seven decades ago reflected the fact that the United States was one of the victors and possessed the wealth that gave Washington unchallenged economic leadership. Prior to World War I, the United Kingdom’s pound sterling was the global standard, but importantly, this paper currency was backed by gold — the only money that is not debt. The dollar, too, was backed by gold — until 1933, when the Franklin Roosevelt administration confiscated gold in private hands to prevent his government from collapsing.

Pound notes started to circulate in England in 1694, shortly after the establishment of the Bank of England. The paper pound helped to fuel the expansion of the British Empire, in large part because the only competing form of money was physical gold. When Britain and other nations left the gold standard in the 1930s, it was due to the deflation caused by the Great Depression rather than a deliberate choice.

The 19th-century rule attributed to English journalist and businessman Walter Bagehot says that in times of crisis, lend freely at a high rate against good collateral. Yet since the currency devaluation and gold seizures of 1933, fiat currencies and below-market interest rates have been the rule. In a global scheme in which the government occupies the prime position, the operative term remains “financial repression”, whereby governments control markets and artificially suppress rates of return on debt. For this reason, the dollar is losing its role as a store of value to gold.

The fact that the dollar continues to trade strongly versus other currencies reflects the reality that as the main means of exchange globally, the dollar cannot be easily replaced. One reason for this continued support for the dollar is that the trade in petroleum and other commodities is so large that it requires an equally large currency to accommodate it. Also, neither the Europeans nor the Japanese, the only two possible alternatives, are willing to risk the external deficits or inflation that the U.S. suffers as the host for the global currency.

What global currency will replace the fiat paper dollar? None. As this article is being written, gold is the second-largest reserve asset for central banks after the dollar. “The initiation in 2002 of the Shanghai Gold Exchange was of great strategic significance, both for gold and the global monetary system,” notes veteran gold fund manager Henry Smyth in an interview in The Institutional Risk Analyst. “Now it is completely clear what happened.”

Smyth and many other observers see the creation of the SGE in 2002 as the return of gold to the international monetary system. But while gold is growing in importance as a reserve asset for many countries, it does not mean that the role of the dollar as a global means of exchange or unit of account is about to change.

The dollar will remain the dominant asset. And even then, displacing the dollar will require a major change in the international monetary system, a change that is already underway.

The author is the chairman of Whalen Global Advisors LLC in New York and the author of Inflated: Money, Debt and the American Dream published by Wiley Global (2025).

Economics-Watching: From Code to Cash: How Programmable Payments Are Shaping the Future of Finance

[from the Federal Reserve Bank of Atlanta, by Chris Colson, payments expert]

When I was first introduced to computers, programming languages like COBOL, Fortran, and Pascal were standard. None of them were particularly user-friendly, especially for someone like me who isn’t a natural coder. Over time, new languages and tools appeared, making programming more accessible.

Today, we have low-code and no-code platforms [related YouTube video] that allow people with little to no coding experience to build apps. Just as programming has become easier, payments are becoming programmable, offering automation, simplicity, and flexibility.

Programmable payments are automated transactions that occur when specific conditions or events are met. Unlike traditional payment methods, which can rely on manual approvals or fixed schedules (think monthly software transactions), programmable payments offer a more dynamic approach. For instance, a programmable payment might only occur when a product is delivered or a service is completed.

Two key technologies power programmable payments: smart contracts and application programming interfaces (APIs). Smart contracts are self-executing digital agreements that run on blockchain and automatically release payments once specified conditions are met. APIs allow different systems to communicate, which enables the automation of payment processes across platforms. For example, a business might set up an API process that triggers a payment and then marks the invoice as “paid” in its accounting software.

The biggest advantage of programmable payments is automation. By automating transactions, businesses can eliminate repetitive tasks like payroll or vendor payments, reducing the time spent on manual processes while also minimizing the risk of human error. Automation can also help businesses save money, as they may no longer need intermediaries like banks or payment processors to facilitate transactions. Blockchain-based smart contracts can bypass the need for banks to verify payments, resulting in faster, cheaper transactions.

Transparency and security are other significant advantages, particularly when programmable payments are powered by blockchain. Each transaction is recorded on a decentralized ledger, providing a clear, auditable trail of activity. This can help reduce the risk of fraud and create a more secure system for managing payments.

The potential of programmable payments goes beyond automating individual transactions. For supply chain management, payments that are automatically triggered upon delivery of goods can reduce the need for manual verification, and thus improve operational efficiency. In decentralized finance, programmable payments can streamline processes like loan repayments and insurance payouts, improving speed and transparency.

As the Internet of Things expands, integrating programmable payments could allow devices to handle payments autonomously. Imagine a car that automatically pays for tolls or parking, or a smart refrigerator that orders and pays for groceries when supplies run low. The possibilities for real-time, automated payments between connected devices are enormous.

Despite all the potential, programmable payments face challenges. The technology—particularly blockchain-based systems—can be complex and requires specialized expertise, which can increase upfront costs for businesses. In addition, the regulatory environment around programmable payments is still evolving, especially for cross-border transactions. This creates uncertainty for businesses.

Much like low-code and no-code platforms make app development accessible to non-coders, programmable payments are moving toward a future with minimal human intervention. Both are about simplifying complex systems: low-code/no-code platforms hide the complexity of software development, while programmable payments automate financial processes with predefined logic.

Both point to a future where systems execute tasks on their own, based on rules set by users. The goal is simple: Once the conditions are established, the system handles the rest.

Programmable payments are reshaping the future of finance. It’s an exciting future that promises smarter and more streamlined and efficient financial operations.

Economics-Watching: Remittances in Times of Uncertainty: Understanding the Dynamics and Implications

[from the International Monetary Fund, by Patrick A. Imam, Kangni R Kpodar, Djoulassi K. Oloufade, Vigninou Gammadigbe]

This paper delves into the intricate relationship between uncertainty and remittance flows. The prevailing focus has been on tangible risk factors like exchange rate volatility and economic downturn, overshadowing the potential impact of uncertainty on remittance dynamics. Leveraging a new dataset of quarterly remittances combined with uncertainty indicators across 77 developing countries from 1999 Q1 to 2019 Q4, the analysis highlights that uncertainty in remittance-sending countries negatively affects remittance flows. In contrast, uncertainty in remittance receiving-countries has a more complex, dual effect. In countries with high private investment ratios, rising domestic uncertainty leads to a decline in remittances. Conversely, in countries with low public spending on education and health, remittances increase in response to uncertainty, serving as a social safety net. The paper underscores the heterogeneous and non-linear effects of domestic uncertainty on remittance flows.

Read the paper [archived PDF].

Economics-Watching: Kuwait’s Banking Sector Posts Solid Credit Growth in October

[from NBK Group’s Economic Research Department, 21 November, 2024]

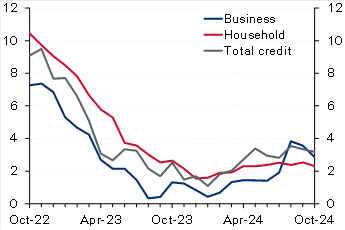
Kuwait: Solid credit growth in October driven by household credit. Domestic credit increased by a solid 0.4% in October, driving up YTD growth to 2.9% (3.2% y/y). The recovery in household credit continued, with growth in October at a solid 0.5%, resulting in a YTD increase of 2.4%. While y/y growth in household credit remains a limited 2.3%, annualized growth over the past four months is a stronger 4.7%. Business credit inched up by 0.2% in October, pushing YTD growth to 3.6% (2.9% y/y). Industry and trade drove business credit growth in October while construction and trade are the fastest growing YTD at 17% and 8%, respectively. In contrast, the oil/gas sector continued its downtrend, deepening the YTD decrease to 13%. Excluding the oil/gas sector, growth in business credit would increase to a relatively good 5% YTD. Looking ahead, the last couple of months of the year (especially December) are usually the weakest for business credit, likely due to increased repayments and write-offs, but it will not be surprising if the recovery in household credit is generally sustained, especially given the commencement of the interest rate-cutting cycle. Meanwhile, driven by a plunge in the volatile public-institution deposits, resident deposits decreased in October, resulting in YTD growth of 2.4% (4.2% y/y). Private-sector deposits inched up in October driving up YTD growth to 4.5% compared with 10% for government deposits while public-institution deposits are a big drag (-14%). Within private-sector KD deposits, CASA showed further signs of stabilization as there was no decrease for the third straight month while the YTD drawdown is a limited 1%.

Chart 1: Kuwait credit growth

(% y/y)

Source: Central Bank of Kuwait (CBK)
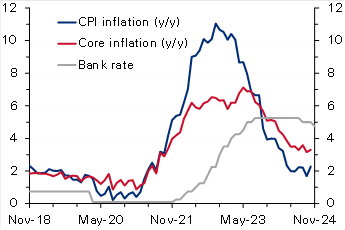
Chart 2: UK inflation

(%)

Source: Haver

Egypt: IMF concludes mission for fourth review, sees external risks. The IMF concluded its visit to Egypt after spending close to 2 weeks, holding several in-person meetings with the Egyptian authorities, private sector, and other stakeholders. The IMF released a statement mentioning that the current ongoing geopolitical tensions in the region in addition to an increasing number of refugees have affected the external sector (Suez Canal receipts down by 70%) and put severe pressure on the fiscal front. The Fund acknowledged the Central Bank of Egypt’s commitment to unify the exchange rate, maintain the flexible exchange rate regime, and keep inflation on a firm downward trend over the medium term by substantially tightening monetary policy. It also highlighted that continued policy discipline was also a key to containing fiscal risks, especially those related to the energy sector. The Fund, as always, re-iterated the need for promoting the private sector mainly through an enhanced tax system and accelerating divestment plans of the state firms. Finally, it also said that the discussions would continue over the coming days to finalize the agreement on the remaining policies and reform plans. However, the release did not provide any clear hints about the conclusion on the government’s earlier request to push the timeline of some of the subsidy moves.

Oman: IMF completes article IV with a strong outlook for the economy in 2025. Oman’s economy continued to expand with growth reaching 1.9% in the first half of 2024 (versus 1.2% in 2023), despite being weighed down by OPEC+ mandated oil production cuts as non-oil GDP grew a stronger 3.8% y/y in H1 (versus 1.8% in 2023). The fiscal and current account balances remain in a comfortable situation evident by a decline in public sector debt and the recent rating upgrade to investment grade. The Fund expects Oman’s economic growth to see a strong rebound in 2025, supported by higher oil production. It also believes that fiscal and current account balances will remain in surplus but at lower levels. Key risks to the outlook stem from oil price volatility and intensifying geopolitical tensions. The IMF also mentioned that further efforts are needed to raise nonhydrocarbon revenues through more tax policy measures and the phasing out of untargeted subsidies which should help in freeing up resources to finance growth under the government’s diversification agenda.

UK: Inflation rises more than forecast, reinforcing BoE’s caution on rate cuts. UK CPI inflation increased to 2.3% y/y in October from 1.7% the previous month, slightly above the market and the Bank of England’s forecast of 2.2%. On a monthly basis too, inflation rose to 0.6%, a seven-month high, from September’s no change. The steep rise was mainly driven by an almost 10% rise in the household energy price cap effective from October. Core inflation also accelerated to 3.3% y/y (0.4% m/m) from 3.2% (0.1% m/m). While goods prices continued to fall (-0.3% y/y), service prices rose at a faster rate of 5% from 4.9%. Recently, the Bank of England had cautioned about inflation quickening next year (projecting a peak rate of 2.8% in Q3 2025), citing the impact of higher insurance contributions and rising minimum wages as outlined in the latest government budget. Therefore, with inflation rising above forecast, the bank will likely slow the pace of monetary easing after delivering two interest rate cuts of 25 bps earlier, with markets now seeing only two additional cuts by the end of 2025.

Eurozone: ECB warns of fiscal and growth risks in its latest Financial Stability Review [archived PDF]. In its most recent Financial Stability Review (November) [archived PDF], the European Central Bank warned that elevated debt and fiscal deficit levels and anemic long-term growth could expose sovereign debt vulnerabilities in the region, stoking concerns of a repeat of the 2011 sovereign debt crisis. Maturing debt being rolled over at much higher borrowing rates raising debt service costs poses risks to countries with little fiscal space and leaves certain governments exposed to market fluctuations. The bank also emphasized the risks of high equity valuations, low liquidity and a greater concentration of exposure among non-banks. Moreover, it sees current geopolitical uncertainties and the possibility of more trade tensions as heightening risks. The Eurozone’s current government debt-to-GDP ratio stands at 88%, but the underlying data suggest a much more precarious situation with Greece, Italy, and France’s ratios at 164%, 137% and 112%. Recently, concerns about France’s high fiscal deficit (around 5.9% of GDP) and elevated debt levels saw yields on the country’s bonds rise steeply, widening the spread gap with German bonds to the highest level in over a decade.

Stock marketsIndexDaily Change (%)YTD Change (%)
Regional
Abu Dhabi (ADI)9,405-0.23-1.80
Bahrain (ASI)2,043-0.373.62
Dubai (DFMGI)4,7610.6117.26
Egypt (EGX 30)30,588-0.33 23.18
GCC (S&P GCC 40)7090.09-0.52
Kuwait (All Share)7,353-0.087.86
KSA (TASI)11,868-0.07-0.83
Oman (MSM 30)4,6090.002.10
Qatar (QE Index)10,4380.12-3.62
International
CSI 3003,9860.2216.17
DAX19,005-0.2913.45
DJIA43,4080.3215.17
Eurostoxx 504,730-0.454.60
FTSE 1008,085-0.174.55
Nikkei 22538,352-0.1614.61
S&P 5005,9170.0024.05
3m interbank rates%Daily Change (bps)YTD Change (bps)
Bahrain5.86-1.29-66.34
Kuwait3.940.00-37.50
Qatar6.000.00-25.00
UAE4.433.81-89.96
Saudi5.50-4.75-73.14
SOFR4.52-0.09-81.13
Bond yields%Daily Change (bps)YTD Change (bps)
Regional
Abu Dhabi 20274.665.0033.9
Oman 20275.496.0033.0
Qatar 20264.686.0016.1
Kuwait 20274.693.0035.0
Saudi 20284.961.0043.9
International 10-year
US Treasury4.411.7755.3
German Bund2.340.3531.2
UK Gilt4.472.6093.0
Japanese Gov’t Bond1.071.045.4
Exchange ratesRateDaily Change (%)YTD Change (%)
KWD per USD0.310.04-0.05
KWD per EUR0.32-0.46-1.98
USD per EUR1.05-0.49-4.47
JPY per USD155.430.5010.19
USD per GBP1.27-0.25-0.62
EGP per USD49.670.3461.00
Commodities$/unitDaily Change (%)YTD Change (%)
Brent crude72.81-0.68-5.49
KEC73.780.74-7.26
WTI68.87-0.75-3.88
Gold2,648.20.8028.40

Disclaimer: While every care has been taken in preparing this publication, National Bank of Kuwait accepts no liability whatsoever for any direct or consequential losses arising from its use. Daily Economic Update is distributed on a complimentary and discretionary basis to NBK clients and associates. This report and previous issues can be found in the “News & Insight / Economic Reports” section of the National Bank of Kuwait’s web site. Please visit their web site, nbk.com, for other bank publications.

Economic-Watching: County Employment & Wages – Second Quarter 2024

[from the U.S. Bureau of Labor Statistics, 20 November, 2024]

From June 2023 to June 2024, employment increased in 259 of the 369 largest U.S. counties, the U.S. Bureau of Labor Statistics reported today. In June 2024, national employment increased to 155.7 million, a 0.8-percent increase over the year, as measured by the Quarterly Census of Employment and Wages (QCEW) program. Kings, NY, had the largest over-the-year increase in employment, with a gain of 4.0 percent. Employment data in this release are presented for June 2024, and average weekly wage data are presented for second quarter 2024.

Among the 369 largest counties, 348 had over-the-year increases in average weekly wages. In the second quarter of 2024, average weekly wages for the nation increased to $1,390, a 4.4-percent increase over the year. Hamilton, IN, had the largest second quarter over-the-year wage gain at 33.4 percent. (See table 1 [archived PDF].)

Large County Employment in June 2024

Kings, NY, had the largest over-the-year percentage increase in employment (+4.0 percent). Within Kings, the largest employment increase occurred in education and health services, which rose by 37,473 (+10.3 percent).

Elkhart, IN, had the largest over-the-year percentage decrease in employment (-3.0 percent). Within Elkhart, the largest employment decrease occurred in manufacturing, which fell by 3,243 (-5.0 percent).

Large County Average Weekly Wage in Second Quarter 2024

Hamilton, IN, had the largest over-the-year percentage increase in average weekly wages (+33.4 percent). Within Hamilton, an average weekly wage gain of $2,161 (+139.6 percent) in professional and business services made the largest contribution to the county’s increase in average weekly wages.

Essex, MA, had the largest over-the-year percentage decrease in average weekly wages (-2.1 percent). Within Essex, an average weekly wage loss of $644 (-25.7 percent) in professional and business services made the largest contribution to the county’s decrease in average weekly wages.

Ten Largest Counties

Nine of the 10 largest counties had over-the-year percentage increases in employment. In June 2024, Miami-Dade, FL, had the largest over-the-year employment percentage gain (+1.5 percent). Within Miami-Dade, leisure and hospitality had the largest employment increase and rose by 3,530 (+2.4 percent). (See table 2 [archived PDF].)

All of the 10 largest counties had over-the-year percentage increases in average weekly wages. In the second quarter of 2024, King, WA, experienced the largest over-the-year percentage gain in average weekly wages (+10.4 percent). Within King, professional and business services had the largest impact, with an average weekly wage increase of $774 (+24.5 percent).

For More Information

The tables included in this release contain data for the nation and for the 369 U.S. counties with annual average employment levels of 75,000 or more in 2023. June 2024 employment and second quarter 2024 average weekly wages for all states are provided in table 3 [archived PDF] of this release.

Over-the-year changes of employment and wages presented in this news release are adjusted and may differ from unadjusted data used in BLS data tools and interactive charts. More information is available in the QCEW Technical Note.

QCEW reporting rates tables are available here.

The most current news release on quarterly measures of gross job flows is available from QCEW Business Employment Dynamics.

Several BLS regional offices issue QCEW news releases targeted to local data users. Links to these releases are available here.

QCEW data are available in the Census Business Builder suite of web tools, assisting business owners and regional analysts in data-driven decision making.

The QCEW news release schedule is available here.


The County Employment and Wages full data update for second quarter 2024 is scheduled to be released on Thursday, December 5, 2024, at 10:00 a.m. (ET).

The County Employment and Wages news release for third quarter 2024 is scheduled to be released on Wednesday, February 19, 2025, at 10:00 a.m. (ET).

The full report with tables [archived PDF].