Economics-Watching: “Doing Nothing” Is Still Doing a Lot

[from the Federal Reserve Bank of Philadelphia, speech by Patrick T. Harker President and Chief Executive Officer at the National Association of Corporate Directors Webinar, Philadelphia, PA (Virtual)]

Good afternoon, everyone.

I appreciate that you’re all giving up part of the end of your workday for us to be together, if only virtually.

My thanks to my good friend, Rick Mroz, for that welcome and introduction.

I do believe we’re going to have a productive session. But just so you all know, as much as I enjoy speaking and providing my outlook, I enjoy a good conversation even more.

So, first, let’s take a few minutes so I can give you my perspective on where we are headed, and then I will be more than happy to take questions and hear what’s on your minds.

But before we get into any of that, I must begin with the standard Fed disclaimer: The views I express today are my own and do not necessarily reflect those of anyone else on the Federal Open Market Committee (FOMC) or in the Federal Reserve System.

Put simply, this is one of those times where the operative words are, “Pat said,” not “the Fed said.”

Now, to begin, I’m going to first address the two topics that I get asked about most often: interest rates and inflation. And I would guess they are the topics front and center in many of your minds as well.

After the FOMC’s last policy rate hike in July, I went on record with my view that, if economic and financial conditions evolved roughly as I expected they would, we could hold rates where they are. And I am pleased that, so far, economic and financial conditions are evolving as I expected, if not perhaps even a tad better.

Let’s look at the current dynamics. There is a steady, if slow, disinflation under way. Labor markets are coming into better balance. And, all the while, economic activity has remained resilient.

Given this, I remain today where I found myself after July’s meeting: Absent a stark turnabout in the data and in what I hear from contacts, I believe that we are at the point where we can hold rates where they are.

In barely more than a year, we increased the policy rate by more than 5 percentage points and to its highest level in more than two decades — 11 rate hikes in a span of 12 meetings prior to September. We not only did a lot, but we did it very fast.

We also turned around our balance sheet policy — and we will continue to tighten financial conditions by shrinking the balance sheet.

The workings of the economy cannot be rushed, and it will take some time for the full impact of the higher rates to be felt. In fact, I have heard a plea from countless contacts, asking to give them some time to absorb the work we have already done.

I agree with them. I am sure policy rates are restrictive, and, as long they remain so, we will steadily press down on inflation and bring markets into a better balance.

Holding rates steady will let monetary policy do its work. By doing nothing, we are still doing something. And I would argue we are doing quite a lot.

Headline PCE inflation remained elevated in August at 3.5 percent year over year, but it is down 3 percentage points from this time last year. About half of that drop is due to the volatile components of energy and food that, while basic necessities, they are typically excluded by economists in the so-called core inflation rate to give a more accurate assessment of the pace of disinflation and its likely path forward.

Well, core PCE inflation has also shown clear signs of progress, and the August monthly reading was its smallest month-over-month increase since 2020.

So, yes, a steady disinflation is under way, and I expect it to continue. My projection is that inflation will drop below 3 percent in 2024 and level out at our 2 percent target thereafter.

However, there can be challenges in assessing the trends in disinflation. For example, September’s CPI report came out modestly on the upside, driven by energy and housing.

Let me be clear about two things. First, we will not tolerate a reacceleration in prices. But second, I do not want to overreact to the normal month-to-month variability of prices. And for all the fancy techniques, the best way to separate a signal from noise remains to average data over several months. Of course, to do so, you need several months of data to start with, which, in turn, demands that, yes, we remain data-dependent but patient and cautious with the data.

Turning to the jobs picture, I do anticipate national unemployment to end the year at about 4 percent — just slightly above where we are now — and to increase slowly over the next year to peak at around 4.5 percent before heading back toward 4 percent in 2025. That is a rate in line with what economists call the natural rate of unemployment, or the theoretical level in which labor market conditions support stable inflation at 2 percent.

Now, that said, as you know, there are many factors that play into the calculation of the unemployment rate. For instance, we’ve seen recent months where, even as the economy added more jobs, the unemployment rate increased because more workers moved off the sidelines and back into the labor force. There are many other dynamics at play, too, such as technological changes or public policy issues, like child care or immigration, which directly impact employment.

And beyond the hard data, I also have to balance the soft data. For example, in my discussions with employers throughout the Third District, I hear that given how hard they’ve worked to find the workers they currently have, they are doing all they can to hold onto them.

So, to sum up the labor picture, let me say, simply, I do not expect mass layoffs.

do expect GDP gains to continue through the end of 2023, before pulling back slightly in 2024. But even as I foresee the rate of GDP growth moderating, I do not see it contracting. And, again, to put it simply, I do not anticipate a recession.

Look, this economy has been nothing if not unpredictable. It has proven itself unwilling to stick to traditional modeling and seems determined to not only bend some rules in one place, but to make up its own in another. However, as frustratingly unpredictable as it has been, it continues to move along.

And this has led me to the following thought: What has fundamentally changed in the economy from, say, 2018 or 2019? In 2018, inflation averaged 2 percent almost to the decimal point and was actually below target in 2019. Unemployment averaged below 4 percent for both years and was as low as 3.5 percent — both nationwide and in our respective states — while policy rates peaked below 2.5 percent.

Now, I’m not saying we’re going to be able to exactly replicate the prepandemic economy, but it is hard to find fundamental differences. Surely, I cannot and will not minimize the immense impacts of the pandemic on our lives and our families, nor the fact that for so many, the new normal still does not feel normal. From the cold lens of economics, I do not see underlying fundamental changes. I could also be wrong, and, trust me, that would not be the first time this economy has made me rethink some of the classic models. We just won’t know for sure until we have more data to look at over time.

And then, of course, there are the economic uncertainties — both national and global — against which we also must contend. The ongoing auto worker strike, among other labor actions. The restart of student loan payments. The potential of a government shutdown. Fast-changing events in response to the tragic attacks against Israel. Russia’s ongoing war against Ukraine. Each and every one deserves a close watch.

These are the broad economic signals we are picking up at the Philadelphia Fed, but I would note that the regional ones we follow are also pointing us forward.

First, while in the Philadelphia Fed’s most recent business outlook surveys, which survey manufacturing and nonmanufacturing firms in the Third District, month-over-month activity declined, the six-month outlooks for each remain optimistic for growth.

And we also publish a monthly summary metric of economic activity, the State Coincident Indexes. In New Jersey, the index is up slightly year over year through August, which shows generally positive conditions. However, the three-month number from June through August was down, and while both payroll employment and average hours worked in manufacturing increased during that time, so did the unemployment rate — though a good part of that increase can be explained as more residents moved back into the labor force.

And for those of you joining us from the western side of the Delaware River, Pennsylvania’s coincident index is up more than 4 percent year over year through August and 1.7 percent since June. Payroll employment was up, and the unemployment rate was down; however, the number of average hours worked in manufacturing decreased.

There are also promising signs in both states in terms of business formation. The number of applications, specifically, for high-propensity businesses — those expected to turn into firms with payroll — are remaining elevated compared with pre-pandemic levels. Again, a promising sign.

So, it is against this full backdrop that I have concluded that now is the time at which the policy rate can remain steady. But I can hear you ask: “How long will rates need to stay high.” Well, I simply cannot say at this moment. My forecasts are based on what we know as of late 2023. As time goes by, as adjustments are completed, and as we have more data and insights on the underlying trends, I may need to adjust my forecasts, and with them my time frames.

I can tell you three things about my views on future policy. First, I expect rates will need to stay high for a while.

Second, the data and what I hear from contacts and outreach will signal to me when the time comes to adjust policy either way. I really do not expect it, but if inflation were to rebound, I know I would not hesitate to support further rate increases as our objective to return inflation to target is, simply, not negotiable.

Third, I believe that a resolute, but patient, monetary policy stance will allow us to achieve the soft landing that we all wish for our economy.

Before I conclude and turn things over to Rick to kick off our Q&A, I do want to spend a moment on a topic that he and I recently discussed, and it’s something about which I know there is generally great interest: fintech. In fact, I understand there is discussion about NACD hosting a conference on fintech.

Well, last month, we at the Philadelphia Fed hosted our Seventh Annual Fintech Conference, which brought business and thought leaders together at the Bank for two days of real in-depth discussions. And I am extraordinarily proud of the fact that the Philadelphia Fed’s conference has emerged as one of the premier conferences on fintech, anywhere. Not that it’s a competition.

I had the pleasure of opening this year’s conference, which always puts a focus on shifts in the fintech landscape. Much of this year’s conference centered around developments in digital currencies and crypto — and, believe me, some of the discussions were a little, shall we say, “spirited.” However, my overarching point to attendees was the following: Regardless of one’s views, whether in favor of or against such currencies, our reality requires us to move from thinking in terms of “what if” to thinking about “what next.”

In many ways, we’re beyond the stage of thinking about crypto and digital currency and into the stage of having them as reality — just as AI has moved from being the stuff of science fiction to the stuff of everyday life. What is needed now is critical thinking about what is next. And we at the Federal Reserve, both here in Philadelphia and System-wide, are focused on being part of this discussion.

We are also focused on providing not just thought leadership but actionable leadership. For example, the Fed rolled out our new FedNow instant payment service platform in July. With FedNow, we will have a more nimble and responsive banking system.

To be sure, FedNow is not the first instant payment system — other systems, whether operated by individual banks or through third parties, have been operational for some time. But by allowing banks to interact with each other quickly and efficiently to ensure one customer’s payment becomes another’s deposit, we are fulfilling our role in providing a fair and equitable payment system.

Another area where the Fed is assuming a mantle of leadership is in quantum computing, or QC, which has the potential to revolutionize security and problem-solving methodologies throughout the banking and financial services industry. But that upside also comes with a real downside risk, should other not-so-friendly actors co-opt QC for their own purposes.

Right now, individual institutions and other central banks globally are expanding their own research in QC. But just as these institutions look to the Fed for economic leadership, so, too, are they looking to us for technological leadership. So, I am especially proud that this System-wide effort is being led from right here at the Philadelphia Fed.

I could go on and talk about fintech for much longer. After all, I’m actually an engineer more than I am an economist. But I know that Rick is interested in starting our conversation, and I am sure that many of you are ready to participate.

But one last thought on fintech — my answers today aren’t going to be generated by ChatGPT.

On that note, Rick, thanks for allowing me the time to set up our discussion, and let’s start with the Q&A.

[archived PDF of the above speech]
Economics-Watching: FRBSF Economic Letter

[from the Federal Reserve Bank of San Francisco]

Are Inflation Expectations Well Anchored in Mexico?

by Remy Beauregard, Jens H.E. Christensen, Eric Fischer and Simon Zhu

Price inflation has increased sharply since early 2021 in many countries, including Mexico. If sustained, high inflation in Mexico could raise questions about the ability of its central bank to bring inflation down to its 3% inflation target. However, analyzing the difference between market prices of nominal and inflation-indexed government bonds suggests investors’ long-term inflation expectations in Mexico are close to the central bank’s inflation target and are projected to remain so in coming years.


Inflation has risen substantially in many countries, including Mexico, since early 2021, driven in part by unique factors related to the COVID-19 pandemic. Sustained elevated inflation could be particularly challenging for inflation-targeting central banks in emerging economies given their higher macroeconomic uncertainty and greater sensitivity to external shocks compared with more developed economies. To examine this risk for a representative emerging economy affected by COVID-era disruptions in much the same way as the United States, we focus on Mexico, which has conducted monetary policy since 2002 according to an inflation targeting regime with a target rate for consumer price inflation of 3% per year.

In this Economic Letter, we assess whether recent higher inflation is leading businesses and households in Mexico to expect inflation to remain high over the long run. Specifically, we focus on what rising market-based measures of inflation compensation may imply about bond investors’ outlook for inflation. The rise in inflation compensation since spring 2021 could reflect three factors: an increase in investorsinflation expectations, an uptick in the premium investors demand for assuming inflation risk, or changes in other risk and liquidity premiums. We explore the relative importance of each of these factors using a novel dynamic term structure model of nominal and inflation-adjusted yields described in Beauregard et al. (2021, henceforth BCFZ). Overall, our results for five-year inflation expectations five years from now suggest Mexican bond investors’ long-term inflation expectations have been little affected by the recent rise in inflation. Instead, the rise in inflation compensation reflects a notable uptick in the inflation risk premium to the high end of its historical range. This suggests that, despite inflation expectations being little changed on average, some investors are particularly concerned about the risk that inflation will remain above expected levels.

The recent rise in Mexican inflation

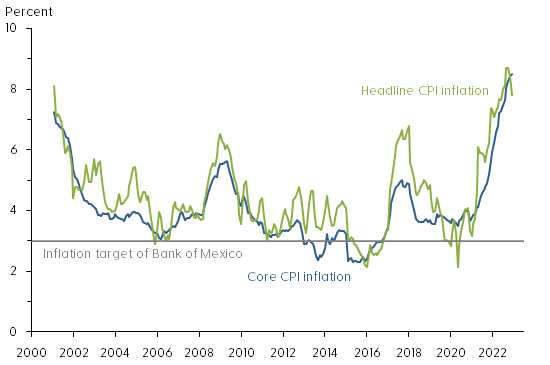
Figure 1 shows the year-over-year change in the Mexican consumer price index (CPI) measured both by the headline CPI (green line) and the more stable core CPI (blue line) that strips out volatile food and energy prices. Also shown with a horizontal gray line is the 3% inflation target of the nation’s central bank, the Bank of Mexico.

Figure 1: Mexican consumer price index inflation
Mexican consumer price index inflation
Source: Instituto Nacional de Estadística y Geografía.

We note that Mexican CPI inflation has averaged somewhat above the Bank of Mexico’s target since its adoption in 2002. More importantly, CPI inflation in Mexico appears to have become more volatile and somewhat higher over the past five years. Although previous research by De Pooter et al. (2014) found inflation expectations in Mexico to be well anchored, the significant global economic dislocations caused by the coronavirus pandemic and related inflationary pressures could impact inflation expectations of businesses and households.

To assess the persistence of the recent rise in Mexican inflation, we turn to financial market data, which reflect forward-looking expectations among a large and diverse group of investors and financial market participants. Specifically, we consider prices of conventional fixed-coupon bonds that pay a nominal interest rate and inflation-indexed bonds that pay a real interest rate because their cash flows are adjusted with the change in the CPI and therefore maintain their purchasing power. Both types of securities are issued and guaranteed by the Mexican government.

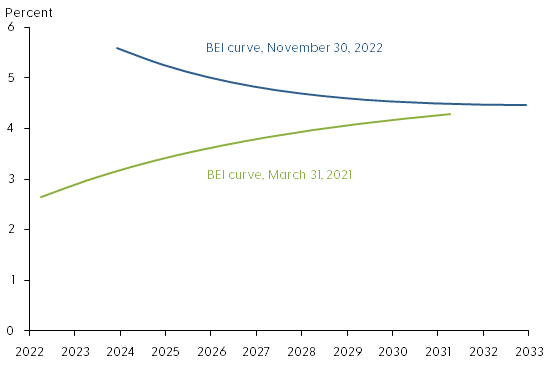
The difference between nominal and real yields for bonds of the same maturity is known as breakeven inflation (BEI). This represents a market-based measure of inflation compensation used to assess financial market participants’ inflation expectations. Figure 2 shows BEI rates at different maturities, meaning annual average rates of inflation compensation between now and maturity, from 1 to 10 years at the end of March 2021 (green line) and at the end of November 2022 (blue line). The slightly upward-sloping BEI curve of close to 3% in 2021 contrasts with the higher downward-sloping BEI curve in 2022.

Figure 2: BEI curves for 1-year to 10-year Mexican bond maturities
BEI curves for 1-year to 10-year Mexican bond maturities
Source: Authors’ calculations using bond prices from Bloomberg.

The increase for shorter maturities, the left end of the 2022 BEI curve, is closely tied to the current high level of inflation and suggests inflation may remain elevated for some time. In contrast, the increase at longer maturities, the right end of the 2022 BEI curve, suggests that investors’ longer-term inflation expectations may be drifting above the Bank of Mexico’s inflation target. To better understand the shape and sources of variation of the BEI curve we use a yield curve model.

A yield curve model of nominal and real yields

Market-based measures of inflation compensation such as BEI rates contain three components. First, they include the average CPI inflation rate expected by bond investors, which is the focus here. Second is an inflation risk premium to compensate investors for the uncertainty of future inflation. This premium is embedded in nominal yields that provide no inflation protection. Third is the difference in relative market liquidity between standard fixed-coupon and inflation-indexed bonds. As discussed in BCFZ, both of these types of Mexican bonds are less liquid than U.S. Treasuries, and their prices therefore contain a discount to compensate investors for their liquidity risk. Neither the inflation risk premium nor the liquidity premiums are directly observable and must therefore be estimated.

To adjust for these challenges, we first use the nominal and real yields model developed in BCFZ to identify liquidity premiums in standard fixed-coupon and inflation-indexed bond prices as a function of the time since issuance and the remaining time to maturity. The time since issuance serves as a proxy for declining liquidity as, over time, a larger fraction of bonds gets locked into buy-and-hold strategies. We refer to the observed BEI net of estimated liquidity premiums as the adjusted BEI. In a second step, we then separate adjusted BEI into components representing investorsinflation expectations using a formula based on the absence of bond market arbitrage opportunities and the residual inflation risk premium.

Results

To assess whether investorsinflation outlook has fundamentally changed, we follow De Pooter et al. (2014) and examine the five-year forward BEI rate that starts five years ahead, denoted 5yr5yr BEI. This is a horizon sufficiently long into the future that most transitory shocks to the economy can be expected to have vanished. Hence, the embedded inflation expectations are presumably less affected by current high inflation and pandemic-related transitory conditions and can therefore speak to the question about the anchoring of inflation expectations in Mexico.

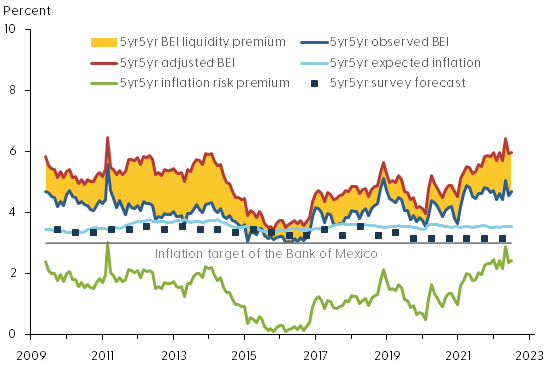
Figure 3 shows the breakdown of 5yr5yr BEI into its various components according to our model. The dark blue line is the observed BEI, and the red line is the estimated adjusted BEI without liquidity risk premiums or other residual disturbances. The difference between these two measures of BEI—the yellow shaded area—represents the model’s estimate of the net liquidity premium or distortion of the observed BEI series due to risk premiums in both nominal and inflation-indexed bond prices. The adjusted BEI is entirely above the observed BEI, suggesting the liquidity risk distortions are systematically larger in the inflation-indexed bond prices, consistent with similar evidence from the U.S. Treasury market (Andreasen and Christensen 2016). Note that the net BEI liquidity premium widened around the financial turmoil in spring 2020 at the start of the pandemic and remains elevated.

Figure 3: Components of 5yr5yr breakeven inflation for Mexico
Components of 5yr5yr breakeven inflation for Mexico
Source: Survey forecasts from Consensus Economics and authors’ calculations using bond prices from Bloomberg.

The model also allows us to break down the adjusted BEI into an expected inflation component (light blue line) and the residual inflation risk premium (green line). Also shown is the Bank of Mexico’s 3% inflation target (gray horizontal line). For comparison, the figure also shows the 5yr5yr expected CPI inflation in Mexico reported semiannually in the Consensus Forecasts surveys (dark blue squares). We note that both observed and adjusted BEI have trended higher since the start of the pandemic in early 2020. Importantly, the breakdown indicates that long-term expected inflation in Mexico has remained stable, slightly above the 3% inflation target. As a result, the increase in BEI can be attributed to the inflation risk premium, which is at the high end of its historical range towards the end of our sample. Given the elevated levels of current inflation, this suggests some investors are concerned that inflation could remain elevated for longer than currently anticipated.

This raises the question of whether long-term inflation expectations in Mexico are likely to remain anchored near their current level going forward. To assess this risk, we simulate 10,000-factor paths over a three-year horizon using the estimated factors and factor dynamics as of November 2022—that is, the simulations are conditioned on the shapes of the nominal and real yield curves and investors’ embedded forward-looking expectations as of November 2022. These simulated factor paths are then converted into forecasts of 5yr5yr expected inflation. Figure 4 shows the median projection (solid green line) and the 5th and 95th percentile values (dashed green lines) for the simulated 5yr5yr expected inflation over a three-year horizon.

Figure 4: Three-year projections of 5yr5yr expected inflation, Mexico
Three-year projections of 5yr5yr expected inflation, Mexico
Source: Authors’ calculations.

Our model projections indicate that long-term inflation expectations are likely to deviate only modestly from their current level, consistent with the variation of the historical estimates back to 2009. Overall, our findings represent tangible evidence that long-term inflation expectations remain well-anchored in Mexico despite the recent rise in inflation.

Conclusion

Global inflation pressures in the aftermath of the pandemic have raised fears about a sustained increase in the level of inflation around the world, which could be particularly challenging for developing economies with monetary policy guided by an inflation target. In this Letter, to assess this risk for a major emerging economy with an established inflation target, we examine the variation in Mexico’s nominal and inflation-indexed bond prices, while accounting for their respective liquidity risk premiums. This allows us to estimate Mexican bond investors’ inflation expectations and associated risk premiums. The results reveal that the inflation risk premium has pushed up Mexican BEI rates in recent years, while investors’ long-term inflation expectations have remained stable near the Bank of Mexico’s inflation target despite the rise in inflation.

The policy path needed to keep inflation expectations anchored in a situation with highly elevated inflation may involve tradeoffs. The Bank of Mexico responded early and forcefully to inflation pressures starting in June 2021 and has indicated further tightening of the policy rate would likely be appropriate to bring inflation back down to target over the medium term. This could lower economic growth in Mexico in both 2022 and 2023. On the other hand, history shows that it may be difficult and costly to reverse extended departures from announced inflation targets. Thus, it will be important for central banks with inflation-targeting frameworks to monitor measures of long-term inflation expectations in the current situation.

Remy Beauregard
Economics Ph.D. student, University of California at Davis

Jens H.E. Christensen
Research Advisor, Economic Research Department, Federal Reserve Bank of San Francisco

Eric Fischer
Financial modeling and quantitative analytics principal, Markets Group, Federal Reserve Bank of New York

Simon Zhu
Economics Ph.D. student, University of Texas at Austin

References

Andreasen, Martin M. and Jens H.E. Christensen. 2016. “TIPS Liquidity and the Outlook for Inflation.” [PDFFRBSF Economic Letter 2016-35 (November 21).

Beauregard, Remy, Jens H.E. Christensen, Eric Fischer, and Simon Zhu. 2021. “Inflation Expectations and Risk Premia in Emerging Bond Markets: Evidence from Mexico.” [PDF] FRB San Francisco Working Paper 2021-08.

De Pooter, Michiel, Patrice Robitaille, Ian Walker, and Michael Zdinak. 2014. “Are Long-Term Inflation Expectations Well Anchored in Brazil, Chile, and Mexico?” [PDFInternational Journal of Central Banking 10(2), pp. 337–400.

[Archived PDF]

World-Watching: Germany Bundesbank: What Moves Markets?

[Deutsche Bundesbank discussion paper 16/2022 by Mark Kerssenfischer & Maik Schmeling]

Non-technical summary

Research question

A key question in the macro-finance literature concerns the drivers of asset prices. Are asset prices mainly driven by news, or by changes in sentiment and other factors unrelated to economic fundamentals? In most asset pricing models, news play a dominant role. But in empirical investigations, the explanatory power of news is often quite low.

Contribution

We study the explanatory power of news by building a large, time-stamped event database covering a wealth of news related to the macroeconomy, including macroeconomic data releases, central bank announcements, bond auctions, election results, sovereign rating downgrades, and natural catastrophes. We combine this event database with high-frequency stock price and bond yield changes, both for the U.S. and the euro area, going back to 2002.

Results

We find that roughly half of all stock and bond price movements in the U.S. and euro area occur in tight windows around clearly identifiable news and in this sense can be explained by those news. On the positive side, this share is much higher than most previous studies found. However, our results still ascribe a large role to return variation that cannot be linked to news about economic fundamentals.

Read the paper [archived PDF].

IMF, ECB and Others Give 2022 Economic Outlook Today

from the World Economic Forum Davos Agenda:

Today the IMF, European Central Bank, and global economic leaders discussed the future of the economy at the “Global Economic Outlook” session at Davos Agenda 2022.

Inflation, global economic recovery and COVID-19 impacts are discussed.

Please find selected quotes below. View the full session here.

Christine Lagarde, President, European Central Bank:

“In Europe, we are not seeing inflation spiral out of control. We assume energy prices will stabilize from the middle of 2022, bottlenecks will also stabilize in 2022 and gradually, inflation numbers will decline.”

“When I look at the labor market, we are not experiencing anything like The Great Resignation, and our employment participation numbers are getting very close to the pre-pandemic level.”

“In Europe we are unlikely to face the kind of inflation increases that the U.S. market has faced.”

“More recently, we have learnt the lesson of humility–the ECB, IMF, OECD and others all underestimated the recovery, the employment participation and, obviously, inflation.”

Kristalina Georgieva, Managing Director, International Monetary Fund (IMF):

“The response to the pandemic crisis has been anything but orthodox— in a highly coordinated manner both central banks and finance authorities have prevented the world falling into yet another great depression.”

“If I were to offer policy makers a new year’s resolution, it would policy flexibility.”

“In low-income countries, 60% are in either debt distress or in danger of debt distress–more than twice as many as in 2015.”

Haruhiko Kuroda (黒田 東彦), Governor, Bank of Japan:

Japan response to the pandemic has been relatively successful, however, the pandemic has had a significant, negative impact on Japan’s economy.”

“Unlike U.S. or Europe, we have to continue extremely accommodative, easy monetary policy for the time being. We expect the inflation rate in 2022 and 2023 to be around 1 percent still.”

Paulo Guedes, Minister of Economy, Ministry of Economy of Brazil:

Central banks are sleeping at the wheel–inflation will be a real problem very soon for the western world.”

“More than 3 million new jobs were created in 2021 and the government has assisted 68 million Brazilians with direct income transfers.”

Sri Mulyani Indrawati, Minister of Finance, Ministry of Finance of Indonesia

“We see a strong recovery in the Indonesian economy in 2022, and to build on this we are expecting more than 1% of additional GDP growth from a series of recent reforms.”

Indonesia is the largest economy in the ASEAN region, but it is vulnerable to a dependence on commodities–the emphasis now is on value-added activities.”

About the Davos Agenda 2022

For over 50 years, the World Economic Forum has been the international organization for public-private cooperation. The Davos Agenda 2022 is the focal point at the start of the year for leaders to share their outlook, insights and plans relating to the most urgent global issues. The meeting will provide a platform to accelerate the partnerships needed to tackle shared challenges and shape a more sustainable and inclusive future. Learn more about the program and view sessions live and on demand.

Economy Watching: Philadelphia Fed

from the Federal Reserve Bank of Philadelphia:

Fed President Patrick Harker Says It Will “Soon” Be Time to Taper Asset Purchases

Philadelphia Fed President Patrick Harker told a virtual audience at the Prosperity Caucus in Washington, D.C., that the asset purchases once necessary during the acute phase of the COVID-19 pandemic are no longer effective as a tool for supporting the economy. He also said the U.S. economy created millions of jobs in recent months, but “we just can’t fill them.”

Economic Outlook: Growth Despite Constraints

Good evening! Thanks so much for having me. I understand that when this group meets in person there is usually pizza involved — so I intend to collect on that debt next time we do this in the flesh.

I plan to offer a few remarks about the state of the national economy and the path of Federal Reserve policy. Then we can move to our Q&A, which I’m really looking forward to.

But before I do that, I need to give you the standard Fed disclaimer: The views I express today are my own and do not necessarily reflect those of anyone else on the Federal Open Market Committee (FOMC) or in the Federal Reserve System.

Fed Structure

I know this group encompasses a very diverse crowd — we have everyone from House staffers to Senate staffers here. So, just in case anyone doesn’t know, I want to begin by giving you a very brief explanation of what, exactly, a regional Federal Reserve Bank is. Our nation’s central bank, after all, is quite unusual — unique, even — in its design.

The configuration of the Federal Reserve System — a central bank with a decentralized structure — owes its existence to the 1913 Federal Reserve Act. It is something of a testament to old-fashioned American compromise and reflects the unique demands of the United States and our economy.

The System consists of a Board of Governors, which sits in Washington, and 12 regional Banks around the country.

The Board seats seven governors, including the Chair. Each regional Bank has its own president and board of directors, which is made up of business, banking, and community leaders from the area. Fundamentally, this provides the Fed with a perspective — within each District — of the sectors and issues that make the region tick. Mine is the Third District, which encompasses eastern Pennsylvania, South Jersey, and the state of Delaware. We’re the smallest District geographically, but I like to think we punch above our weight.

The FOMC, which is responsible for monetary policy, is composed of the Fed’s governors and regional Bank presidents. Regional Bank presidents don’t always get to vote. Most of us rotate into a voting position every three years, but the governors always vote, as does the president of the New York Fed. New York, owing to the presence of Wall Street, enjoys something of a “first among equals” status within the System.

While the rest of us don’t always vote, we do always represent our Districts and play a part in the discussion. If you were at a normal FOMC meeting, you probably wouldn’t be able to tell a voting member until the end of the meeting when it’s time to raise hands. Everybody contributes.

The Fed’s decentralized nature is, in my view, a unique strength. We’re making national policy, but we’re doing it for an enormous country, and the averages of economic data can obscure realities on the ground. Conditions look very different in Philadelphia, Dover, or Washington than they do in Dallas, Salt Lake City, or Honolulu. This System gives a voice to a range of localities and sectors. It also allows us to focus on regional issues within each Bank’s District.

The United States has a unique set of needs. It’s easy to forget that we’re an outlier because we’re such a massive country: Only Russia and Canada are bigger geographically, only China and India have larger populations, and no one country has a bigger economy, at least for now. And that economy is vast, spreading across sectors and natural resources in a way that is not typical of other nations.

So, it makes sense that we have a System that feeds back information from around the country.

The State of the Economy

And what that information is telling us is that, for the past 18 months, the economy has moved in tandem with the waxing and waning of the COVID-19 pandemic. During periods when case rates and hospitalizations have declined, the economy has surged as American consumers have voted with their wallets. When COVID-19 risks abate, more Americans dine out at restaurants, check in to hotels, and fill up airplanes. Those are important categories of spending in a country where consumption makes up about 70 percent of total economic activity. In the second quarter of this year, for instance, GDP grew at a very healthy annualized rate of around 6.7 percent as case rates plummeted.

And, of course, the opposite occurs during periods when the virus spikes. When the Delta variant of COVID-19 erupted, fomenting the country’s fourth major wave of the pandemic, things started moving sideways. Consumer confidence tanked, and large industries like hospitality and leisure stagnated at best. So for this quarter, we can expect growth to come in at an annualized rate of around 3 percent, a sharp slowdown from earlier this year. 

But there are reasons to be sanguine that the country’s recovery from this wave of COVID-19 may prove more durable than in the past and that we can avoid a fifth wave. And that is because more than half of the country is fully vaccinated. Getting more shots into arms will save lives and aid the recovery by reducing the size and severity of future spikes. The Delta variant has also concentrated minds: It seems to have not only persuaded more Americans to get shots on their own, but it also pushed more corporations and institutions to mandate their employees to get vaccinated. That is cause for optimism.

Filling me with less optimism is the persistent constraints the economy is operating under.

The COVID-19 pandemic has revealed how fragile many of our supply chains are. We’re now experiencing shortages of crucial parts like computer chips, which has hobbled not only the production of cars and trucks, but also comparatively smaller durable goods like home appliances. My recent experience attempting to purchase a printer — there were essentially none at my local electronics store — testifies to that. And good luck trying to find a new washing machine or dishwasher.

These supply chain constraints are rippling through the entire economy. Manufacturers in our region have reported having to curtail production because of difficulties securing raw materials. We’re also seeing low inventory of everything from shoes to backpacks to even chicken wings, which is a particularly troubling development as the NFL season is picking up. Unfortunately, there are indications that these constraints could persist for a couple of more years.

There’s another input lacking in supply as well, further constraining the economy: labor. It isn’t true, as was widely reported, that the economy only created 194,000 jobs in September. In reality, the U.S. economy has created many millions of jobs in recent months — we just can’t fill them. Indeed, job openings are at record highs, hitting nearly 10.5 million at the end of August. Simultaneously, more people are quitting their jobs, and the rate at which open positions are being filled is continuing to slow.

It seems that a combination of factors — trouble accessing childcare or eldercare, lingering fears about the virus, the rise in equities and home values spurring people to retire, and perhaps a general revaluation of life choices — is persuading a lot of Americans to stay on the sidelines even as the economy has reopened. And notably, the elimination of extra federal unemployment benefits has not — at least not yet — appeared to nudge people back into the workforce. I do expect that will change eventually and especially as other forbearance programs run out.

So, where does all of this leave us? For 2021, I would expect GDP growth to come in around 5.5 percent, which is a downward revision from before Delta took hold. Growth will then moderate to about 3.5 percent in 2022, and 2.5 percent in 2023. Inflation, meanwhile, should come in around 4 percent for 2021, though I do see upside risk here. After that, our modal forecast — that is, the average of all of our forecasts — calls for inflation of a bit over 2 percent for 2022 and right at 2 percent in 2023.

Fed Policy

In terms of monetary policy, I am in the camp that believes it will soon be time to begin slowly and methodically — frankly, boringly — taper our $120 billion in monthly purchases of Treasury bills and mortgage-backed securities. This comes down to the efficacy of these purchases as a tool.

They were necessary to keep markets functioning during the acute phase of the crisis. But to the extent that we are still dealing with a labor force issue, the problem lies on the supply side, not with demand. You can’t go into a restaurant or drive down a commercial strip without noticing a sea of “Help Wanted” signs. Asset purchases aren’t doing much — or anything — to ameliorate that.

After we taper our asset purchases, we can begin to think about raising the federal funds rate. But I wouldn’t expect any hikes to interest rates until late next year or early 2023, unless the inflation picture changes dramatically.

Conclusion

Given the strong headwinds facing the economy, it is a testament to its underlying strength that growth continues at a relatively robust pace. That is a tribute, as always, to the ingenuity and tenacity of our people, especially in the face of huge challenges.

Thank you very much again for having me. And now let’s move on to questions.