Federal Reserve policymakers need current information about economic conditions to make well-informed monetary policy decisions. But hard data, such as GDP and the unemployment rate, is released with a significant lag, making it difficult to get a precise, real-time read on the economy, especially during times of rapid change.
Hard data is based on precise quantitative measurements, such as sales figures or the specific prices firms are charging. By contrast, soft data is qualitative, focusing on trends, expectations, and sentiment around economic activity. And while hard data looks backward, soft data from the regional surveys can look forward—providing important information about expectations for the future and emerging trends.
The surveys are sent to over 300 business executives and managers at firms across industries during the first week of every month. While about two-thirds of participating firms have 100 or fewer employees, some have hundreds or thousands of workers.
Leaders at the firms fill out a short questionnaire asking if business activity has increased, decreased, or stayed the same compared to the prior month. The surveys ask about indicators such as prices–yielding insights into inflationary pressures–as well as employment, orders, and capital spending. Respondents answer questions about how they expect these indicators to change over the next six months, offering a forward-looking perspective on the economy’s trajectory.
From the responses, New York Fed researchers construct diffusion indexes by calculating the difference between the percentage of firms reporting increased activity and those reporting decreased activity. Positive values indicate that more firms say activity increased than decreased, suggesting activity expanded over the month. Higher positive values indicate stronger growth, while lower negative values indicate stronger declines.
The surveys include local businesses, like restaurants and car dealerships, as well as firms with national and global reach, such as software manufacturers and shipping enterprises. As a result, the economic indicators derived from the surveys are often early predictors of national economic patterns, frequently aligning with hard data released later.
In addition to providing data to track economic conditions, the regional surveys also provide a channel to hear directly from local business leaders. Every month, survey respondents are asked for their comments, offering the opportunity for businesses to share their thoughts, concerns, and experiences with the New York Fed. This helps researchers and policymakers understand how businesses are being affected by economic conditions.
The surveys act as one of the bridges between the New York Fed and the business community, ensuring the voices of regional businesses are considered in economic assessments and policy discussions as well as enhancing the ability of policymakers to make informed decisions to respond effectively to economic challenges.
Executives, owners, or managers of businesses in New York, northern New Jersey, or Fairfield County, Conn., interested in participating in the New York Fed’s monthly business surveys can find more information here. The next survey results will be released on Oct. 15 and 16.
Kicking off a new CGD series of policy proposals to inform the European Union’s upcoming development agenda, Mikaela Gavas and W. Gyude Moore suggest a reset of the EU’s international relations narrative. Explore their ideas for how the EU can position itself as a global development player while staying true to its values and focusing on the common good.
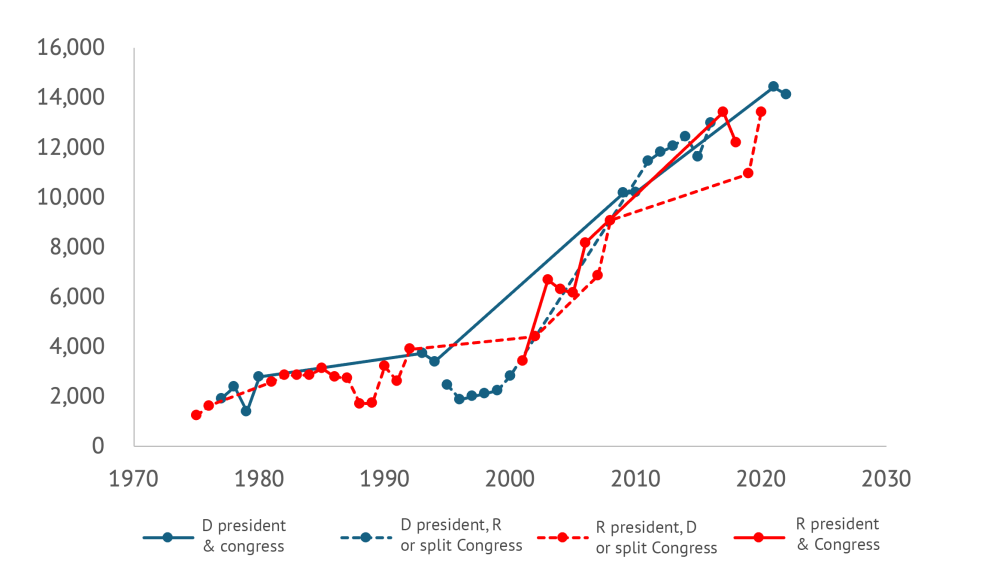
The same applies to aid flows. The figure below shows data on total aid disbursements from the US depending on who is in power: the solid blue line is Democratic control of the presidency and both branches of Congress, the blue dashed line is Democratic control of the presidency and one or neither branch, the solid red line is Republican control of the presidency and both chambers, and the red dashed line is control of the presidency and one or neither chamber. There’s only one data point for each year, of course, but the lines connect between them. The broad picture strongly suggests the trend matters more than who is in power (indeed, remember the Surprise Party?).
Figure 1: US aid disbursements by party control (Current $m)
The potential good news from this is that despite substantive disagreements over topics including the Mexico City Policy, bipartisan cooperation on aid might still be more possible than it might appear from a close-up perspective in the midst of partisan rancor. To repeat the bad news: much of the recent bipartisan movement on foreign economic policy has been to the detriment of developing countries. And there is certainly some talk of sweeping changes, including cuts, that might mean the past is no guide. But perhaps there still space for elements of a positive agenda around aid for the legislative sessions of next year, one that could appeal to at least some people on both sides of the aisle. Examples might include:
Advancing localization: Spending more US aid finance in recipient countries rather than on US contractors has been a hallmark of Samantha Power’s tenure at USAID. But it has Republican antecedents. The Trump administration followed a localization strategy for PEPFAR that significantly increased the number of local partners and a New Partnerships Initiative at USAID designed in part to do the same. And in 2021, US SenatorsMarco Rubio (R–FL) and Tim Kaine (D–VA) introduced legislation to reduce red tape for local organizations seeking USAID funds. It would be great to see further cooperation on ensuring more development dollars are actually spent in developing countries.
Country focus: All else even somewhat equal, a dollar of foreign assistance simply has a larger impact in poorer countries. The logic that richer countries should be able to look after themselves was a justification for the Trump administration’s “Journey to Self-Reliance”—a philosophy dedicated toward “ending the need for aid.” The Biden administration has continued to produce the “country roadmaps” designed to chart the journey. It would be great to see bipartisan efforts to focus grant resources in particular where they’ll have the greatest impact—in the poorest countries.
Sovereign lending and guarantees: While grants should be focused on poorer countries, loans could be an effective and comparatively low-cost tool to support wealthier countries. The recently passed Ukraineaid package provided resources in the form of partially forgivable loans, and senior Republicans have been pushing the model more widely. More lending and guarantees could be a powerful tool to support infrastructure rollout in middle-income countries. And strengthening the US sovereign loan guarantee program could back development and national security goals at a considerably lower cost than grant-based programs.
MCC reform: The Millennium Challenge Corporation, created during the George W. Bush administration, is running into pipeline challenges—and appropriators have clawed back funding in response. That’s a shame. It is a small but effective aid agency providing resources for development priorities including infrastructure and working with client countries to help them deliver—in fact, it’s a model of successful localization. MCC faces spending challenges in part because it hasn’t increased the size of individual country operations, limits repeat operations, and can only work in countries that pass its “scorecard” of development indicators. The agency wants to address its partner problem by working in richer countries. That’s a sad way to achieve impact and goes against the bipartisan principle that richer developing countries should be weaned off aid flows, not given more. Altering the size of compacts, allowing more repeat compacts, and moving away from a scorecard model towards a model of reward for reform—a specific set of policy changes that need to be completed before funds start flowing—would be a far more effective approach.
Fighting malaria: In the 1958 State of the Union, PresidentEisenhower said that the US would lead a global effort to eradicate malaria. The time and the tools were not right then, but today there is far greater hope for rapid progress against the disease. George Bush created the President’s Malaria Initiative in 2005, and the US has been a vital contributor to the global fight against the parasite since then. With the arrival of new vaccines in the past couple of years, we could accelerate progress and save hundreds of thousands of children’s lives each year. And with better vaccines, we could move even faster. PEPFAR, the US initiative to provide HIV drugs, has transformed the battle against AIDS worldwide. A similar bipartisan initiative could achieve as much with malaria.
Transparency: Both parties have shown commitment to increasing the transparency of aid finance including around subawards and indirect cost rate data. It would be great if there was a bipartisan consensus on simply publishing all aid contracts.
Beyond aid, the African Growth and Opportunity Act was first passed during the Clinton administration, renewed during the Bush administration and then again under the Obama administration. A bipartisan proposal to renew the trade package once more was launched in the Senate in April this year. Perhaps AGOA could be made even bigger and better. Even amidst partisan rancor, there is plenty a Congress and administration could do to improve US relations with and support to low- and middle-income countries next year.
Undoing Gender Inequality Traps in the Financial Sector: The Case of Colombia
by Mayra Buvinic and Alba Loureiro, July 9, 2024 (CGD Blog Post)
Gender data is needed to gauge the extent to which financial services include and benefit women. However, sex-disaggregated data that tracks access to and use of financial services is still hard to come by, and it is especially rare to have country-level data that captures the universe of financial sector providers (FSPs) and is published on a regular basis.
A notable exception is Colombia, where Banca de Oportunidades (BdO), a public sector technical assistance and advocacy platform, compiles in a centralized data platform anonymized data from all FSPs in partnership with Colombia’s Superintendency of Banks. The 2023 edition, the 13th annual publication, reports on 15 million transactions, 60 percent of them monetary, from the universe of banks, credit and savings cooperatives, microfinance institutions, and fintechs. The report tells a sobering story worth highlighting of the trajectory of women’s financial inclusion because it mirrors much of what we know [archived PDF] about the constraints women face having access to financial services in low- and middle-income countries. The report’s numbers [archived PDF] suggest that:
Expanding access is not enough
Despite almost universal access to financial products, gender gaps persist. In 2023, 19 out of every 20 adult Colombians (or 94.6 percent) reported access to at least one financial product or service. However, women faced less favorable conditions (see below), underscoring that mere access is insufficient.
Gender gaps are evident in both savings and credit
In 2023, women had 6.5 and 3.7 percentage points (pp) lower access to savings and credit, respectively, than men. While women’s access to savings increased over time–from 75 percent in 2018 to 90.4 percent in 2023–the gender gap widened (from 4.3 pp to 6.5 pp). In the same period, the gender gap in credit narrowed slightly (from 4.8 pp to 3.7 pp) but both men’s and women’s access to credit decreased–for women from 37.7 percent in 2018 to 33.4 percent in 2023.
Women face access to credit in less favorable conditions than men
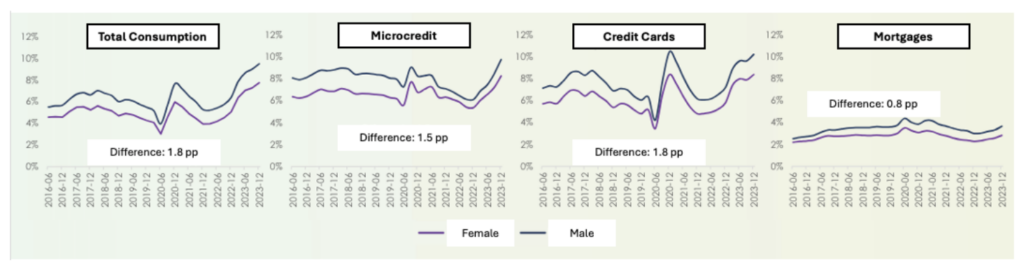
Interest rates are higher for women clients across all loan types, and highest for microcredit–with a 5.4 percent gender gap–which women access more than men. In 2023, women accessed 1,029 million and men accessed 857,000 microcredit loans. More men than women accessed commercial loans (20,000 versus 14,000 loans) while housing loans went equally to women and men.
Paradoxically, these less favorable conditions coexist with women exhibiting lower credit risks than men
Women have better repayment rates than men across loan types (Figure 1). Women also perform better across insurance products, except for microinsurance, showing lower accident rates. However, female clients have 13.8 pp lower access to insurance products than men.
Figure 1: Total Repayment Rates, Overdue More Than 30 Days.
Source: The graphic was extracted from the Financial Inclusion PowerPoint (Paola Arias and Jaime Rodriguez, 4 June, 2024) [archived PDF], and the labels were translated from Spanish.
The data implies that women’s good financial behavior is penalized rather than prized, with higher interest rates and lower access to financial products
Rationing credit and other financial services to women perpetuates ‘gender inequality traps’ leading to further rationing
It all starts with women having fewer assets to use as collateral and lower earnings than men (a commonplace fact across financial markets everywhere) which leads them to qualify for smaller loans. In turn, this results in women having less access to credit to increase earnings because of the high costs to lenders of serving customers with small loans, resulting in even lower earnings.
Gender biases that affect the supply and demand for credit reinforce this vicious cycle
On the supply side, there are cognitive and perceptual biases (the latter detected by eye-tracking) from financial sector providers–male potential borrowers are ‘ex-ante’ perceived as having higher earnings than similar women. And female bank agents are stricter at evaluating female clients than male clients.
On the demand side, the incorrect assumption that women are higher credit risks than men is reinforced by female clients’ own lower self-confidence and greater self-exclusion from financial services: women do not apply for credit because they anticipate they will be rejected because they have lower earnings.
Not surprisingly perhaps, women in Colombia score lower than men in a financial health indicator–with an average score of 4.9 for women and 5.6 for men measured in a 0 to10 scale (scored by BdO using data from the 2022 edition of the survey).
To overcome these gender inequality traps, only a combination of strategies will work
Solutions must address both demand– and supply-side constraints and include:
Increase women’s self-confidence and combat their self-exclusion from financial services with credit ‘plus’ interventions that include ‘soft skills’ training.
Provide customized products that fit women’s needs, including importantly insurance and microinsurance that respond to women’s greater need for mitigating (family) risks.
Combat supply-side biases that lead to inefficiencies and exclusions, including incentives to financial sector providers to reach women with financial services.
For the above, collect and publish gender data, but data that does not end up sitting on a shelf gathering dust; data that instead is used to make management decisions, which underscores the role of public sector institutions such as BdO in collaborating with and incentivizing financial sector providers, and in measuring, tracking, and reporting progress in financial inclusion.
Fortunately, there is a growing wealth of research that backs up the solutions suggested above. But there is still an important practical research agenda ahead:
First is reaching the poorest and excluded with financial services that they may need. In the case of Colombia, this includes indigenous and Afro-descendent populations in geographically distant regions of the country. This requires building further granularity in the financial inclusion data, following guidelines of intersectionality data in development.
There is substantial research on demand-side constraints in women’s access to financial services. There is comparatively little research on supply-side gender biases and solutions to these biases that can be scaled.
Lastly, there is the task of developing financial health indicators that can be easily and widely used disaggregated by gender and other demographic features to monitor an important development outcome from increasing financial access to all.
Disclaimer
CGD blog posts reflect the views of the authors, drawing on prior research and experience in their areas of expertise. CGD is a nonpartisan, independent organization and does not take institutional positions.
“Globalization” is here. Signified by an increasingly close economic interconnection that has led to profound political and social change worldwide, the process seems irreversible. In this book, however, Harold James provides a sobering historical perspective, exploring the circumstances in which the globally integrated world of an earlier era broke down under the pressure of unexpected events.
James examines one of the great historical nightmares of the twentieth century: the collapse of globalism in the Great Depression. Analyzing this collapse in terms of three main components of global economics—capital flows, trade and international migration—James argues that it was not simply a consequence of the strains of World War I, but resulted from the interplay of resentments against all these elements of mobility, as well as from the policies and institutions designed to assuage the threats of globalism.
Could it happen again? There are significant parallels today: highly integrated systems are inherently vulnerable to collapse, and world financial markets are vulnerable and unstable.
While James does not foresee another Great Depression, his book provides a cautionary tale in which institutions meant to save the world from the consequences of globalization—think WTO and IMF, in our own time—ended by destroying both prosperity and peace.
PresidentTrump’s speech here at the World Economic Forum went over relatively well. That’s partly because Davos is a conclave of business executives, and they like Trump’s pro-business message. But mostly, the president’s reception was a testament to the fact that he and what he represents are no longer unusual or exceptional. Look around the world and you will see: Trump and Trumpism have become normalized.
Davos was once the place where countries clamored to demonstrate their commitment to opening up their economies and societies. After all, these forces were producing global growth and lifting hundreds of millions out of poverty. Every year, a different nation would become the star of the forum, usually with a celebrated finance minister who was seen as the architect of a boom. The United States was the most energetic promoter of these twin ideas of economic openness and political freedom.
Today, Davos feels very different. Despite the fact that, throughout the world, growth remains solid and countries are moving ahead, the tenor of the times has changed. Where globalization was once the main topic, today it is the populist backlash to it. Where once there was a firm conviction about the way of the future, today there is uncertainty and unease.
This is not simply atmospherics and rhetoric. Ruchir Sharma of Morgan Stanley Investment Management points out that since 2008, we have entered a phase of “deglobalization.” Global trade, which rose almost uninterruptedly since the 1970s, has stagnated, while capital flows have fallen. Net migration flows from poor countries to rich ones have also dropped. In 2018, net migration to the United States hit its lowest point in a decade.
It’s important not to exaggerate the backlash to globalization.
As a 2019 report by DHL demonstrates, globalization is still strong and, by some measures, continues to expand. People still want to trade, travel and transact across the world. But in government policy, where economic logic once trumped politics, today it is often the reverse. EconomistNouriel Roubini argues that the cumulative result of all these measures — protecting local industries, subsidizing national champions, restricting immigration — is to sap growth. “It means slower growth, fewer jobs, less efficient economies,” he told me recently. We’ve seen it happen many times in the past, not least in India, which suffered decades of stagnation as a result of protectionist policies, and we will see the impact in years to come.
This phase of deglobalization is being steered from the top. The world’s leading nations are, as always, the agenda-setters. The example of China, which has shielded some of its markets and still grown rapidly, has made a deep impression on much of the world. Probably deeper still is the example of the planet’s greatest champion of liberty and openness, the United States, which now has a president who calls for managed trade, more limited immigration and protectionist measures. At Davos, Trump invited every nation to follow his example. More and more are complying.
Students should sense that while history does not repeat itself, it sometimes rhymes and this is a major danger. It also might imply that coping with climate change will be all the harder because American-led unilateralism everywhere would mean world policy paralysis.
“We’ve had a time of red-hot housing market all over the country… Shelter inflation is going to remain high for some time. We’re looking for it to come down, but it’s not exactly clear when that will happen. Hope for the best, plan for the worst.”
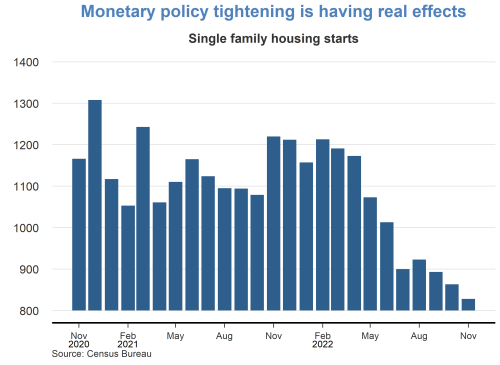
The rapid run-up of shelter costs—both house prices and rents—during the recovery from the pandemic has raised questions about how inflation pressures might affect housing affordability. Since March 2022, the Federal Reserve has rapidly lifted its federal funds rate target from near zero to over 4%, and policymakers have signaled that they are open to keeping the monetary policy stance sufficiently restrictive to return inflation to the longer-run goal of 2% on average. The tightened financial conditions following those policy changes, especially the surge in mortgageinterest rates, have helped cool house price growth. However, rentinflation remains elevated.
This Economic Letter examines the effectiveness of monetary policy tightening for reducing rentinflation. We estimate that, during the period from 1988 to 2019, a policy tightening equivalent to a 1 percentage point increase in the federal funds rate can reduce rentinflation—measured by 12-month percentage changes in the personal consumption expenditures (PCE)housing price index—by about 3.2 percentage points, but the full impact takes about 2½ years to materialize. Based on housing costs’ share in total PCE, this translates to a reduction in headline PCEinflation of about 0.5 percentage point over the same time horizon.
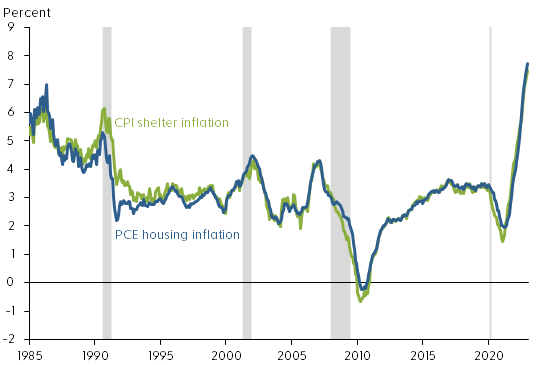
Rentinflation also accelerated during the pandemic period. Figure 1 shows that rentinflation—measured using 12-month changes in the PCEhousing price index and including rents for tenant-occupied housing and imputed rents for owner-occupied housing—rose from a low point of about 2% in early 2021 to 7.7% by December 2022, the highest level since 1986. During the same period, rentinflation measured by 12-month changes in the shelter component of the consumer price index (CPI) experienced a similar increase. Thus, following the tightening of monetary policy, house price growth has slowed but rentinflation continues to rise.
Economic theory suggests that some common forces such as changes in housing demand can drive both rents and house prices. For example, the expansion of remote work since the COVID-19 pandemic has increased demand for housing, raising both house prices and rents (Kmetz, Mondragon, and Wieland 2022). To the extent that the stream of current and future rents reflects the fundamental value of a house, house prices can be a leading indicator of future rentinflation (Lansing, Oliveira, and Shapiro 2022). Thus, monetary policy can affect both house prices and rents by cooling housing demand.
Housing demand responds to changes in financial conditions, such as increases in mortgageinterest rates. However, theory suggests that house prices are more sensitive than rental prices to changes in financial conditions, because home purchases typically require longer-term mortgage financing. In addition, unlike rents, house prices can be partly driven by investor sentiments or beliefs, which explains the observed larger swings in house prices than in rents over business cycles (Dong et al. 2022). Long-term rental contracts can also contribute to slow adjustments in rentinflation.
Rentinflation is an important contributor to overall inflation because housing costs are an important component of total consumption expenditures. On average, housing expenditures represent about 15% of total PCE and 25% of the services component of PCE. In CPI, shelter costs represent an even larger share, accounting for about 30% of total consumption of all urban consumers and about 40% of core consumption expenditures excluding volatile food and energy components.
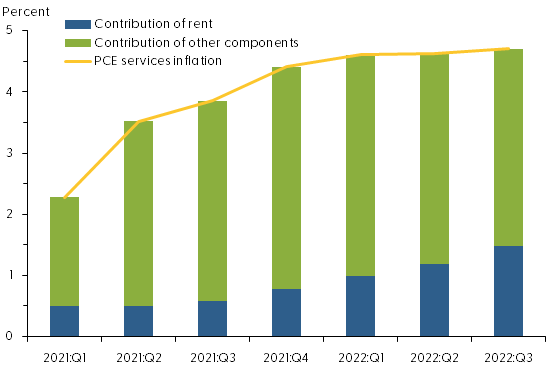
The contribution of rentinflation to overall PCEinflation has increased since early 2021. As Figure 2 shows, in the first quarter of 2021, rentinflation accounted for about 22% of the four-quarter change in the PCE services price index, excluding energy: 0.5 of the 2.3 percentage points increase in service prices was attributable to rentinflation. By the third quarter of 2022, the contribution of rentinflation had climbed to about one-third, or 1.5 of the 4.7 percentage point increase in service prices.
Figure 2: Rising contribution of rent inflation to services inflation
For our analysis, we use a measure of monetary policy surprises constructed by Bauer and Swanson (2022). Their measure focuses on high-frequency changes in financial marketindicators within a short period surrounding the Federal Open Market Committee (FOMC) policy announcements. If the public fully anticipates a policy change, then the financial market would not react to new policy announcements. However, if the market does react to an announcement, then the policy change must contain a surprise element. Thus, changes in financial marketindicators, such as the price of Eurodollar futures, in a narrow window around an FOMC announcement can capture policy surprises. In practice, however, the data constructed this way are not complete surprises because they can be predicted by some macro and financial variables shortly before FOMC announcements. We follow the approach of Bauer and Swanson (2022) to purge the influences of those macro and financial variables from the measure of policy surprises. We use the resulting quarterly time series to measure monetary policy shocks, with a sample period from 1988 to 2019.
We then use a local projections model—a statistical tool proposed by Jordà (2005)—to project how rentinflation responds over time to a tightening of monetary policy equivalent to a 1 percentage point unanticipated increase in the federal funds rate in a given quarter. The model takes into account how monetary policy shocks interact with other macroeconomic variables, including lags of rentinflation, real GDP growth, and core PCEinflation.
In the final step, we compute the responses of rentinflation relative to its preshock level over a period up to 20 quarters after the initial increase in the federal funds rate.
Gradual impact of policy tightening on rent inflation
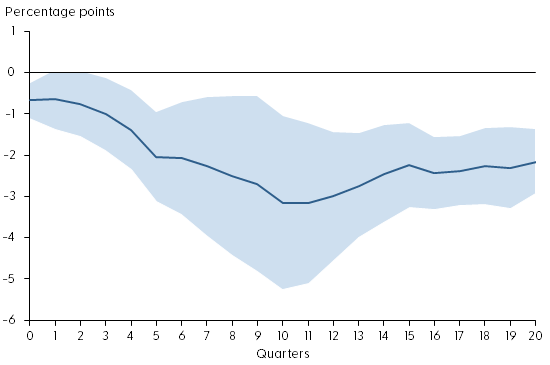
Figure 3 shows the response of rentinflation during the first 20 quarters after an unanticipated tightening of monetary policy (solid blue line). The shaded area shows the confidence band, indicating the statistical uncertainty in estimating the responses. Under the assumption that the model is correct, the shaded area contains the actual value of the rentinflation responses to the monetary policy shock roughly two-thirds of the time. The policy shock is normalized such that it is equivalent to a 1 percentage point unanticipated increase in the federal funds rate.
Figure 3: Response of rent inflation to monetary policy tightening
Source: Bureau of Economic Analysis, Bauer and Swanson (2022), and authors’ calculations. Note: Response of rentinflation to a monetary policy shock equivalent to a 1 percentage point surprise increase in the federal funds rate. Shaded region shows 68% confidence band around the estimate.
The figure shows that monetary policy tightening has significant and gradual effects on rentinflation. On impact, a 1 percentage point increase in the federal funds rate reduces rentinflation about 0.6 percentage point relative to its preshock level. Over time, rentinflation declines gradually, falling about 3.2 percentage points in the 10 quarters following the impact. The slow adjustment in rentinflation partly reflects the stickiness in nominal rents due to long-term rental contracts. Since housing expenditures account for about 15% of total PCE, this estimate translates to a reduction in headline PCEinflation of about 0.5 percentage point, stemming from the decline in rentinflation over a period of 2½ years.
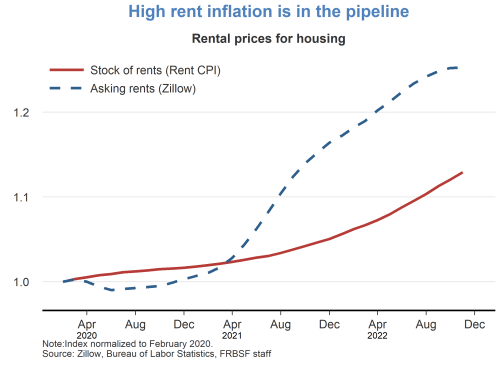
The rent component of PCE is measured based on average rents, including those locked in long-term rental contracts, which are slow to adjust to changes in economic and financial conditions. Rents on new leases, however, are more flexible. For example, the 12-month growth in Zillow’s observed rent index, which measures changes in asking rents on new leases, has slowed significantly since March 2022 (see Figure 4). Asking rents are typically a leading indicator of future average rents. Thus, the slowdown in asking rent growth could portend lower future rentinflation.
Figure 4: Year-over-year observed rent growth starting to slow
Source: Zillow and Haver Analytics. Note: Twelve-month percentage changes in Zillow’s observed rent index. Gray shading indicates NBER recession dates.
Conclusion
Rents are an important component of consumer expenditures. Recent surges in rentinflation have led to concerns that overall inflation might stay persistently high despite tightening of monetary policy. We present evidence that monetary policy tightening is effective for reducing rentinflation, although the full impact takes time to materialize. A policy tightening equivalent to a 1 percentage point increase in the federal funds rate can reduce rentinflation up to 3.2 percentage points over the course of 2½ years. This translates to a maximum reduction in headline PCEinflation of about 0.5 percentage point over the same time horizon. Although average rents are slow to respond to policy changes, growth of asking rents on new leases has started to slow following recent monetary policy tightening. Our finding suggests that this tightening will gradually bring rentinflation down over time, thereby helping to reduce overall inflation.
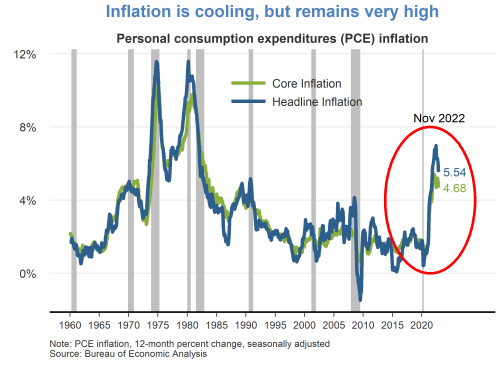
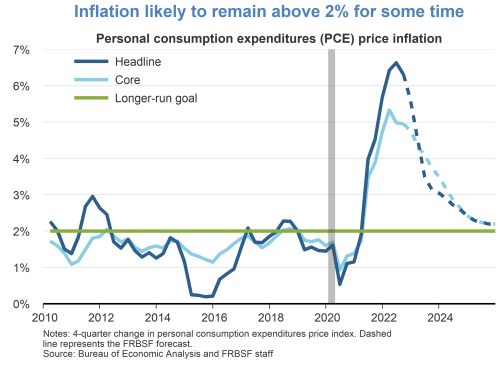
While continuing to cool over the last several months, 12-month inflation remains at historically high levels. The headline personal consumption expenditures (PCE) price index rose 5.5% in November 2022 from a year earlier. This marks a decline in inflation to a level last observed in October 2021, but still well above the Fed’s longer-run goal of 2%. A portion of the inflation moderation is attributable to recent declines in energy prices. Core PCE inflation, which removes food and energy prices, has shown less easing.
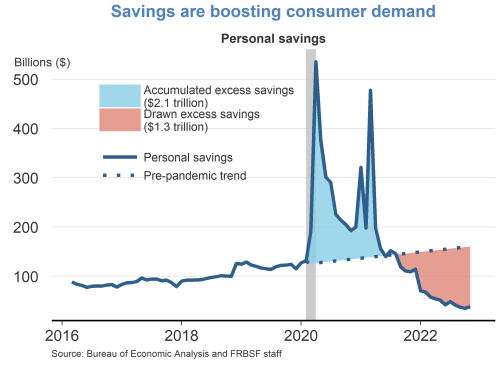
Owing to fiscal relief efforts and lower household spending over the course of the pandemic, consumers accumulated over $2 trillion dollars in excess savings, based on pre-pandemic trends. Since then, consumers have drawn down over half of this excess savings which has helped support recent growth in personal consumption expenditures. A considerable amount of accumulated savings remains for some consumers to support spending in 2023.
In the wake of the pandemic, consumer spending patterns shifted away from services towards goods. While there appears to be some normalization of spending behavior, this shift has generally persisted. Real goods spending remains significantly above its pre-pandemic trend, driven by strong demand for durables such as furniture, electronics, and recreational goods. Spending on services has shown a resurgence but remains below its pre-pandemic trend.
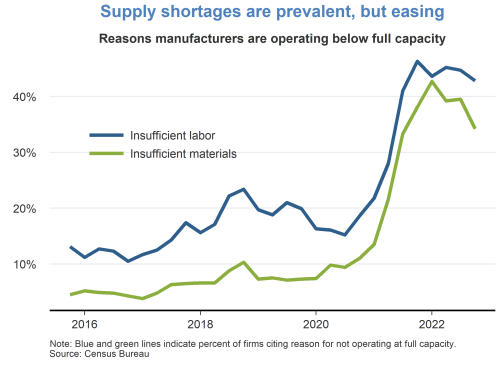
Supply chainbottlenecks for materials and labor remain a constraint on production, although there are some recent signs of easing. The fraction of manufacturers who reported operating below capacity due to insufficient materials peaked in late 2021 and has moderately declined over the past year. However, the fraction of manufacturers reporting insufficient labor has persisted at high levels.
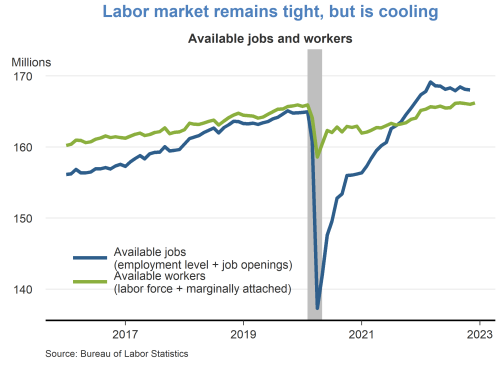
The labor market remains tight, despite some signs of cooling. The number of available jobs remains well above the number of available workers, although vacancy postings have been trending down in recent months. The tight labor market has put continued upward pressure on wages and labor market turnover.
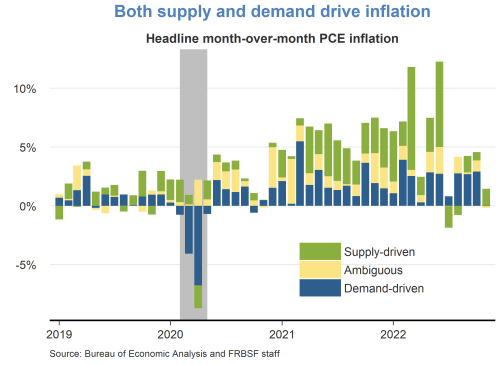
A decomposition of headline PCE inflation into supply– and demand-driven components shows that both supply and demand factors are responsible for the recent rise in inflation. The surge in inflation in early 2021 was mainly due to an increase in demand-driven factors. Subsequently, supply factors became more prevalent for the remainder of 2021. Supply-driven inflation has moderated significantly over recent months, while demand-driven inflation remains elevated.
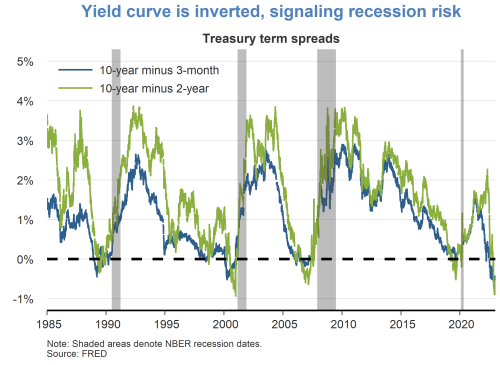
Although the labor market is currently very strong, financial markets are pointing to some downside risks. Namely, the difference between longer- and shorter-term interest rates has turned negative, which historically tends to occur immediately preceding recessions. It remains unclear whether lower longer-term yields are indicative of anticipated slower growth or lower inflation.
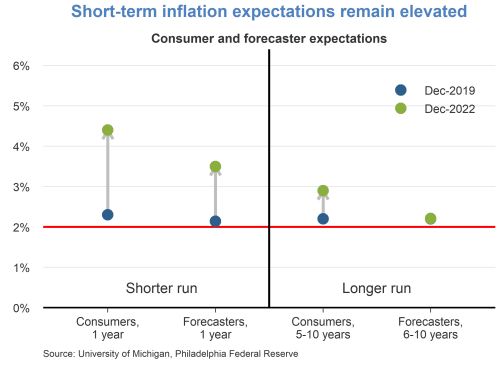
Short-term inflation expectations remain elevated relative to their pre-pandemic levels in December 2019. Consumers are expecting prices to rise 5% this year, while professional forecasters are expecting prices to rise 3.5%. Longer-term inflation expectations remain more subdued, indicating that both consumers and professionals believe inflation pressures will eventually dissipate.
Rentinflation is expected to remain high over the next year. The prices for asking rents have grown quite substantially over the last two years. As new leases begin and existing leases are renewed, these higher asking rents will flow into the stock of rental units, putting upward pressure on rentinflation.
from M. Ayhan Kose, Director, Prospects Group, World Bank Group:
Dear Colleagues.
This year marks the tenth anniversary of the 2009 global recession. Most emerging market and developing economies (EMDEs) weathered the global recession relatively well, in part by using the sizeable fiscal and monetary policy buffers accumulated during the prior years of strong growth. However, a short-lived rebound in activity has been followed by a decade of protracted weakness in EMDEs amid bouts of financial market stress, falling commodity prices, and subdued trade and investment.
Are EMDEs ready to face a deeper global downturn, if it materializes? Our new study A Decade After the Global Recession: Lessons and Challenges for Emerging and Developing Economies [PDF] takes on this question. It examines developments of the past decade, draws lessons for these economies, and discusses policy options. The study is the first comprehensive analysis on the topic with a truly EMDE focus. It offers three main conclusions. First, perhaps for the first time, many EMDEs were able to implement large-scale countercyclical fiscal and monetary policy stimulus during the last global recession. Second, looking ahead, policymakers in many EMDEs are now equipped with stronger policy frameworks than in earlier global downturns or financial crises. Third, EMDEs have now less policy room to face a global downturn than they had before the 2009 global recession. Irrespective of the timing of the next global downturn, the big lesson of the past decade for EMDEs is clear: since they are less well prepared today than prior to the 2009 episode, they urgently need to undertake cyclical and structural policy measures to be able to effectively confront the next downturn when it happens.
You can download the book here [PDF]. Its table of contents is below (each chapter individually downloadable). All charts featured in the book (with underlying data series) are also available below.
This post reviews many of the papers and presentations from the workshop dealing with both financial regulation and innovations in financial technology. It also reviews one of the keynote speeches on the important topic of corporate governance. A companion macroblog post summarizes the workshop’s discussion of digital currencies.
Post-crisis changes in regulation
Some banks had difficulty obtaining adequate funding from private financial markets during the crisis of 2007–08, despite being well capitalized by that period’s capital standards. In part, these funding difficulties were a result of bank depositors fearing that banks had not adequately provisioned for their credit losses.
A paper by University of Michigan professors Thomas Flanagan and Amiyatosh Purnanandam examines the question “Why Do Banks Hide Losses?” [PDF] with a particular focus on the role of shareholder monitoring and management incentives. One problem in conducting such a study is that of separating bad investment decisions from deceptive accounting. This paper exploits an unexpected change in regulation in India to help provide such separation. This regulatory change forced all of the banks in that country to detail the extent of their underreporting of loan losses in 2015. The paper finds that weaker shareholder monitoring and higher-power executive compensation contracts are associated with more underreporting of loan losses.1 This paper helps us to understand how banks exploit accounting discretion over loan losses and reinforces the importance of supervisory oversight.
The funding problems encountered by U.S. banks led to runs and ultimately the collapse of a few banks, but these problems had a significant effect on the operations of some banks that survived. One measure of the vulnerability of a bank to a funding shock was its reliance on uninsured, wholesale deposits from large institutions. Professors Sudheer Chava of Georgia Institute of Technology, Rohan Ganduri of Emory University, Linghang Zeng of Babson College, and graduate student Nikhil Paradkar of Georgia Tech examine one effect of these shocks in their paper “Shocked by Bank Funding Shocks: Evidence from 500 Million Consumer Credit Cards” [PDF]. The paper finds that banks that were more exposed to wholesale funding shocks made larger cuts in consumercredit lines than other banks. The authors further find that these cutbacks were made to the most credit-constrained customers (those with lower credit scores and higher utilization of their credit line). The results also suggest that these credit-constrained consumers responded by cutting back their consumption. Overall, these results provide additional support for regulatory policies intended to strengthen banks so that they can continue lending through future crises.
The Federal Reserve was created in 1913 in large part to provide a source of liquidity during periods of stress in bank lending markets. Yet banks proved surprisingly resistant to borrowing from the Fed’s discount window at the start of the funding problems in the fall of 2007. In an attempt to overcome this reluctance to borrow, the Fed created the Term Auction Facility (TAF) in December 2007. A paper by professors Yunzhi Hu of the University of North Carolina at Chapel Hill and Hanzhe Zhang from Michigan State University examines the TAF in a paper titled “Overcoming Borrowing Stigma: The Design of Lending-of-Last-Resort Policies” [PDF]. This paper develops a simple model in which TAF funding is preferred by stronger banks because the funds are only available with a delay (that is, the funds will not help a bank facing an immediate run) and because TAF gives stronger banks the potential to borrow at lower costs. The paper also provides evidence that when both the discount window and TAF were available, the weakest banks borrowed from the discount window and the relatively stronger banks bid for TAF funds. The results of this study may help to inform the Fed’s policies on the provision of emergency liquidity in the future.
Issues related to bankcapital have been the subject of ongoing discussion among academics, bankers, and regulators since the crisis. Bank of Finlandeconomists Gene Ambrocio and Esa Jokivuolle, along with professors Iftekhar Hasan from Fordham University and Kim Ristolainen from the University of Turku, surveyed the views of banking and finance academics and reported the results in the paper “Are Bank Capital Requirements Optimally Set? Evidence from Researchers’ Views” [PDF] (slide deck [PDF]). The survey obtained results from 149 leading academic researchers. It found that most respondents believe that higher capital ratios would reduce the likelihood of a crisis and the social costs associated with a crisis. Most respondents thought an increase of 5 percentage points in capital would increase the average cost of capital and reduce banklending. However, a majority said that this reduction in lending would result in “minimal to no change” in economic activity.
Fintech lending
Banks have historically been important suppliers of credit to consumers and small businesses. However, since the crisis, lending by some fintech firms to these borrowers has grown rapidly. The conference addressed a variety of questions such as the sources of competitive advantage to fintechlenders; competition between fintech lenders, small banks, and large banks; and the impact of fintechlending on consumers. Additionally, the conference looked at post-crisis changes in banksecuritization rules, which may have some relevance to fintech lenders’ efforts to fund their loans.
Many large banks retreated from some types of retail and small business lending. In part, this pullback was likely to due to a combination of the increased riskiness of these loans and the tightening of bank capital requirements. However, fintechlenders have been expanding into some of the same spaces, raising the question of whether the reduced lending by big banks was due in part to competitive pressure from fintech firms. It also raises the question of whether smaller banks were also retreating due to increased competition or expanding to help fill the void left by the larger banks. Two papers examine the rise of fintechs in two different lending markets and analyze what developments in these markets tell us about big versus small banks.
An important issue for any type of lender is its access to funding. Banks fund their loans with a combination: (a) their own liabilities in the form of deposits and other market borrowings and (b) loan sales to investors. The risk with on-balance-sheet lending is that too many loans will turn bad, the bank will suffer large loan losses, and depositors will flee the bank. Although some fintech firms fund loans with their own liabilities, most of their loans are funded by sales to investors. The advantage to the loan originator of selling loans is that, if the loan goes bad, the buyers of the loan bear the credit losses. However, such sales can lead to concerns that the bank or fintech originating a loan will not be as careful in underwriting and monitoring as they would be with the loans they retain on their own books. The result can be similar to that discussed in the Chava et al. paper, where originators have to reduce their lending volume.
Spatt observed that the importance of proxy advisory firms is easy to understand. All shareholders in a firm face the same questions, and there is similarity in questions across firms. However, any one shareholder obtains only a small fraction of the gains from better governance while potentially paying all of the costs of analysis. In this setting, proxy advisory firms are a predictable market solution to a potential free-riding problem. The increasing returns to scale that arise in this setting also naturally lends itself to the development of a monopoly—or in this case, a duopoly. The result can be reduced incentives for the two proxy advisory firms to avoid factual mistakes and increased power for the advisers to impose their philosophy on firms. Spatt discussed a variety of steps the Securities and Exchange Commission has taken and further actions that could mitigate these concerns. However, the problem of what to do about the role of institutions and proxy advisers in corporate governance is one that may not be totally solvable, but rather requires careful management over time.
Conclusion
The post-crisis period has seen dramatic changes in both information technology and government regulation. The papers presented recently at a workshop at the Atlanta Fed analyzed a number of these changes and contribute to our understanding of how the financial system is likely to evolve in the future.
Larry D. Wall is executive director of the Center for Financial Innovation and Stability at the Atlanta Fed. The author thanks Brian Robertson for helpful comments. The view expressed here are the author’s and not necessarily those of the Federal Reserve Bank of Atlanta or the Federal Reserve System. If you wish to comment on this post, please email atl.nftv.mailbox@atl.frb.org.
1 For further discussion on banks’ reporting of loan losses, see Larry’s recent post on changes to U.S. accounting rules.