[from the International Monetary Fund, by Patrick A. Imam, Kangni R Kpodar, Djoulassi K. Oloufade, Vigninou Gammadigbe]
This paper delves into the intricate relationship between uncertainty and remittance flows. The prevailing focus has been on tangible risk factors like exchange rate volatility and economic downturn, overshadowing the potential impact of uncertainty on remittance dynamics. Leveraging a new dataset of quarterly remittances combined with uncertainty indicators across 77 developing countries from 1999 Q1 to 2019 Q4, the analysis highlights that uncertainty in remittance-sending countries negatively affects remittance flows. In contrast, uncertainty in remittance receiving-countries has a more complex, dual effect. In countries with high private investment ratios, rising domestic uncertainty leads to a decline in remittances. Conversely, in countries with low public spending on education and health, remittances increase in response to uncertainty, serving as a social safety net. The paper underscores the heterogeneous and non-linear effects of domestic uncertainty on remittance flows.
[from NBK Group’s Economic Research Department, 21 November, 2024]
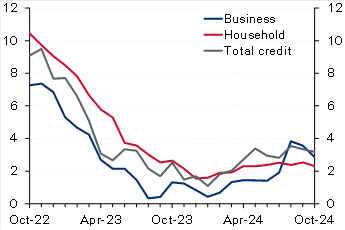
Kuwait: Solid credit growth in October driven by household credit. Domestic credit increased by a solid 0.4% in October, driving up YTD growth to 2.9% (3.2% y/y). The recovery in household credit continued, with growth in October at a solid 0.5%, resulting in a YTD increase of 2.4%. While y/y growth in household credit remains a limited 2.3%, annualized growth over the past four months is a stronger 4.7%. Businesscredit inched up by 0.2% in October, pushing YTD growth to 3.6% (2.9% y/y). Industry and trade drove businesscredit growth in October while construction and trade are the fastest growing YTD at 17% and 8%, respectively. In contrast, the oil/gas sector continued its downtrend, deepening the YTD decrease to 13%. Excluding the oil/gas sector, growth in business credit would increase to a relatively good 5% YTD. Looking ahead, the last couple of months of the year (especially December) are usually the weakest for businesscredit, likely due to increased repayments and write-offs, but it will not be surprising if the recovery in household credit is generally sustained, especially given the commencement of the interest rate-cutting cycle. Meanwhile, driven by a plunge in the volatile public-institution deposits, resident deposits decreased in October, resulting in YTD growth of 2.4% (4.2% y/y). Private-sectordeposits inched up in October driving up YTD growth to 4.5% compared with 10% for government deposits while public-institution deposits are a big drag (-14%). Within private-sector KD deposits, CASA showed further signs of stabilization as there was no decrease for the third straight month while the YTDdrawdown is a limited 1%.
Chart 1: Kuwait credit growth
(% y/y)
Source: Central Bank of Kuwait (CBK)
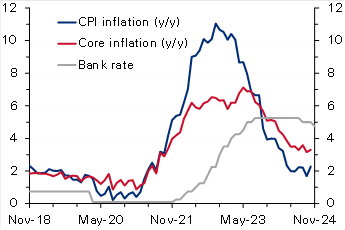
Chart 2: UK inflation
(%)
Source: Haver
Egypt: IMF concludes mission for fourth review, sees external risks. The IMF concluded its visit to Egypt after spending close to 2 weeks, holding several in-person meetings with the Egyptian authorities, private sector, and other stakeholders. The IMF released a statement mentioning that the current ongoing geopolitical tensions in the region in addition to an increasing number of refugees have affected the external sector (Suez Canal receipts down by 70%) and put severe pressure on the fiscal front. The Fund acknowledged the Central Bank of Egypt’s commitment to unify the exchange rate, maintain the flexible exchange rate regime, and keep inflation on a firm downward trend over the medium term by substantially tightening monetary policy. It also highlighted that continued policy discipline was also a key to containing fiscal risks, especially those related to the energy sector. The Fund, as always, re-iterated the need for promoting the private sector mainly through an enhanced tax system and accelerating divestment plans of the state firms. Finally, it also said that the discussions would continue over the coming days to finalize the agreement on the remaining policies and reform plans. However, the release did not provide any clear hints about the conclusion on the government’s earlier request to push the timeline of some of the subsidy moves.
Oman: IMF completes article IV with a strong outlook for the economy in 2025. Oman’s economy continued to expand with growth reaching 1.9% in the first half of 2024 (versus 1.2% in 2023), despite being weighed down by OPEC+ mandated oil production cuts as non-oil GDP grew a stronger 3.8% y/y in H1 (versus 1.8% in 2023). The fiscal and current account balances remain in a comfortable situation evident by a decline in public sectordebt and the recent rating upgrade to investment grade. The Fund expects Oman’s economic growth to see a strong rebound in 2025, supported by higher oil production. It also believes that fiscal and current account balances will remain in surplus but at lower levels. Key risks to the outlook stem from oil price volatility and intensifying geopolitical tensions. The IMF also mentioned that further efforts are needed to raise nonhydrocarbon revenues through more tax policy measures and the phasing out of untargeted subsidies which should help in freeing up resources to finance growth under the government’s diversification agenda.
UK: Inflation rises more than forecast, reinforcing BoE’s caution on rate cuts. UKCPIinflation increased to 2.3% y/y in October from 1.7% the previous month, slightly above the market and the Bank of England’s forecast of 2.2%. On a monthly basis too, inflation rose to 0.6%, a seven-month high, from September’s no change. The steep rise was mainly driven by an almost 10% rise in the household energy price cap effective from October. Core inflation also accelerated to 3.3% y/y (0.4% m/m) from 3.2% (0.1% m/m). While goods prices continued to fall (-0.3% y/y), service prices rose at a faster rate of 5% from 4.9%. Recently, the Bank of England had cautioned about inflation quickening next year (projecting a peak rate of 2.8% in Q3 2025), citing the impact of higher insurance contributions and rising minimum wages as outlined in the latest government budget. Therefore, with inflation rising above forecast, the bank will likely slow the pace of monetary easing after delivering two interest rate cuts of 25 bps earlier, with markets now seeing only two additional cuts by the end of 2025.
Eurozone: ECB warns of fiscal and growth risks in its latest Financial Stability Review [archived PDF]. In its most recent Financial Stability Review (November) [archived PDF], the European Central Bank warned that elevated debt and fiscal deficit levels and anemic long-term growth could expose sovereign debt vulnerabilities in the region, stoking concerns of a repeat of the 2011 sovereign debt crisis. Maturing debt being rolled over at much higher borrowing rates raising debt service costs poses risks to countries with little fiscal space and leaves certain governments exposed to market fluctuations. The bank also emphasized the risks of high equity valuations, low liquidity and a greater concentration of exposure among non-banks. Moreover, it sees current geopolitical uncertainties and the possibility of more trade tensions as heightening risks. The Eurozone’s current government debt-to-GDP ratio stands at 88%, but the underlying data suggest a much more precarious situation with Greece, Italy, and France’s ratios at 164%, 137% and 112%. Recently, concerns about France’s high fiscal deficit (around 5.9% of GDP) and elevated debt levels saw yields on the country’s bonds rise steeply, widening the spread gap with Germanbonds to the highest level in over a decade.
Disclaimer: While every care has been taken in preparing this publication, National Bank of Kuwait accepts no liability whatsoever for any direct or consequential losses arising from its use. Daily Economic Update is distributed on a complimentary and discretionary basis to NBK clients and associates. This report and previous issues can be found in the “News & Insight / Economic Reports” section of the National Bank of Kuwait’s web site. Please visit their web site, nbk.com, for other bank publications.
Among the 369 largest counties, 348 had over-the-year increases in average weekly wages. In the second quarter of 2024, average weekly wages for the nation increased to $1,390, a 4.4-percent increase over the year. Hamilton, IN, had the largest second quarter over-the-year wage gain at 33.4 percent. (See table 1 [archived PDF].)
Large County Average Weekly Wage in Second Quarter 2024
Hamilton, IN, had the largest over-the-year percentage increase in average weekly wages (+33.4 percent). Within Hamilton, an average weekly wage gain of $2,161 (+139.6 percent) in professional and business services made the largest contribution to the county’s increase in average weekly wages.
Essex, MA, had the largest over-the-year percentage decrease in average weekly wages (-2.1 percent). Within Essex, an average weekly wage loss of $644 (-25.7 percent) in professional and business services made the largest contribution to the county’s decrease in average weekly wages.
All of the 10 largest counties had over-the-year percentage increases in average weekly wages. In the second quarter of 2024, King, WA, experienced the largest over-the-year percentage gain in average weekly wages (+10.4 percent). Within King, professional and business services had the largest impact, with an average weekly wage increase of $774 (+24.5 percent).
For More Information
The tables included in this release contain data for the nation and for the 369 U.S. counties with annual average employment levels of 75,000 or more in 2023. June 2024 employment and second quarter 2024 average weekly wages for all states are provided in table 3 [archived PDF] of this release.
Over-the-year changes of employment and wages presented in this news release are adjusted and may differ from unadjusted data used in BLS data tools and interactive charts. More information is available in the QCEWTechnical Note.
The County Employment and Wages full data update for second quarter 2024 is scheduled to be released on Thursday, December 5, 2024, at 10:00 a.m. (ET).
The County Employment and Wages news release for third quarter 2024 is scheduled to be released on Wednesday, February 19, 2025, at 10:00 a.m. (ET).
* 40-year JapaneseGovernment Bonds to be issued in July will be a reopening issue of the May 2024 issue. The auction method is Dutch-style-yield-competitive auction at intervals of 0.5bp.
Kicking off a new CGD series of policy proposals to inform the European Union’s upcoming development agenda, Mikaela Gavas and W. Gyude Moore suggest a reset of the EU’s international relations narrative. Explore their ideas for how the EU can position itself as a global development player while staying true to its values and focusing on the common good.
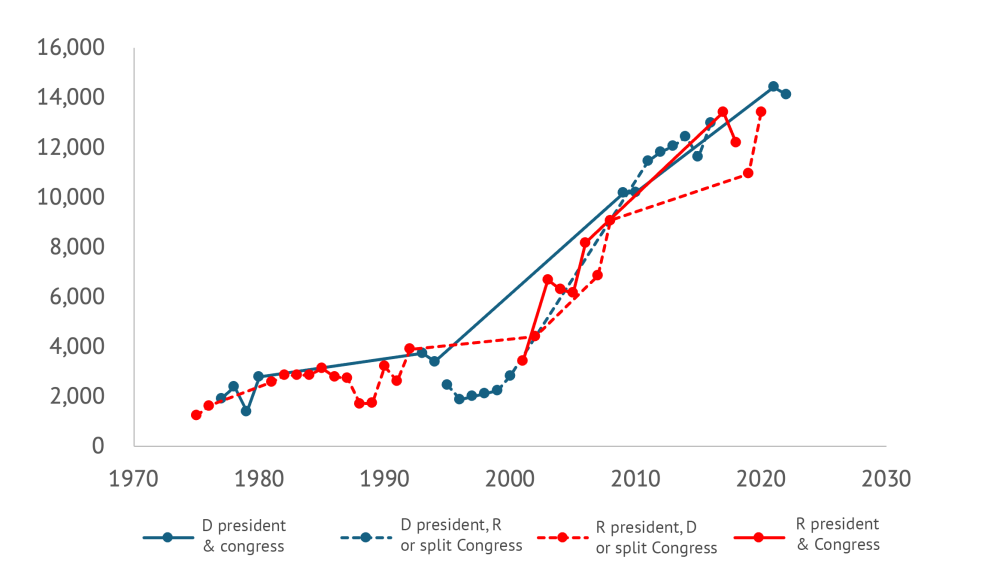
The same applies to aid flows. The figure below shows data on total aid disbursements from the US depending on who is in power: the solid blue line is Democratic control of the presidency and both branches of Congress, the blue dashed line is Democratic control of the presidency and one or neither branch, the solid red line is Republican control of the presidency and both chambers, and the red dashed line is control of the presidency and one or neither chamber. There’s only one data point for each year, of course, but the lines connect between them. The broad picture strongly suggests the trend matters more than who is in power (indeed, remember the Surprise Party?).
Figure 1: US aid disbursements by party control (Current $m)
The potential good news from this is that despite substantive disagreements over topics including the Mexico City Policy, bipartisan cooperation on aid might still be more possible than it might appear from a close-up perspective in the midst of partisan rancor. To repeat the bad news: much of the recent bipartisan movement on foreign economic policy has been to the detriment of developing countries. And there is certainly some talk of sweeping changes, including cuts, that might mean the past is no guide. But perhaps there still space for elements of a positive agenda around aid for the legislative sessions of next year, one that could appeal to at least some people on both sides of the aisle. Examples might include:
Advancing localization: Spending more US aid finance in recipient countries rather than on US contractors has been a hallmark of Samantha Power’s tenure at USAID. But it has Republican antecedents. The Trump administration followed a localization strategy for PEPFAR that significantly increased the number of local partners and a New Partnerships Initiative at USAID designed in part to do the same. And in 2021, US SenatorsMarco Rubio (R–FL) and Tim Kaine (D–VA) introduced legislation to reduce red tape for local organizations seeking USAID funds. It would be great to see further cooperation on ensuring more development dollars are actually spent in developing countries.
Country focus: All else even somewhat equal, a dollar of foreign assistance simply has a larger impact in poorer countries. The logic that richer countries should be able to look after themselves was a justification for the Trump administration’s “Journey to Self-Reliance”—a philosophy dedicated toward “ending the need for aid.” The Biden administration has continued to produce the “country roadmaps” designed to chart the journey. It would be great to see bipartisan efforts to focus grant resources in particular where they’ll have the greatest impact—in the poorest countries.
Sovereign lending and guarantees: While grants should be focused on poorer countries, loans could be an effective and comparatively low-cost tool to support wealthier countries. The recently passed Ukraineaid package provided resources in the form of partially forgivable loans, and senior Republicans have been pushing the model more widely. More lending and guarantees could be a powerful tool to support infrastructure rollout in middle-income countries. And strengthening the US sovereign loan guarantee program could back development and national security goals at a considerably lower cost than grant-based programs.
MCC reform: The Millennium Challenge Corporation, created during the George W. Bush administration, is running into pipeline challenges—and appropriators have clawed back funding in response. That’s a shame. It is a small but effective aid agency providing resources for development priorities including infrastructure and working with client countries to help them deliver—in fact, it’s a model of successful localization. MCC faces spending challenges in part because it hasn’t increased the size of individual country operations, limits repeat operations, and can only work in countries that pass its “scorecard” of development indicators. The agency wants to address its partner problem by working in richer countries. That’s a sad way to achieve impact and goes against the bipartisan principle that richer developing countries should be weaned off aid flows, not given more. Altering the size of compacts, allowing more repeat compacts, and moving away from a scorecard model towards a model of reward for reform—a specific set of policy changes that need to be completed before funds start flowing—would be a far more effective approach.
Fighting malaria: In the 1958 State of the Union, PresidentEisenhower said that the US would lead a global effort to eradicate malaria. The time and the tools were not right then, but today there is far greater hope for rapid progress against the disease. George Bush created the President’s Malaria Initiative in 2005, and the US has been a vital contributor to the global fight against the parasite since then. With the arrival of new vaccines in the past couple of years, we could accelerate progress and save hundreds of thousands of children’s lives each year. And with better vaccines, we could move even faster. PEPFAR, the US initiative to provide HIV drugs, has transformed the battle against AIDS worldwide. A similar bipartisan initiative could achieve as much with malaria.
Transparency: Both parties have shown commitment to increasing the transparency of aid finance including around subawards and indirect cost rate data. It would be great if there was a bipartisan consensus on simply publishing all aid contracts.
Beyond aid, the African Growth and Opportunity Act was first passed during the Clinton administration, renewed during the Bush administration and then again under the Obama administration. A bipartisan proposal to renew the trade package once more was launched in the Senate in April this year. Perhaps AGOA could be made even bigger and better. Even amidst partisan rancor, there is plenty a Congress and administration could do to improve US relations with and support to low- and middle-income countries next year.
Undoing Gender Inequality Traps in the Financial Sector: The Case of Colombia
by Mayra Buvinic and Alba Loureiro, July 9, 2024 (CGD Blog Post)
Gender data is needed to gauge the extent to which financial services include and benefit women. However, sex-disaggregated data that tracks access to and use of financial services is still hard to come by, and it is especially rare to have country-level data that captures the universe of financial sector providers (FSPs) and is published on a regular basis.
A notable exception is Colombia, where Banca de Oportunidades (BdO), a public sector technical assistance and advocacy platform, compiles in a centralized data platform anonymized data from all FSPs in partnership with Colombia’s Superintendency of Banks. The 2023 edition, the 13th annual publication, reports on 15 million transactions, 60 percent of them monetary, from the universe of banks, credit and savings cooperatives, microfinance institutions, and fintechs. The report tells a sobering story worth highlighting of the trajectory of women’s financial inclusion because it mirrors much of what we know [archived PDF] about the constraints women face having access to financial services in low- and middle-income countries. The report’s numbers [archived PDF] suggest that:
Expanding access is not enough
Despite almost universal access to financial products, gender gaps persist. In 2023, 19 out of every 20 adult Colombians (or 94.6 percent) reported access to at least one financial product or service. However, women faced less favorable conditions (see below), underscoring that mere access is insufficient.
Gender gaps are evident in both savings and credit
In 2023, women had 6.5 and 3.7 percentage points (pp) lower access to savings and credit, respectively, than men. While women’s access to savings increased over time–from 75 percent in 2018 to 90.4 percent in 2023–the gender gap widened (from 4.3 pp to 6.5 pp). In the same period, the gender gap in credit narrowed slightly (from 4.8 pp to 3.7 pp) but both men’s and women’s access to credit decreased–for women from 37.7 percent in 2018 to 33.4 percent in 2023.
Women face access to credit in less favorable conditions than men
Interest rates are higher for women clients across all loan types, and highest for microcredit–with a 5.4 percent gender gap–which women access more than men. In 2023, women accessed 1,029 million and men accessed 857,000 microcredit loans. More men than women accessed commercial loans (20,000 versus 14,000 loans) while housing loans went equally to women and men.
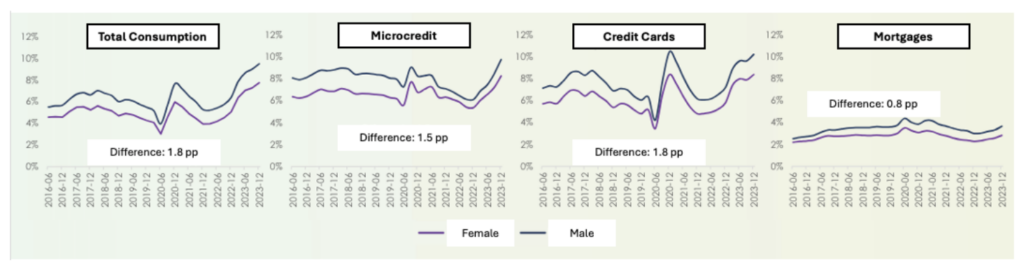
Paradoxically, these less favorable conditions coexist with women exhibiting lower credit risks than men
Women have better repayment rates than men across loan types (Figure 1). Women also perform better across insurance products, except for microinsurance, showing lower accident rates. However, female clients have 13.8 pp lower access to insurance products than men.
Figure 1: Total Repayment Rates, Overdue More Than 30 Days.
Source: The graphic was extracted from the Financial Inclusion PowerPoint (Paola Arias and Jaime Rodriguez, 4 June, 2024) [archived PDF], and the labels were translated from Spanish.
The data implies that women’s good financial behavior is penalized rather than prized, with higher interest rates and lower access to financial products
Rationing credit and other financial services to women perpetuates ‘gender inequality traps’ leading to further rationing
It all starts with women having fewer assets to use as collateral and lower earnings than men (a commonplace fact across financial markets everywhere) which leads them to qualify for smaller loans. In turn, this results in women having less access to credit to increase earnings because of the high costs to lenders of serving customers with small loans, resulting in even lower earnings.
Gender biases that affect the supply and demand for credit reinforce this vicious cycle
On the supply side, there are cognitive and perceptual biases (the latter detected by eye-tracking) from financial sector providers–male potential borrowers are ‘ex-ante’ perceived as having higher earnings than similar women. And female bank agents are stricter at evaluating female clients than male clients.
On the demand side, the incorrect assumption that women are higher credit risks than men is reinforced by female clients’ own lower self-confidence and greater self-exclusion from financial services: women do not apply for credit because they anticipate they will be rejected because they have lower earnings.
Not surprisingly perhaps, women in Colombia score lower than men in a financial health indicator–with an average score of 4.9 for women and 5.6 for men measured in a 0 to10 scale (scored by BdO using data from the 2022 edition of the survey).
To overcome these gender inequality traps, only a combination of strategies will work
Solutions must address both demand– and supply-side constraints and include:
Increase women’s self-confidence and combat their self-exclusion from financial services with credit ‘plus’ interventions that include ‘soft skills’ training.
Provide customized products that fit women’s needs, including importantly insurance and microinsurance that respond to women’s greater need for mitigating (family) risks.
Combat supply-side biases that lead to inefficiencies and exclusions, including incentives to financial sector providers to reach women with financial services.
For the above, collect and publish gender data, but data that does not end up sitting on a shelf gathering dust; data that instead is used to make management decisions, which underscores the role of public sector institutions such as BdO in collaborating with and incentivizing financial sector providers, and in measuring, tracking, and reporting progress in financial inclusion.
Fortunately, there is a growing wealth of research that backs up the solutions suggested above. But there is still an important practical research agenda ahead:
First is reaching the poorest and excluded with financial services that they may need. In the case of Colombia, this includes indigenous and Afro-descendent populations in geographically distant regions of the country. This requires building further granularity in the financial inclusion data, following guidelines of intersectionality data in development.
There is substantial research on demand-side constraints in women’s access to financial services. There is comparatively little research on supply-side gender biases and solutions to these biases that can be scaled.
Lastly, there is the task of developing financial health indicators that can be easily and widely used disaggregated by gender and other demographic features to monitor an important development outcome from increasing financial access to all.
Disclaimer
CGD blog posts reflect the views of the authors, drawing on prior research and experience in their areas of expertise. CGD is a nonpartisan, independent organization and does not take institutional positions.
However, non-mining business investment in Australia was fairly weak over much of the 2010s, despite declines in interest rates and moderate economic growth. While several explanations have been put forward, one potential explanation is that monetary policy is not very effective at stimulating business investment or has become less effective over time.
We provide new evidence on the effect of monetary policy on investment in Australia using firm-level data. We find that contractionary monetary policy makes firms less likely to invest and lowers the amount they invest if they do so. The effects are similar for young and old firms, indicating that the decline in the number of young firms in Australia over time is unlikely to have weakened the effect of monetary policy. The effects are also broadly similar for smaller and larger firms. This suggests that evidence that some, particularly large, firms have sticky hurdle rates does not mean that they do not respond to monetary policy. It also suggests that overseas findings that expansionary monetary policy lessens competition by supporting the largest firms likely do not apply to Australia. We find evidence that financially constrained firms, and sectors that are more dependent on external finance, are more responsive to monetary policy, highlighting the important role of cash flow and financing constraints in the transmission of monetary policy. Finally, we find evidence that monetary policy affects firms’ actual and expected investment contemporaneously, suggesting that expectations are reactive and will tend to lag over the cycle.
The Federal Trade Commission is sending more than $3 million in refunds to businesses that paid for memberships to HomeAdvisor, Inc., a company affiliated with Angi (formerly known as Angie’s List). The agency is also sending claim forms to businesses that are eligible for additional refunds.
The refunds stem from FTC allegations that HomeAdvisor used deceptive marketing tactics when selling home improvement project leads to service providers, including small businesses operating in the “gig” economy. The FTC’s March 2022 complaint alleged that since at least mid-2014, HomeAdvisor made false, misleading, or unsubstantiated claims about the quality and source of the leads it was selling to home service providers in search of potential customers. The agency also charged that HomeAdvisor told businesses that their annual membership would include one free month of mHelpDesk, an optional scheduling and payment processing service marketed by HomeAdvisor, but in reality, the company charged an additional $59.99 for the first month.
The FTC is sending 110,372 checks to eligible home service providers. These refunds are related to the FTC’s allegations that HomeAdvisor misled businesses about the quality of customer leads they would get with their membership. Recipients should cash their checks within 90 days, as indicated on the check.
The agency is also sending 91,273 claims forms to businesses that paid for mHelpDesk. The deadline to submit a claim is February 26, 2024. More information about the refund process is available at ftc.gov/HomeAdvisor or by calling the refund administrator, Rust Consulting, Inc., at 1-833-915-1144. The Commission never requires people to pay money or provide account information to get a refund.
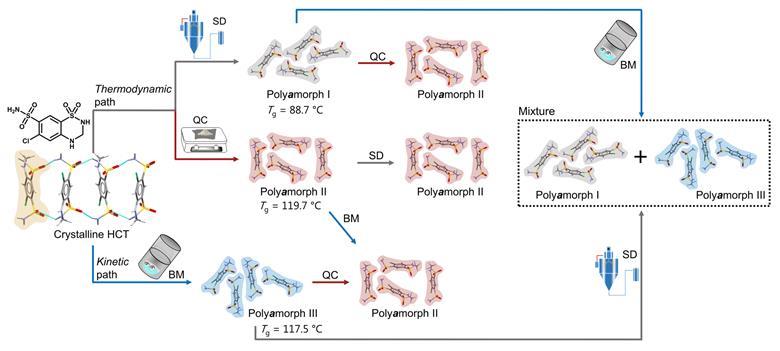
Results from a study combining experiments and simulations could overturn the assumption that amorphous forms of the same compound have the same molecular arrangement. The team behind the work claims to have prepared three amorphous forms of the diureticdrughydrochlorothiazide and determined that they have distinct properties and distinct types of disorder. ‘If polyamorphism is proved in the future to be a universal—or at least not a very rare—phenomenon, then the pharmaceutical industry will need to make screens for polyamorphism and this will also be an opportunity for patenting,’ comments Inês Martins, from the University of Copenhagen in Denmark, who led the work with Thomas Rades.
Crystallineactive pharmaceutical ingredients (APIs) often suffer from poor solubility. A common strategy to circumvent this problem is converting APIs into their amorphous form. This has been demonstrated for various APIs, including hydrochlorothiazide. However, the physical properties of polyamorphs are dependent on how they were prepared. Given there are no straightforward techniques to study how molecules interact and organise themselves in amorphous materials, the area is poorly understood.
‘The problem out of the gate with polyamorphism as a concept is how to tell the difference between a well-defined metastableamorphous structure and an unrelaxed one that simply results from kinetically trapped defects introduced during processing. This is hard to define since the amorphousstructure is statistical in any case,’ comments Simon Billinge, who studies the structure of disordered materials at Columbia University in the US. ‘They process the samples very differently. We know—from our own work—that this results in amorphous phases with very different stabilities against recrystallisation, for example, but is this polyamorphism? On the other hand, they find that the pair distribution functions of each of their “forms” are identical. There is no experimental evidence for a distinct structure. Taken together, the results do little to advance my understanding of polyamorphism.’
The team also says the simulations corroborated its experimental results that polyamorph I can transform into polyamorph II, while the opposite conversion did not take place.
This paper seeks to estimate the extent to which market-implied policy expectations could be improved with further information disclosure from the FOMC. Using text analysis methods based on large language models, we show that if FOMC meeting materials with five-year lagged release dates—like meeting transcripts and Tealbooks—were accessible to the public in real-time, marketpolicy expectations could substantially improve forecasting accuracy. Most of this improvement occurs during easing cycles. For instance, at the six-month forecasting horizon, the market could have predicted as much as 125 basis points of additional easing during the 2001 and 2008 recessions, equivalent to a 40-50 percent reduction in mean squared error. This potential forecasting improvement appears to be related to incomplete information about the Fed’s reaction function, particularly with respect to financial stability concerns in 2008. In contrast, having enhanced access to meeting materials would not have improved the market’s policy rate forecasting during tightening cycles.
Container shipping companies’ 3Q23 financial results showcased a sharp dip in profits or even losses. On a group level, eleven liners (which report quarterly results) among our portfolio of 13 companies reported an average slump of 54.6% YoY in their 3Q23 topline. Operating costs declined 18.1% YoY amid falling chartering costs and lowering bunker prices. However, the cost reduction was insufficient to offset the plunge in topline; thus, EBIT contracted 94.1% YoY on average.
The Drewry Container Equity Index tumbled 28.1% YTD 2023 (ending 22 November), driven by lowering freight rates (WCI: -30.7% in YTD 2023), which squeezed earnings over the quarters. On the contrary, the S&P 500 posted an 18.4% growth. The Drewry Container Equity Index declined 3.4% in the month ending 22 November 2023. Talking about equity prices individually, APMM’s stock price fell 9.0% amid EBIT loss for its Ocean segment in 3Q23, staff cuts and reduced capex guidance, highlighting APMM’s efforts toward reducing costs faced with the bleak industry outlook. Hapag-Lloyd’s stock price slumped 22.2% as its EBIT margin (3Q23: 5.1%) slid below its pre-pandemic level (3Q19: 7.8%). ZIM became the first carrier to report impairment of assets worth USD 2.0bn in 3Q23, and its stock price fell 18.1%. Meanwhile, China-exposed container companies benefitted from the positive sentiment arising from the proposed fiscal stimulus by the Chinese government, possibly boosting the out-of-China and intra-Asia trades. Asianstocks in the broader index rose 2.0% to 19.4% in the month ending 22 November 2023.
Mainly driven by weak earnings prospects, the Drewry Container Equity Index trades at a P/B of 0.5x, a 47.5% discount to its pre-pandemic average (2013-19). We expect freight rates to fall sharply in 2024 and increasingly incur losses. Thus, we expect the multiple to remain suppressed.
As the fleet of container shipping companies expands, the charter market softens. For instance, 1-year TC rates declined 14.2% and 52.5% YoY in October for vessels sized 1,110 teu and 8,500 teu. Rates declined more for larger vessels as these constitute the majority of the order book and new deliveries. The YoY decline has continued since October 2022, but rates improved slightly during April-May 2023. However, this was not due to the fundamentally strong market but MSC and CMA CGM’s aggressive chartering of vessels to expand their fleets. Now that the two companies have stopped chartering in vessels, the charter market continues to decline.
Driven by the softening charter market, second-hand asset prices are also weakening. In October, on a YoY basis, prices for five-year-old vessels (2,700 teu and 7,200 teu) contracted 30.6% and 31.5%, and for 10-year-old ships, prices tumbled between 36.7% and 53.2%. Contrary to the sale and purchase market, newbuild prices (1,500 teu and 14,000 teu) continue to increase and rose by an average of 2.2% YoY, led by a shortage of capacity in shipyards.