[from NBK Economic Research, 21 July, 2025]
by Mohammad Al-Shehri, Assistant Economist & Omar Al-Nakib, Head of MENA Research
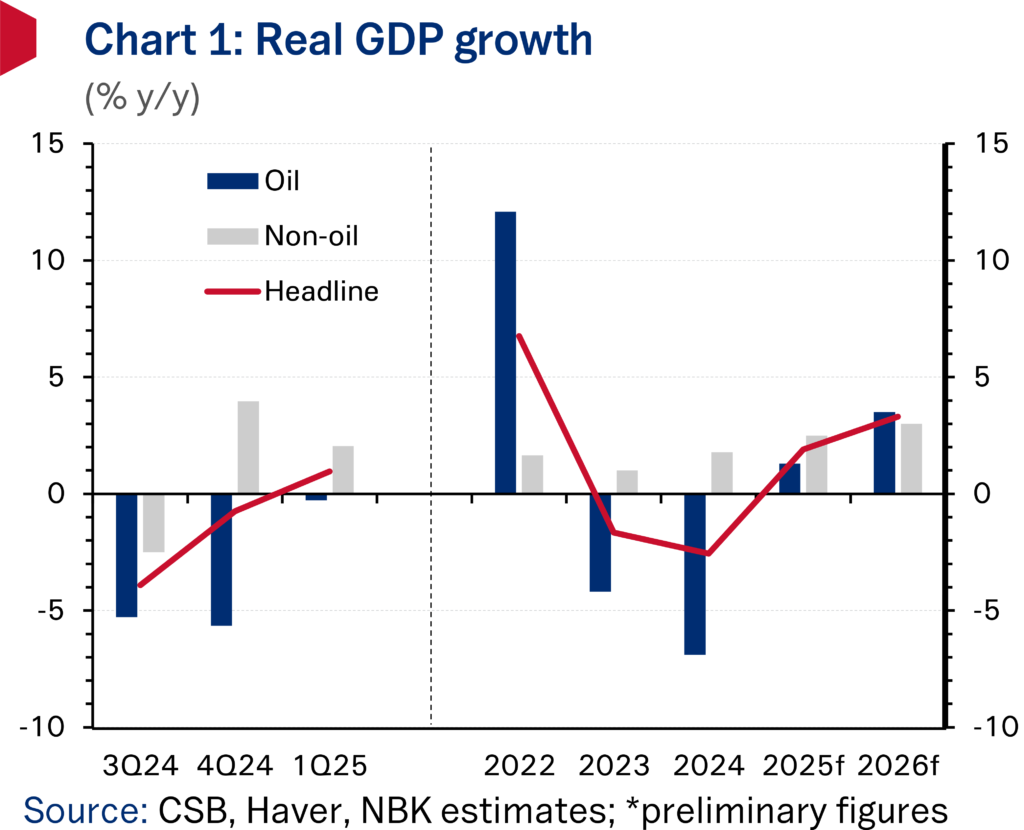
Preliminary official figures show GDP expanding 1% y/y in Q1 2025 following seven consecutive quarters of contraction, helped by a less severe downturn in oil output. With the negative effects of earlier voluntary oil production cuts beginning to fade, oil GDP recorded only a marginal decline, the softest since Q2 2023. Growth in non-oil activity remained positive though eased, weighed by a moderation in the manufacturing, real estate, and transport sectors. The near-term outlook for GDP is one of positive growth, lifted by rising oil production after Kuwait started to restore 135 kb/d of oil output cuts between April and September 2025, while the non-oil sector should also register further steady gains.
Non-oil GDP growth softens in Q1 2025 after strong performance in Q4 2024
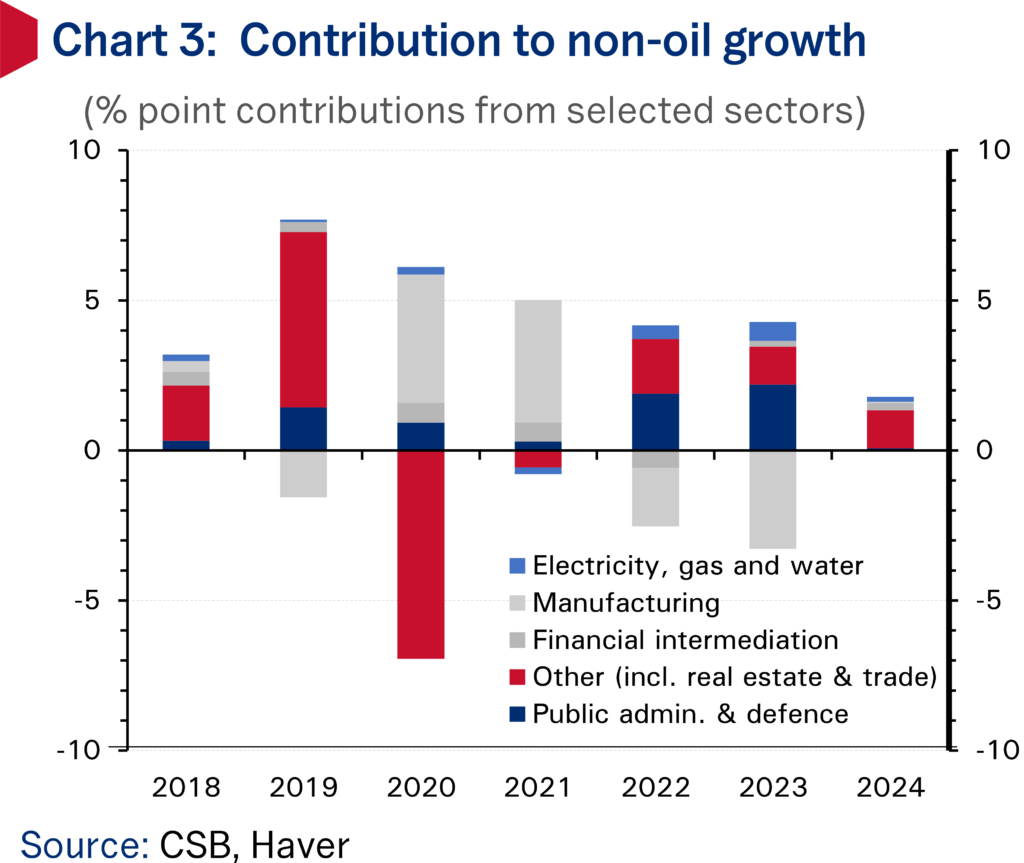
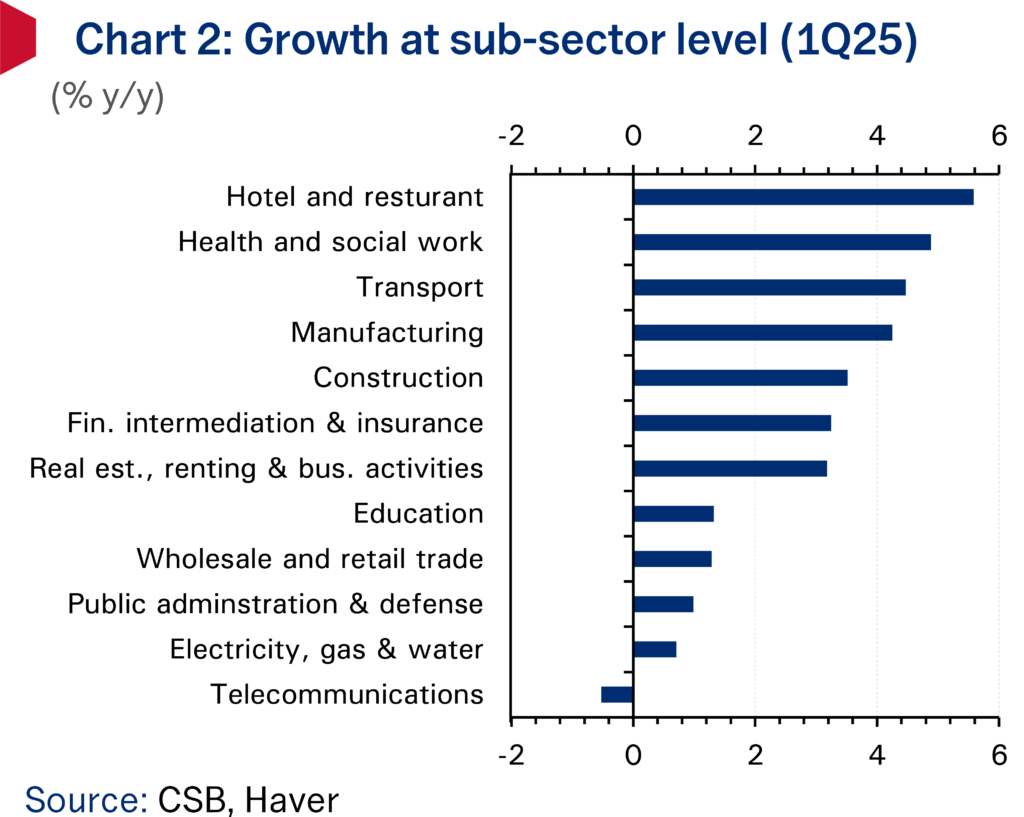
Growth in the non-oil sector weakened in Q1 2025, slowing to 2% y/y compared to 4% recorded in the prior quarter. (Chart 1.) The softer expansion in non-oil activity reflected, among other things, a moderation in the manufacturing sector, where activity grew at a still-solid 4.3% despite a decline in refined petroleum products output but slowed notably from the 12.2% reading registered in Q4 2024. Growth in other sectors including real estate, wholesale & retail trade, transport, and education also slowed. Offsetting the slowdown was stronger expansion in the non-oil economy’s largest segments: public administration and defense as well as financial intermediation and insurance, which grew 1% and 3.2% y/y, respectively. (Chart 2.)
Oil sector logs marginal contraction, set to return to growth in Q2
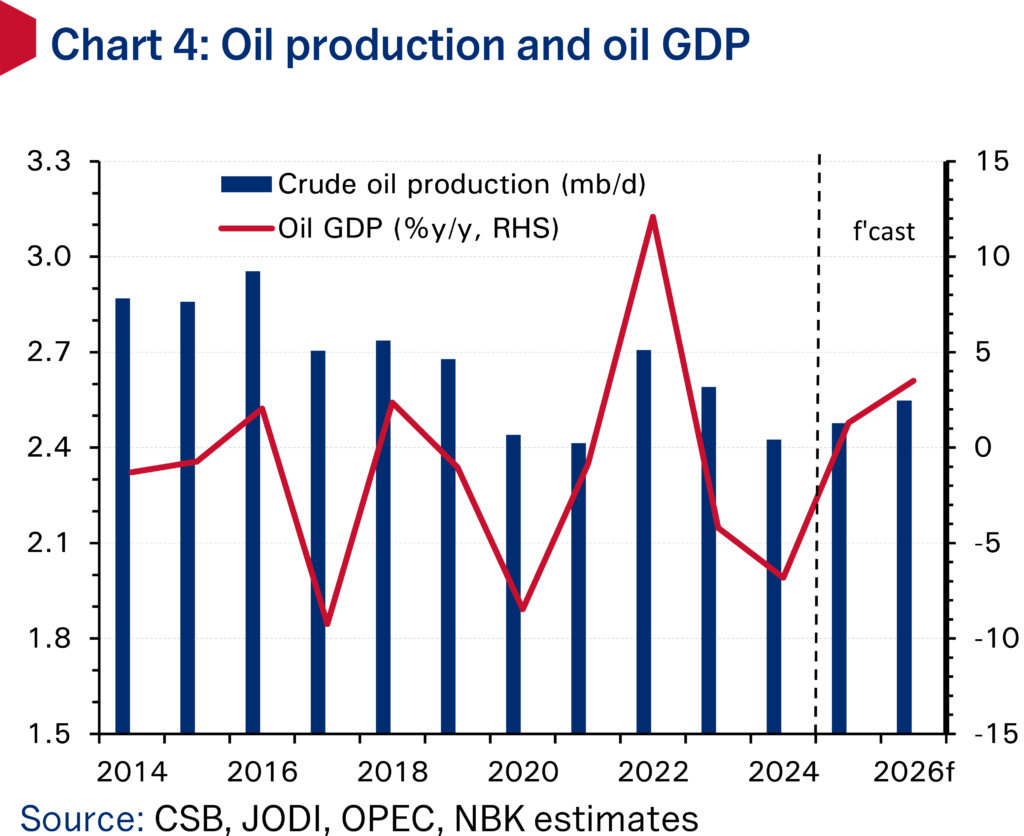
The contraction in oil GDP eased significantly to -0.3% y/y from -5.7% y/y in Q4 2024, registering the softest rate of decline since Kuwait embarked on cutting oil production in Q2 2023 after participating in the voluntary cuts scheme with 7 other OPEC+ members. (Chart 4.) Kuwait’s oil production averaged 2.415 mb/d in Q1 2025, a 0.7% decline from the same quarter last year, according to OPEC secondary sources. However, oil sector fortunes are set to shift in Q2 2025 and thereafter, after the OPEC-8 member alliance started unwinding the 2.2 mb/d voluntary cut tranche in April 2025. Originally planned to be unwound over the course of 18 months, OPEC+ has accelerated the pace of supply hikes with output now on a path to be fully restored in September, a full year ahead of schedule. For Kuwait, crude production rose by 0.5% q/q in Q2 to 2.426 mb/d and is set to accelerate further to average 2.533 mb/d in H2 2025. With the oil market so far able to absorb the additional OPEC and global supply and oil prices currently holding near $70/bbl, an upside risk to our oil sector outlook involves the potential unwinding of the outstanding OPEC-8 voluntary cuts (1.66 mb/d), of which Kuwait’s share is 128 kb/d.
Growth heading back into positive territory in 2025
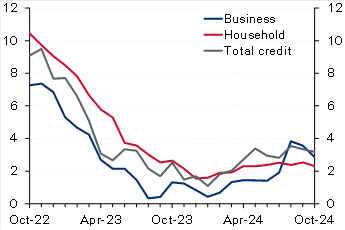
Growth in total GDP is set to remain on a positive trajectory in the near term, buoyed by further steady expansion in non-oil economic activity and increased oil production. Non-oil GDP is set to benefit from the government’s reform drive which includes the recent passing of the debt law that could catalyze the implementation of key development projects and the potential approval of the ‘mortgage’ law later in 2025, which could spur higher household borrowing and consumer spending. Economic indicators for Q2 2025 pointed to a healthy pace of non-oil economic activity. The key ‘output’ and ‘new orders’ balances in the non-oil private sector PMI gauge both averaged a very robust 57+ in Q2 2025, real estate activity continued to expand at a robust pace with earlier price falls in the residential sector abating, while credit growth stood at a healthy 5.5% y/y in May, and could benefit in coming months if interest rates are reduced further.
Nonetheless, there are also downside risks to the outlook. Local consumer spending growth (according to central bank card transactions data) turned negative in Q1 2025, extending the weakening trend now observed for more than a year. The government’s ongoing fiscal consolidation push will also weigh on wage and job growth. Overall, we see GDP growing 1.9% this year, boosted by expansions in both the oil and non-oil sectors of 1.2% and 2.5%, respectively.