Economics-Watching: Multivariate Core Trend Inflation

[from the Federal Reserve Bank of New York]

Overview

The Multivariate Core Trend (MCT) model measures inflation’s persistence in the seventeen core sectors of the personal consumption expenditures (PCE) price index.

Whether inflation is short-lived or persistent, concentrated in a few sectors or broad-based, is of deep relevance to policymakers. We estimate a dynamic factor model on monthly data for the major sectors of the personal consumption expenditures (PCE) price index to assess the extent of inflation persistence and its broadness. The results give a measure of trend inflation and shed light on whether inflation dynamics are dominated by a trend common across sectors or are sector-specific.

The New York Fed updates the MCT estimates and share sectoral insights at or shortly after 2 p.m. on the first Monday after the release of personal consumption expenditures (PCE) price index data from the Bureau of Economic Analysis. Data are available for download.

September 2023 Update

  • Multivariate Core Trend (MCT) inflation was 2.9 percent in September, a 0.3 percentage point increase from August (which was revised up from 2.5 percent). The 68 percent probability band is (2.4, 3.3).
  • Services ex-housing accounted for 0.54 percentage point (ppt) of the increase in the MCT estimate relative to its pre-pandemic average, while housing accounted for 0.50 ppt. Core goods had the smallest contribution, 0.03 ppt.
  • A large part of the persistence in housing and services ex-housing is explained by the sector-specific component of the trend.

Latest Release: 2:00 p.m. ET October 31, 2023

View the Multivariate Core Trend of PCE Inflation data here.

Frequently Asked Questions

What is the goal of the Multivariate Core Trend (MCT) analysis?

The New York Fed aims to provide a measure of inflation’s trend, or “persistence,” and identify where the persistence is coming from.

What data are reported?

The New York Fed’s interactive charts report monthly MCT estimates from 1960 to the present. The New York Fed also provides estimates of how much three broad sectors (core goods, core services excluding housing, and housing) are contributing to overall trend inflation over the same time span. The New York Fed further distinguishes whether the persistence owes to common or sector-specific components. Data are available for download.

What is the release schedule?

The New York Fed updates the estimate of inflation persistence and share sectoral insights following the release of PCE price data from the U.S. Bureau of Economic Analysis each month.

What is the modeling strategy?

A dynamic factor model with time-varying parameters is estimated on monthly data for the seventeen major sectors of the PCE price index. The model decomposes each sector’s inflation as the sum of a common trend, a sector-specific trend, a common transitory shock, and a sector-specific transitory shock. The trend in PCE inflation is constructed as the sum of the common and the sector-specific trends weighted by the expenditure shares.

The New York Fed uses data from all seventeen of the PCE’s sectors; however, in constructing the trend in PCE inflation, we exclude the volatile non-core sectors (that is, food and energy). The approach builds on Stock and Watson’s 2016 “Core Inflation and Trend Inflation.”

How does the MCT measure differ from the core personal consumption expenditures (PCE) inflation measure?

The core inflation measure simply removes the volatile food and energy components. The MCT model seeks to further remove the transitory variation from the core sectoral inflation rates. This has been key in understanding inflation developments in recent years because, during the pandemic, many core sectors (motor vehicles and furniture, for example) were hit by unusually large transitory shocks. An ideal measure of inflation persistence should filter those out.

PCE data are subject to revision by the Bureau of Economic Analysis (BEA). How does that affect MCT estimates?

BEA monthly revisions as well as other BEA periodic revisions to PCE price data do lead to reassessments of the estimated inflation persistence as measured by the MCT estimates. Larger revisions may lead to a more significant reassessment. A recent example of the latter case is described on Liberty Street Economics in “Inflation Persistence: Dissecting the News in January PCE Data.”

Historical estimates in our MCT data series back to 1960 are based on the latest vintage of data available and incorporate all prior revisions.

How does the MCT Inflation measure relate to other inflation measures?

The MCT model adds to the set of tools that aim at measuring the persistent component of PCE price inflation. Some approaches, such as the Cleveland Fed’s Median PCE and the Dallas Fed’s Trimmed Mean, rely on the cross-sectional distribution of price changes in each period. Other approaches, such as the New York Fed’s Underlying Inflation Gauge (UIG), rely on frequency-domain time series smoothing methods. The MCT approach shares some features with them, namely: exploiting the cross-sectional distribution of price changes and using time series smoothing techniques. But the MCT model also has some unique features that are relevant to inflation data. For example, it allows for outliers and for the noisiness of the data and for the relation with the common component to change over time.

How useful can MCT data be for policymakers?

The MCT model provides a timely measure of inflationary pressure and provides insights on how much price changes comove across sectors.

View the Multivariate Core Trend of PCE Inflation data here.

Economics-Watching: FedViews for January 2023

[from the Federal Reserve Bank of San Francisco]

Adam Shapiro, vice president at the Federal Reserve Bank of San Francisco, stated his views on the current economy and the outlook as of January 12, 2023.

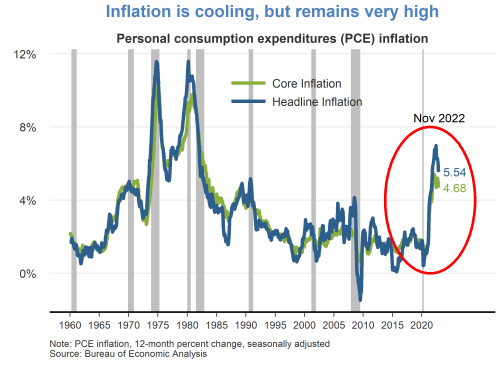
  • While continuing to cool over the last several months, 12-month inflation remains at historically high levels. The headline personal consumption expenditures (PCE) price index rose 5.5% in November 2022 from a year earlier. This marks a decline in inflation to a level last observed in October 2021, but still well above the Fed’s longer-run goal of 2%. A portion of the inflation moderation is attributable to recent declines in energy prices. Core PCE inflation, which removes food and energy prices, has shown less easing.
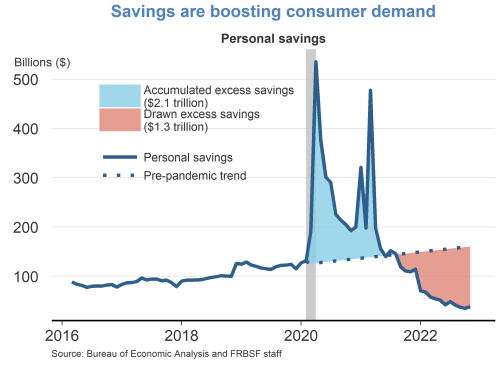
  • Owing to fiscal relief efforts and lower household spending over the course of the pandemic, consumers accumulated over $2 trillion dollars in excess savings, based on pre-pandemic trends. Since then, consumers have drawn down over half of this excess savings which has helped support recent growth in personal consumption expenditures. A considerable amount of accumulated savings remains for some consumers to support spending in 2023.
  • In the wake of the pandemic, consumer spending patterns shifted away from services towards goods. While there appears to be some normalization of spending behavior, this shift has generally persisted. Real goods spending remains significantly above its pre-pandemic trend, driven by strong demand for durables such as furniture, electronics, and recreational goods. Spending on services has shown a resurgence but remains below its pre-pandemic trend.
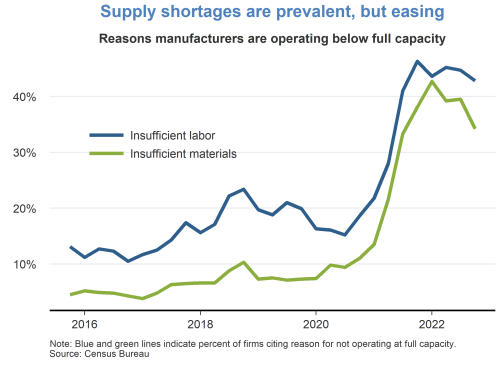
  • Supply chain bottlenecks for materials and labor remain a constraint on production, although there are some recent signs of easing. The fraction of manufacturers who reported operating below capacity due to insufficient materials peaked in late 2021 and has moderately declined over the past year. However, the fraction of manufacturers reporting insufficient labor has persisted at high levels.
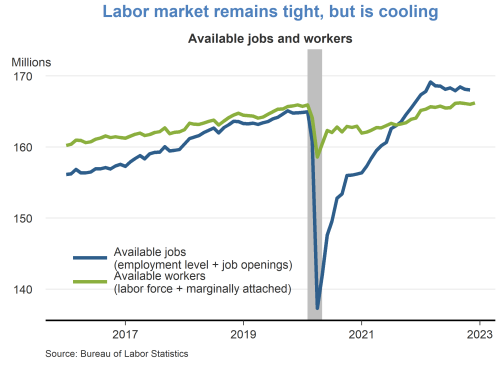
  • The labor market remains tight, despite some signs of cooling. The number of available jobs remains well above the number of available workers, although vacancy postings have been trending down in recent months. The tight labor market has put continued upward pressure on wages and labor market turnover.
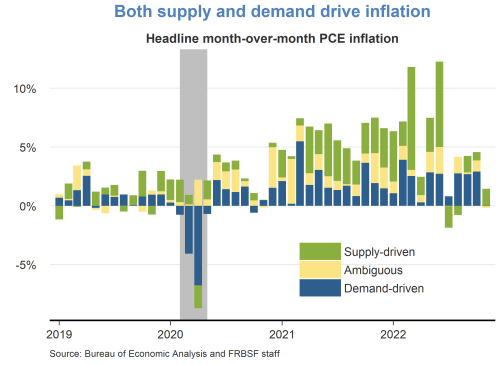
  • A decomposition of headline PCE inflation into supply– and demand-driven components shows that both supply and demand factors are responsible for the recent rise in inflation. The surge in inflation in early 2021 was mainly due to an increase in demand-driven factors. Subsequently, supply factors became more prevalent for the remainder of 2021. Supply-driven inflation has moderated significantly over recent months, while demand-driven inflation remains elevated.
  • The Federal Open Market Committee (FOMC) raised the federal funds rate by 50 basis points at the December meeting to a range of 4.25 to 4.5%. This cycle of continued rate increases since March of last year represents the fastest pace of monetary policy tightening in 40 years. The increase in the federal funds rate has been accompanied by a gradual reduction in the size of the Federal Reserve’s balance sheet.
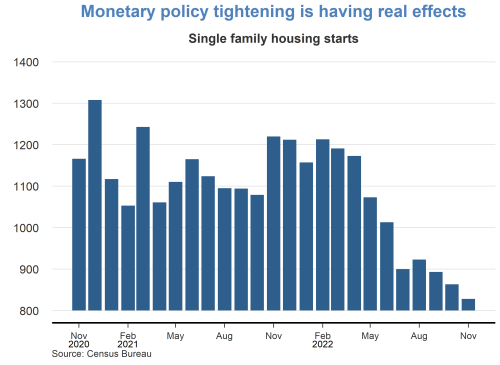
  • Economic activity in sectors such as housing, which is sensitive to rising interest rates, has slowed considerably in recent months. Housing starts have fallen steadily over the past year, as have other housing market indicators, such as existing home sales and house prices.
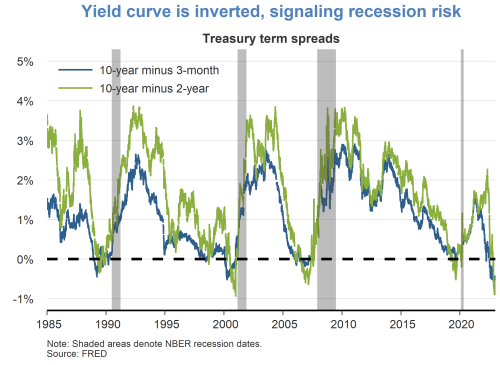
  • Although the labor market is currently very strong, financial markets are pointing to some downside risks. Namely, the difference between longer- and shorter-term interest rates has turned negative, which historically tends to occur immediately preceding recessions. It remains unclear whether lower longer-term yields are indicative of anticipated slower growth or lower inflation.
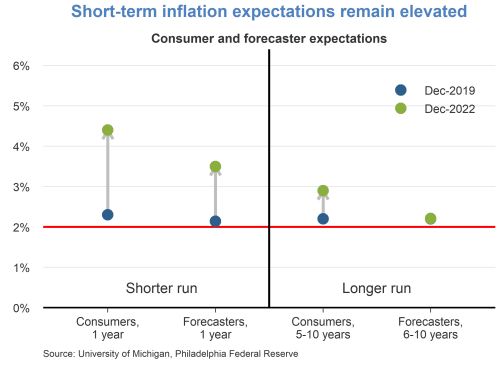
  • Short-term inflation expectations remain elevated relative to their pre-pandemic levels in December 2019. Consumers are expecting prices to rise 5% this year, while professional forecasters are expecting prices to rise 3.5%. Longer-term inflation expectations remain more subdued, indicating that both consumers and professionals believe inflation pressures will eventually dissipate.
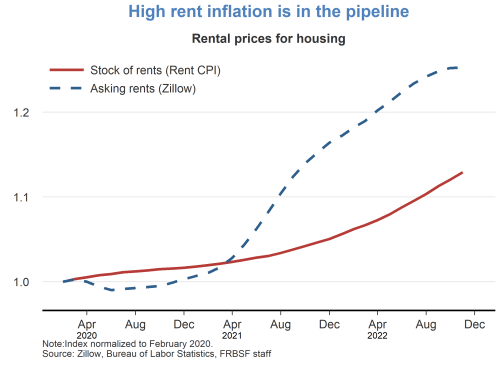
  • Rent inflation is expected to remain high over the next year. The prices for asking rents have grown quite substantially over the last two years. As new leases begin and existing leases are renewed, these higher asking rents will flow into the stock of rental units, putting upward pressure on rent inflation.
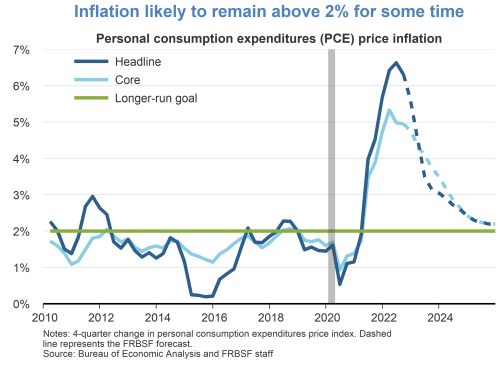
  • We are expecting inflation to moderate over the next few years as monetary policy continues to restrain demand and supply bottlenecks continue to ease. We anticipate that it will take some time for inflation to reach the Fed’s longer-run goal of 2%.
Inflation is cooling, but remains very high
Savings are boosting consumer demand
Goods consumption remains elevated
Supply shortages are prevalent, but easing
Labor market remains tight, but is cooling
Both supply and demand drive inflation
Monetary policy tightening is having real effects
Yield curve is inverted, signaling recession risk
Short-term inflation expectations remain elevated
High rent inflation is in the pipeline
Inflation likely to remain above 2% for some time

[Archived PDF]

Read other issues from FedViews.

Essay 55: Sharply-Focused and Informative Data for All Students

BEA News: Gross Domestic Product by Industry, 2nd quarter 2019 and annual update

The U.S. Bureau of Economic Analysis

The U.S. Bureau of Economic Analysis (BEA) has issued the following news release:

Professional, scientific, and technical services; real estate and rental and leasing; and mining were the leading contributors to the increase in U.S. economic growth in the second quarter of 2019.

The private goods‐ and services‐producing industries, as well as the government sector, contributed to the increase. Overall, 14 of 22 industry groups contributed to the 2.0 percent increase in real GDP in the second quarter.

The full text of the release [archived PDF] on BEA’s website can be found here.

The Bureau of Economic Analysis provides this service to you at no charge.  Visit us on the Web at www.bea.gov.  All you will need is your e-mail address. If you have questions or need assistance, please e-mail subscribe@bea.gov.