Economics-Watching: Kuwait’s Banking Sector Posts Solid Credit Growth in October

[from NBK Group’s Economic Research Department, 21 November, 2024]

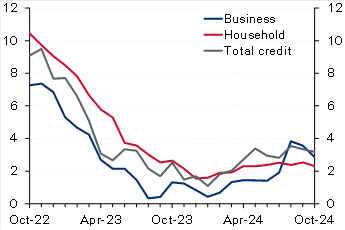
Kuwait: Solid credit growth in October driven by household credit. Domestic credit increased by a solid 0.4% in October, driving up YTD growth to 2.9% (3.2% y/y). The recovery in household credit continued, with growth in October at a solid 0.5%, resulting in a YTD increase of 2.4%. While y/y growth in household credit remains a limited 2.3%, annualized growth over the past four months is a stronger 4.7%. Business credit inched up by 0.2% in October, pushing YTD growth to 3.6% (2.9% y/y). Industry and trade drove business credit growth in October while construction and trade are the fastest growing YTD at 17% and 8%, respectively. In contrast, the oil/gas sector continued its downtrend, deepening the YTD decrease to 13%. Excluding the oil/gas sector, growth in business credit would increase to a relatively good 5% YTD. Looking ahead, the last couple of months of the year (especially December) are usually the weakest for business credit, likely due to increased repayments and write-offs, but it will not be surprising if the recovery in household credit is generally sustained, especially given the commencement of the interest rate-cutting cycle. Meanwhile, driven by a plunge in the volatile public-institution deposits, resident deposits decreased in October, resulting in YTD growth of 2.4% (4.2% y/y). Private-sector deposits inched up in October driving up YTD growth to 4.5% compared with 10% for government deposits while public-institution deposits are a big drag (-14%). Within private-sector KD deposits, CASA showed further signs of stabilization as there was no decrease for the third straight month while the YTD drawdown is a limited 1%.

Chart 1: Kuwait credit growth

(% y/y)
Source: Central Bank of Kuwait (CBK)
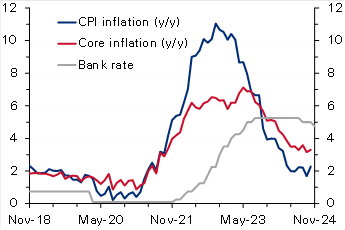
Chart 2: UK inflation

(%)

Source: Haver

Egypt: IMF concludes mission for fourth review, sees external risks. The IMF concluded its visit to Egypt after spending close to 2 weeks, holding several in-person meetings with the Egyptian authorities, private sector, and other stakeholders. The IMF released a statement mentioning that the current ongoing geopolitical tensions in the region in addition to an increasing number of refugees have affected the external sector (Suez Canal receipts down by 70%) and put severe pressure on the fiscal front. The Fund acknowledged the Central Bank of Egypt’s commitment to unify the exchange rate, maintain the flexible exchange rate regime, and keep inflation on a firm downward trend over the medium term by substantially tightening monetary policy. It also highlighted that continued policy discipline was also a key to containing fiscal risks, especially those related to the energy sector. The Fund, as always, re-iterated the need for promoting the private sector mainly through an enhanced tax system and accelerating divestment plans of the state firms. Finally, it also said that the discussions would continue over the coming days to finalize the agreement on the remaining policies and reform plans. However, the release did not provide any clear hints about the conclusion on the government’s earlier request to push the timeline of some of the subsidy moves.

Oman: IMF completes article IV with a strong outlook for the economy in 2025. Oman’s economy continued to expand with growth reaching 1.9% in the first half of 2024 (versus 1.2% in 2023), despite being weighed down by OPEC+ mandated oil production cuts as non-oil GDP grew a stronger 3.8% y/y in H1 (versus 1.8% in 2023). The fiscal and current account balances remain in a comfortable situation evident by a decline in public sector debt and the recent rating upgrade to investment grade. The Fund expects Oman’s economic growth to see a strong rebound in 2025, supported by higher oil production. It also believes that fiscal and current account balances will remain in surplus but at lower levels. Key risks to the outlook stem from oil price volatility and intensifying geopolitical tensions. The IMF also mentioned that further efforts are needed to raise nonhydrocarbon revenues through more tax policy measures and the phasing out of untargeted subsidies which should help in freeing up resources to finance growth under the government’s diversification agenda.

UK: Inflation rises more than forecast, reinforcing BoE’s caution on rate cuts. UK CPI inflation increased to 2.3% y/y in October from 1.7% the previous month, slightly above the market and the Bank of England’s forecast of 2.2%. On a monthly basis too, inflation rose to 0.6%, a seven-month high, from September’s no change. The steep rise was mainly driven by an almost 10% rise in the household energy price cap effective from October. Core inflation also accelerated to 3.3% y/y (0.4% m/m) from 3.2% (0.1% m/m). While goods prices continued to fall (-0.3% y/y), service prices rose at a faster rate of 5% from 4.9%. Recently, the Bank of England had cautioned about inflation quickening next year (projecting a peak rate of 2.8% in Q3 2025), citing the impact of higher insurance contributions and rising minimum wages as outlined in the latest government budget. Therefore, with inflation rising above forecast, the bank will likely slow the pace of monetary easing after delivering two interest rate cuts of 25 bps earlier, with markets now seeing only two additional cuts by the end of 2025.

Eurozone: ECB warns of fiscal and growth risks in its latest Financial Stability Review [archived PDF]. In its most recent Financial Stability Review (November) [archived PDF], the European Central Bank warned that elevated debt and fiscal deficit levels and anemic long-term growth could expose sovereign debt vulnerabilities in the region, stoking concerns of a repeat of the 2011 sovereign debt crisis. Maturing debt being rolled over at much higher borrowing rates raising debt service costs poses risks to countries with little fiscal space and leaves certain governments exposed to market fluctuations. The bank also emphasized the risks of high equity valuations, low liquidity and a greater concentration of exposure among non-banks. Moreover, it sees current geopolitical uncertainties and the possibility of more trade tensions as heightening risks. The Eurozone’s current government debt-to-GDP ratio stands at 88%, but the underlying data suggest a much more precarious situation with Greece, Italy, and France’s ratios at 164%, 137% and 112%. Recently, concerns about France’s high fiscal deficit (around 5.9% of GDP) and elevated debt levels saw yields on the country’s bonds rise steeply, widening the spread gap with German bonds to the highest level in over a decade.

Stock marketsIndexDaily Change (%)YTD Change (%)
Regional
Abu Dhabi (ADI)9,405-0.23-1.80
Bahrain (ASI)2,043-0.373.62
Dubai (DFMGI)4,7610.6117.26
Egypt (EGX 30)30,588-0.33 23.18
GCC (S&P GCC 40)7090.09-0.52
Kuwait (All Share)7,353-0.087.86
KSA (TASI)11,868-0.07-0.83
Oman (MSM 30)4,6090.002.10
Qatar (QE Index)10,4380.12-3.62
International
CSI 3003,9860.2216.17
DAX19,005-0.2913.45
DJIA43,4080.3215.17
Eurostoxx 504,730-0.454.60
FTSE 1008,085-0.174.55
Nikkei 22538,352-0.1614.61
S&P 5005,9170.0024.05
3m interbank rates%Daily Change (bps)YTD Change (bps)
Bahrain5.86-1.29-66.34
Kuwait3.940.00-37.50
Qatar6.000.00-25.00
UAE4.433.81-89.96
Saudi5.50-4.75-73.14
SOFR4.52-0.09-81.13
Bond yields%Daily Change (bps)YTD Change (bps)
Regional
Abu Dhabi 20274.665.0033.9
Oman 20275.496.0033.0
Qatar 20264.686.0016.1
Kuwait 20274.693.0035.0
Saudi 20284.961.0043.9
International 10-year
US Treasury4.411.7755.3
German Bund2.340.3531.2
UK Gilt4.472.6093.0
Japanese Gov’t Bond1.071.045.4
Exchange ratesRateDaily Change (%)YTD Change (%)
KWD per USD0.310.04-0.05
KWD per EUR0.32-0.46-1.98
USD per EUR1.05-0.49-4.47
JPY per USD155.430.5010.19
USD per GBP1.27-0.25-0.62
EGP per USD49.670.3461.00
Commodities$/unitDaily Change (%)YTD Change (%)
Brent crude72.81-0.68-5.49
KEC73.780.74-7.26
WTI68.87-0.75-3.88
Gold2,648.20.8028.40

Disclaimer: While every care has been taken in preparing this publication, National Bank of Kuwait accepts no liability whatsoever for any direct or consequential losses arising from its use. Daily Economic Update is distributed on a complimentary and discretionary basis to NBK clients and associates. This report and previous issues can be found in the “News & Insight / Economic Reports” section of the National Bank of Kuwait’s web site. Please visit their web site, nbk.com, for other bank publications.
FRBSF Economic Letter: Can Monetary Policy Tame Rent Inflation?

[from the Federal Reserve Bank of San Francisco Economic Letter]

by Zheng Liu and Mollie Pepper

Rent inflation has surged since early 2021. Because the cost of housing is an important component of total U.S. consumer spending, high rent inflation has contributed to elevated levels of overall inflation. Evidence suggests that, as monetary policy tightening cools housing markets, it can also reduce rent inflation, although this tends to adjust relatively slowly. A policy tightening equivalent to a 1 percentage point increase in the federal funds rate could reduce rent inflation as much as 3.2 percentage points over 2½ years.

“We’ve had a time of red-hot housing market all over the country… Shelter inflation is going to remain high for some time. We’re looking for it to come down, but it’s not exactly clear when that will happen. Hope for the best, plan for the worst.”

Federal Reserve Chair Jerome Powell (2022)

The rapid run-up of shelter costs—both house prices and rents—during the recovery from the pandemic has raised questions about how inflation pressures might affect housing affordability. Since March 2022, the Federal Reserve has rapidly lifted its federal funds rate target from near zero to over 4%, and policymakers have signaled that they are open to keeping the monetary policy stance sufficiently restrictive to return inflation to the longer-run goal of 2% on average. The tightened financial conditions following those policy changes, especially the surge in mortgage interest rates, have helped cool house price growth. However, rent inflation remains elevated.

This Economic Letter examines the effectiveness of monetary policy tightening for reducing rent inflation. We estimate that, during the period from 1988 to 2019, a policy tightening equivalent to a 1 percentage point increase in the federal funds rate can reduce rent inflation—measured by 12-month percentage changes in the personal consumption expenditures (PCE) housing price index—by about 3.2 percentage points, but the full impact takes about 2½ years to materialize. Based on housing costs’ share in total PCE, this translates to a reduction in headline PCE inflation of about 0.5 percentage point over the same time horizon.

Rising housing costs

Following the COVID-19 recession, house prices and rents both surged in the United States. For example, the 12-month growth rate of Standard & Poor’s CoreLogic Case-Shiller Home Price Index accelerated from about 10% in December 2020 to over 20% in March 2022. After the Federal Reserve started raising the target for the federal funds rate in March, house price growth has slowed significantly, to about 9% in October 2022.

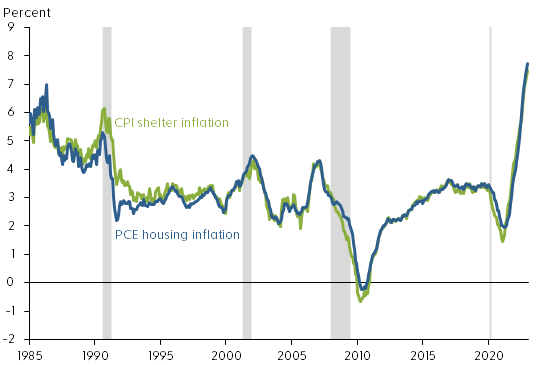
Rent inflation also accelerated during the pandemic period. Figure 1 shows that rent inflation—measured using 12-month changes in the PCE housing price index and including rents for tenant-occupied housing and imputed rents for owner-occupied housing—rose from a low point of about 2% in early 2021 to 7.7% by December 2022, the highest level since 1986. During the same period, rent inflation measured by 12-month changes in the shelter component of the consumer price index (CPI) experienced a similar increase. Thus, following the tightening of monetary policy, house price growth has slowed but rent inflation continues to rise.

Figure 1: PCE and CPI measures of rent inflation
Source: Bureau of Economic Analysis, Bureau of Labor Statistics, and Haver Analytics.
Note: Twelve-month percentage changes. Gray shading indicates NBER recession dates.

Economic theory suggests that some common forces such as changes in housing demand can drive both rents and house prices. For example, the expansion of remote work since the COVID-19 pandemic has increased demand for housing, raising both house prices and rents (Kmetz, Mondragon, and Wieland 2022). To the extent that the stream of current and future rents reflects the fundamental value of a house, house prices can be a leading indicator of future rent inflation (Lansing, Oliveira, and Shapiro 2022). Thus, monetary policy can affect both house prices and rents by cooling housing demand.

Housing demand responds to changes in financial conditions, such as increases in mortgage interest rates. However, theory suggests that house prices are more sensitive than rental prices to changes in financial conditions, because home purchases typically require longer-term mortgage financing. In addition, unlike rents, house prices can be partly driven by investor sentiments or beliefs, which explains the observed larger swings in house prices than in rents over business cycles (Dong et al. 2022). Long-term rental contracts can also contribute to slow adjustments in rent inflation.

Rent inflation is an important contributor to overall inflation because housing costs are an important component of total consumption expenditures. On average, housing expenditures represent about 15% of total PCE and 25% of the services component of PCE. In CPI, shelter costs represent an even larger share, accounting for about 30% of total consumption of all urban consumers and about 40% of core consumption expenditures excluding volatile food and energy components.

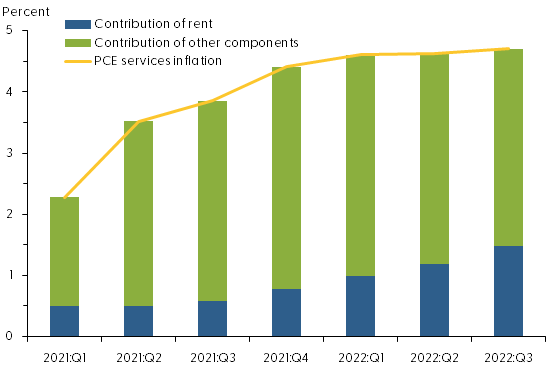
The contribution of rent inflation to overall PCE inflation has increased since early 2021. As Figure 2 shows, in the first quarter of 2021, rent inflation accounted for about 22% of the four-quarter change in the PCE services price index, excluding energy: 0.5 of the 2.3 percentage points increase in service prices was attributable to rent inflation. By the third quarter of 2022, the contribution of rent inflation had climbed to about one-third, or 1.5 of the 4.7 percentage point increase in service prices.

Figure 2: Rising contribution of rent inflation to services inflation
Source: Bureau of Economic Analysis, Haver Analytics, and authors’ calculations.
Note: Four-quarter changes in PCE services price index excluding energy.

Measuring policy effects

Given the rising contribution of rent inflation to overall inflation, it is important to assess the quantitative effects of monetary policy tightening on rent inflation.

For our analysis, we use a measure of monetary policy surprises constructed by Bauer and Swanson (2022). Their measure focuses on high-frequency changes in financial market indicators within a short period surrounding the Federal Open Market Committee (FOMC) policy announcements. If the public fully anticipates a policy change, then the financial market would not react to new policy announcements. However, if the market does react to an announcement, then the policy change must contain a surprise element. Thus, changes in financial market indicators, such as the price of Eurodollar futures, in a narrow window around an FOMC announcement can capture policy surprises. In practice, however, the data constructed this way are not complete surprises because they can be predicted by some macro and financial variables shortly before FOMC announcements. We follow the approach of Bauer and Swanson (2022) to purge the influences of those macro and financial variables from the measure of policy surprises. We use the resulting quarterly time series to measure monetary policy shocks, with a sample period from 1988 to 2019.

We then use a local projections model—a statistical tool proposed by Jordà (2005)—to project how rent inflation responds over time to a tightening of monetary policy equivalent to a 1 percentage point unanticipated increase in the federal funds rate in a given quarter. The model takes into account how monetary policy shocks interact with other macroeconomic variables, including lags of rent inflation, real GDP growth, and core PCE inflation.

In the final step, we compute the responses of rent inflation relative to its preshock level over a period up to 20 quarters after the initial increase in the federal funds rate.

Gradual impact of policy tightening on rent inflation

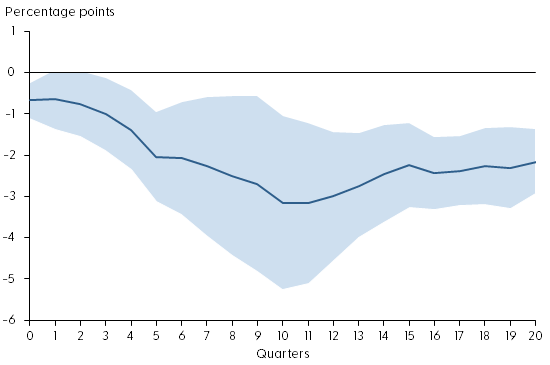
Figure 3 shows the response of rent inflation during the first 20 quarters after an unanticipated tightening of monetary policy (solid blue line). The shaded area shows the confidence band, indicating the statistical uncertainty in estimating the responses. Under the assumption that the model is correct, the shaded area contains the actual value of the rent inflation responses to the monetary policy shock roughly two-thirds of the time. The policy shock is normalized such that it is equivalent to a 1 percentage point unanticipated increase in the federal funds rate.

Figure 3: Response of rent inflation to monetary policy tightening
Source: Bureau of Economic Analysis, Bauer and Swanson (2022), and authors’ calculations.
Note: Response of rent inflation to a monetary policy shock equivalent to a 1 percentage point surprise increase in the federal funds rate. Shaded region shows 68% confidence band around the estimate.

The figure shows that monetary policy tightening has significant and gradual effects on rent inflation. On impact, a 1 percentage point increase in the federal funds rate reduces rent inflation about 0.6 percentage point relative to its preshock level. Over time, rent inflation declines gradually, falling about 3.2 percentage points in the 10 quarters following the impact. The slow adjustment in rent inflation partly reflects the stickiness in nominal rents due to long-term rental contracts. Since housing expenditures account for about 15% of total PCE, this estimate translates to a reduction in headline PCE inflation of about 0.5 percentage point, stemming from the decline in rent inflation over a period of 2½ years.

The rent component of PCE is measured based on average rents, including those locked in long-term rental contracts, which are slow to adjust to changes in economic and financial conditions. Rents on new leases, however, are more flexible. For example, the 12-month growth in Zillow’s observed rent index, which measures changes in asking rents on new leases, has slowed significantly since March 2022 (see Figure 4). Asking rents are typically a leading indicator of future average rents. Thus, the slowdown in asking rent growth could portend lower future rent inflation.

Figure 4: Year-over-year observed rent growth starting to slow
Source: Zillow and Haver Analytics.
Note: Twelve-month percentage changes in Zillow’s observed rent index. Gray shading indicates NBER recession dates.

Conclusion

Rents are an important component of consumer expenditures. Recent surges in rent inflation have led to concerns that overall inflation might stay persistently high despite tightening of monetary policy. We present evidence that monetary policy tightening is effective for reducing rent inflation, although the full impact takes time to materialize. A policy tightening equivalent to a 1 percentage point increase in the federal funds rate can reduce rent inflation up to 3.2 percentage points over the course of 2½ years. This translates to a maximum reduction in headline PCE inflation of about 0.5 percentage point over the same time horizon. Although average rents are slow to respond to policy changes, growth of asking rents on new leases has started to slow following recent monetary policy tightening. Our finding suggests that this tightening will gradually bring rent inflation down over time, thereby helping to reduce overall inflation.

Zheng Liu — Vice President and Director of the Center for Pacific Basin Studies, Economic Research Department, Federal Reserve Bank of San Francisco

Mollie Pepper — Research Associate, Economic Research Department, Federal Reserve Bank of San Francisco

[Archived PDF]