At the same time, economists have been documenting the loss of work opportunities and earning power by workers without college degrees as manufacturingemployment has declined. In 2013, David Autor, David Dorn, and Gordon Hanson published a study that estimated the labor market impacts resulting from increased trade competition following China’s entrance into the World Trade Organization, an effect often referred to as the “China shock.” Dozens of studies have since used the regional variation in job and income losses caused by the China shock to measure the adverse impacts of job displacement on family structures, crime, health, and other social indicators. Some supporters of industrial subsidies and higher tariffs have expressed the hope that these dynamics can be put into reverse.
Fourth District contacts reported a slight increase in overall business activity in recent weeks and expected activity to rise modestly in the months ahead. Consumer spending was flat, with retailers noting continued affordability concerns among consumers. Manufacturers also reported flat demand for goods, citing trade policy uncertainty as the main driver. Demand for professional and business services grew moderately, albeit at a slower pace than in the past three reporting periods. Contacts generally reported flat employment levels and modest wage pressures. Nonlabor cost pressures remained robust, and selling prices continued to grow modestly.
The neutralinterest rate (r-star) is an important input in monetary policy discussions and is commonly used to assess the stance of monetary policy. This Economic Commentary presents estimates of the neutralinterest rate from a recently developed model and provides a high-level description of this new model. With data through 2025:Q2, the model estimates the implied (medium-run) nominal neutralinterest rate to be 3.7 percent, with a 68 percent coverage band ranging from 2.9 percent to 4.5 percent. Given that the effective nominal federal funds rate is currently in the range of 4.25 percent to 4.5 percent, this model estimates with a high level of certainty (77 percent probability) that the policy stance is in restrictive territory.
by Hamza Abdelrahman, Luiz Edgard Oliveira and Aditi Poduri
Information the San Francisco Fed collects from businesses and community sources for the Beige Book provides timely insights into economic activity at both the national and regional levels. Two new indexes based on Beige Book questionnaire responses track business sentiment across the western United States. The indexes track data on economic activity and inflation, serving as early indicators of official data releases and helping improve near-term forecasting accuracy. The latest index readings suggest weakening economic growth and intensifying inflationary pressures over the coming months.
This Economic Letter examines the economic information collected through the SF Fed’s Beige Book questionnaire over the past 10-plus years. We analyze this information by constructing sentiment indexes from the qualitative data and comparing them with quantitative measures of national and regional economic activity and inflation. We introduce two indexes—the SF Fed Business Sentiment Index and the SF Fed Inflation Gauge Index—which track our contacts’ views and expectations for economic growth and inflation, respectively. We find that these new indexes serve as reliable early indicators of official data releases and help improve near-term forecast accuracy. The SF Fed Business Sentiment Index has generally exhibited patterns similar to other recent business and household sentiment indexes, and the SF Fed Inflation Gauge Index has shown a strong uptick in expected inflation. To regularly monitor changes in these two indexes, the San Francisco Fed has launched a new Twelfth District Business Sentiment data page.
Constructing regional sentiment indexes
The San Francisco Fed sends out a Beige Book questionnaire to business and community contacts across the District eight times a year to gather regional information. In addition to answering questions regarding their organizations, respondents share their views on regional and national topics, including economic activity and inflationary pressures.
In two questions, respondents indicate whether they see national output growth and inflation rates increasing, decreasing, or staying stable over the coming year using a standard five-tiered scale. We use these responses since 2014 to formulate two business sentiment indexes, one on economic activity and another on inflation. We assign standard weights to the five-tiered qualitative scale that are symmetrical around zero. For example, we ask if activity is expected to “decrease significantly” = –2, “decrease” = –1, “remain unchanged” = 0, “increase” = 1, or “increase significantly” = 2. We add up the weighted shares of responses for each tier within each index. We then normalize each resulting series by its own average and standard deviation for ease of comparison with traditional economic indicators.
Tracking business sentiment
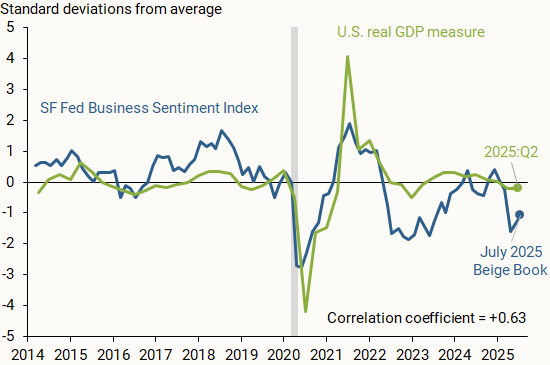
Figure 1 shows how the SF Fed Business Sentiment Index (blue line), compiled from responses to the question on national economic activity, compares with data on changes in national GDP (green line). We measure national output as the four-quarter change in inflation-adjusted, or real, GDP, normalized by its average and standard deviation so that it is centered around zero and, hence, more directly comparable to the SF Fed Business Sentiment Index. The vertical axis shows how many standard deviations away each observation is from its respective measure’s average from 2014 to mid-2025.
Figure 1 Economic growth versus business sentiment
The SF Fed Business Sentiment Index generally tracks the movements in national GDP over the past decade; a correlation coefficient of +0.63 on a scale of –1 to 1 indicates a moderately strong positive relationship between the two measures. A relatively recent exception started in 2022, when our index began showing a considerable decline relative to the national GDP measure. Respondents across the District were downbeat about economic growth and reported expectations of a sharp decline in consumer spending and overall household financial health following the depletion of pandemic-era savings (Abdelrahman and Oliveira 2023). A similar decline appeared in other measures of business and household sentiment. Nevertheless, overall economic growth continued at a solid pace. This decoupling between sentiment and hard data that began in 2022 was dubbed a “vibecession” (Daly 2024, Scanlon 2022).
Another possible reason for the divergence between national real GDP and our Business Sentiment Index is the influence of the regional economy. Although respondents are asked about their views of national GDP, their responses may be affected by regional outcomes. Thus, our index may also reflect a regional perspective from our business and community contacts.
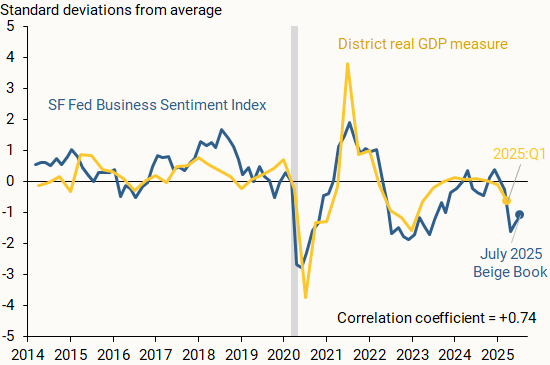
Figure 2 supports this rationale, showing the SF Fed Business Sentiment Index alongside a measure of regional output growth (gold line). We find that the measures closely track one another, including for 2022 and 2023, with a correlation coefficient of +0.74. We define District real GDP growth as the year-over-year percent change in the total output of the District’s nine states as reported by the Bureau of Economic Analysis (BEA). We normalize the series as described before.
Figure 2 Regional economic growth and business sentiment
Our findings indicate that the SF Fed Business Sentiment Index can serve as an accurate early indicator for national and regional output growth. Since the regional Beige Book questionnaire is collected twice each quarter, it provides particularly timely insights into economic activity during the current quarter. By contrast, the first GDP data release for any given quarter usually arrives a full month after that quarter has ended, and initial data releases for state-level output growth arrive with even more delay.
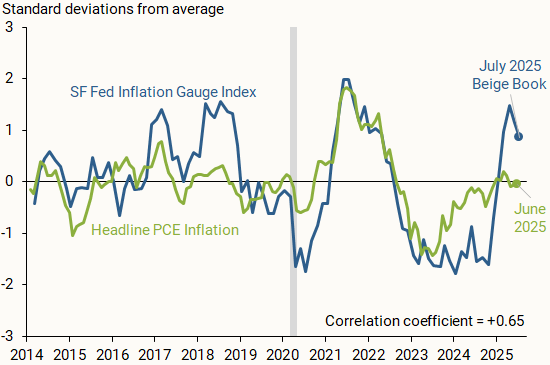
Our Beige Book questionnaire responses also provide insights into how business and community contacts in the District see national inflation evolving. Figure 3 compares the SF Fed Inflation Gauge Index (blue line) with monthly changes in the year-over-year headline personal consumption expenditures (PCE) inflation rate published by the BEA (green line). We normalize the inflation series and index as discussed earlier.
Figure 3 SF Fed Inflation Gauge Index versus realized inflation
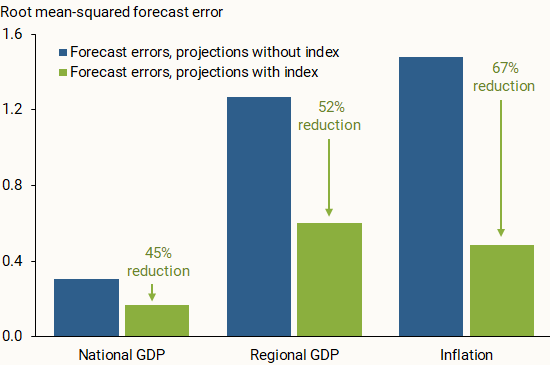
Beyond tracking data on national and regional economic conditions, we consider whether our two indexes can help improve one-year-ahead projections of output growth and overall inflation. We run linear regressions on a 2014–2022 data sample and estimate out-of-sample projections for the period starting in the first quarter of 2023. We run this analysis for the three economic measures—national GDP, regional GDP, and inflation—once with our index included on the right-hand side of the regression equation and once without the index. For this analysis, we use versions of the SF Fed Business Sentiment Index and the SF Fed Inflation Gauge Index that have been aggregated quarterly.
Figure 4 compares the out-of-sample projection accuracy of the two iterations. Across all economic measures, incorporating the SF Fed Business Sentiment Index or the SF Fed Inflation Gauge Index in the regression noticeably reduced the forecast errors for the out-of-sample period. This general result appears to hold when we project output growth and inflation one quarter ahead, in line with other studies that incorporate soft data from the Beige Book in short-term projections (Balke and Petersen 2002). The results are also consistent when using a local projections method from Jordà (2005) for one-year-ahead projections of output growth and shorter-term projections of inflation. This further supports the usefulness of our qualitative measures as early indicators of the future economic landscape over the short term.
Figure 4 Forecast errors with and without SF Fed sentiment indexes
Information collected from businesses and communities through the San Francisco Fed’s regional Beige Book questionnaire can provide valuable insights into the national and regional economies. Sentiment indexes described in this Letter use responses from Twelfth District Beige Book contacts to generally track economic activity and inflation. Our two indexes serve as reliable early indicators of official data, which could help improve near-term forecast accuracy. The SF Fed Business Sentiment Index remained negative for much of 2022 and 2023, possibly reflecting more subdued growth within the District relative to the United States. Meanwhile, the SF Fed Inflation Gauge Index spiked in recent months following adjustments to trade policy.
Whether inflation is short-lived or persistent, concentrated in a few sectors or broad-based, is of deep relevance to policymakers. We estimate a dynamic factor model on monthly data for the major sectors of the personal consumption expenditures (PCE) price index to assess the extent of inflation persistence and its broadness. The results give a measure of trend inflation and shed light on whether inflation dynamics are dominated by a trend common across sectors or are sector-specific.
Multivariate Core Trend (MCT) inflation was 2.9 percent in September, a 0.3 percentage point increase from August (which was revised up from 2.5 percent). The 68 percent probability band is (2.4, 3.3).
Services ex-housing accounted for 0.54 percentage point (ppt) of the increase in the MCT estimate relative to its pre-pandemic average, while housing accounted for 0.50 ppt. Core goods had the smallest contribution, 0.03 ppt.
A large part of the persistence in housing and services ex-housing is explained by the sector-specific component of the trend.
What is the goal of the Multivariate Core Trend (MCT) analysis?
The New York Fed aims to provide a measure of inflation’s trend, or “persistence,” and identify where the persistence is coming from.
What data are reported?
The New York Fed’s interactive charts report monthly MCT estimates from 1960 to the present. The New York Fed also provides estimates of how much three broad sectors (core goods, core services excluding housing, and housing) are contributing to overall trend inflation over the same time span. The New York Fed further distinguishes whether the persistence owes to common or sector-specific components. Data are available for download.
A dynamic factor model with time-varying parameters is estimated on monthly data for the seventeen major sectors of the PCE price index. The model decomposes each sector’s inflation as the sum of a common trend, a sector-specific trend, a common transitory shock, and a sector-specific transitory shock. The trend in PCEinflation is constructed as the sum of the common and the sector-specific trends weighted by the expenditure shares.
How does the MCT measure differ from the core personal consumption expenditures (PCE) inflation measure?
The core inflation measure simply removes the volatile food and energy components. The MCT model seeks to further remove the transitory variation from the core sectoralinflation rates. This has been key in understanding inflation developments in recent years because, during the pandemic, many core sectors (motor vehicles and furniture, for example) were hit by unusually large transitory shocks. An ideal measure of inflation persistence should filter those out.
PCE data are subject to revision by the Bureau of Economic Analysis (BEA). How does that affect MCT estimates?
Historical estimates in our MCT data series back to 1960 are based on the latest vintage of data available and incorporate all prior revisions.
How does the MCT Inflation measure relate to other inflation measures?
The MCT model adds to the set of tools that aim at measuring the persistent component of PCE price inflation. Some approaches, such as the Cleveland Fed’s Median PCE and the Dallas Fed’s Trimmed Mean, rely on the cross-sectional distribution of price changes in each period. Other approaches, such as the New York Fed’s Underlying Inflation Gauge (UIG), rely on frequency-domain time series smoothing methods. The MCT approach shares some features with them, namely: exploiting the cross-sectional distribution of price changes and using time series smoothing techniques. But the MCT model also has some unique features that are relevant to inflation data. For example, it allows for outliers and for the noisiness of the data and for the relation with the common component to change over time.
How useful can MCT data be for policymakers?
The MCT model provides a timely measure of inflationary pressure and provides insights on how much price changes comove across sectors.
You must register in advance to attend. Upon registering, you will receive a confirmation email containing additional instructions to join the virtual meeting and a way to add it to your calendar.