[from the Federal Reserve Bank of San Francisco, Economic Letters, 11 August, 2025]
by Hamza Abdelrahman, Luiz Edgard Oliveira and Aditi Poduri
Information the San Francisco Fed collects from businesses and community sources for the Beige Book provides timely insights into economic activity at both the national and regional levels. Two new indexes based on Beige Book questionnaire responses track business sentiment across the western United States. The indexes track data on economic activity and inflation, serving as early indicators of official data releases and helping improve near-term forecasting accuracy. The latest index readings suggest weakening economic growth and intensifying inflationary pressures over the coming months.
The San Francisco Fed serves the 12th District—the largest in the Federal Reserve System, representing nine western states, two territories, and a commonwealth. To better understand and analyze the regional economy, we collect information from a variety of business and community sources to create the San Francisco Fed’s report for the Beige Book. This is compiled with reports from other Districts and published by the Federal Reserve Board of Governors eight times a year.
Views about the economy from businesses and communities play an important role in shaping economic outcomes. For example, expectations for future inflation can help spur or slow current consumer spending and business investment. Furthermore, economic forecasters rely on models that incorporate both more traditional “hard” quantitative data and “soft” qualitative information on sentiment. Adding these soft measures has been shown to improve the accuracy of economic forecasts (see Shapiro, Moritz, and Wilson 2022 and their cited literature). Among the many sentiment measures available, two popular approaches rely on survey data, as in the University of Michigan’s Surveys of Consumers, or on textual analysis, as in the SF Fed’s Daily News Sentiment Index.
This Economic Letter examines the economic information collected through the SF Fed’s Beige Book questionnaire over the past 10-plus years. We analyze this information by constructing sentiment indexes from the qualitative data and comparing them with quantitative measures of national and regional economic activity and inflation. We introduce two indexes—the SF Fed Business Sentiment Index and the SF Fed Inflation Gauge Index—which track our contacts’ views and expectations for economic growth and inflation, respectively. We find that these new indexes serve as reliable early indicators of official data releases and help improve near-term forecast accuracy. The SF Fed Business Sentiment Index has generally exhibited patterns similar to other recent business and household sentiment indexes, and the SF Fed Inflation Gauge Index has shown a strong uptick in expected inflation. To regularly monitor changes in these two indexes, the San Francisco Fed has launched a new Twelfth District Business Sentiment data page.
Constructing regional sentiment indexes
The San Francisco Fed sends out a Beige Book questionnaire to business and community contacts across the District eight times a year to gather regional information. In addition to answering questions regarding their organizations, respondents share their views on regional and national topics, including economic activity and inflationary pressures.
In two questions, respondents indicate whether they see national output growth and inflation rates increasing, decreasing, or staying stable over the coming year using a standard five-tiered scale. We use these responses since 2014 to formulate two business sentiment indexes, one on economic activity and another on inflation. We assign standard weights to the five-tiered qualitative scale that are symmetrical around zero. For example, we ask if activity is expected to “decrease significantly” = –2, “decrease” = –1, “remain unchanged” = 0, “increase” = 1, or “increase significantly” = 2. We add up the weighted shares of responses for each tier within each index. We then normalize each resulting series by its own average and standard deviation for ease of comparison with traditional economic indicators.
Tracking business sentiment
Figure 1 shows how the SF Fed Business Sentiment Index (blue line), compiled from responses to the question on national economic activity, compares with data on changes in national GDP (green line). We measure national output as the four-quarter change in inflation-adjusted, or real, GDP, normalized by its average and standard deviation so that it is centered around zero and, hence, more directly comparable to the SF Fed Business Sentiment Index. The vertical axis shows how many standard deviations away each observation is from its respective measure’s average from 2014 to mid-2025.
Figure 1
Economic growth versus business sentiment
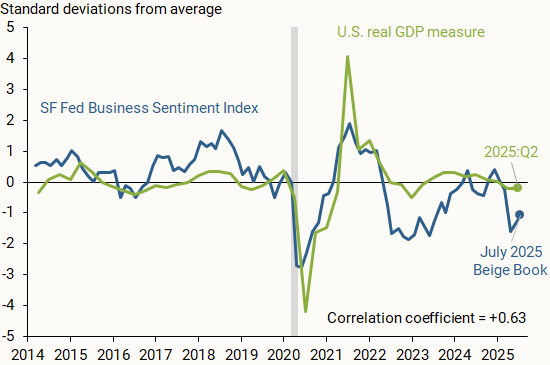
Notes: Indicators normalized by their respective averages and standard deviations based on data from 2014 to present. Gray bar indicates NBER recession dates. Correlation coefficient is calculated between quarterly versions of both indicators.
Source: Bureau of Economic Analysis, FRBSF Beige Book questionnaire responses, and authors’ calculations.
The SF Fed Business Sentiment Index generally tracks the movements in national GDP over the past decade; a correlation coefficient of +0.63 on a scale of –1 to 1 indicates a moderately strong positive relationship between the two measures. A relatively recent exception started in 2022, when our index began showing a considerable decline relative to the national GDP measure. Respondents across the District were downbeat about economic growth and reported expectations of a sharp decline in consumer spending and overall household financial health following the depletion of pandemic-era savings (Abdelrahman and Oliveira 2023). A similar decline appeared in other measures of business and household sentiment. Nevertheless, overall economic growth continued at a solid pace. This decoupling between sentiment and hard data that began in 2022 was dubbed a “vibecession” (Daly 2024, Scanlon 2022).
Another possible reason for the divergence between national real GDP and our Business Sentiment Index is the influence of the regional economy. Although respondents are asked about their views of national GDP, their responses may be affected by regional outcomes. Thus, our index may also reflect a regional perspective from our business and community contacts.
Figure 2 supports this rationale, showing the SF Fed Business Sentiment Index alongside a measure of regional output growth (gold line). We find that the measures closely track one another, including for 2022 and 2023, with a correlation coefficient of +0.74. We define District real GDP growth as the year-over-year percent change in the total output of the District’s nine states as reported by the Bureau of Economic Analysis (BEA). We normalize the series as described before.
Figure 2
Regional economic growth and business sentiment
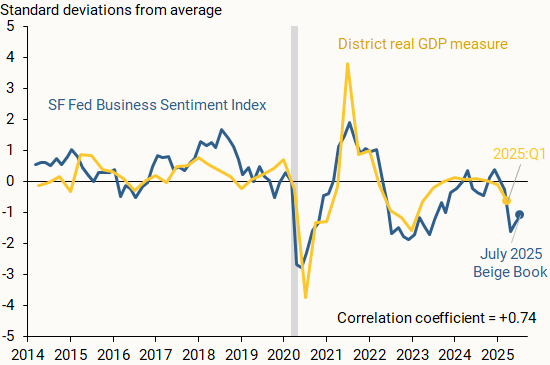
Notes: Indicators normalized by their respective averages and standard deviations based on data from 2014 to present. Gray bar indicates NBER recession dates. Correlation coefficient is calculated between quarterly versions of both indicators.
Source: Bureau of Economic Analysis, FRBSF Beige Book questionnaire responses, and authors’ calculations.
Our findings indicate that the SF Fed Business Sentiment Index can serve as an accurate early indicator for national and regional output growth. Since the regional Beige Book questionnaire is collected twice each quarter, it provides particularly timely insights into economic activity during the current quarter. By contrast, the first GDP data release for any given quarter usually arrives a full month after that quarter has ended, and initial data releases for state-level output growth arrive with even more delay.
Over the first half of this year, the SF Fed Business Sentiment Index turned negative, with contacts citing elevated uncertainty about trade policy and downbeat expectations for the labor market. This notable decline is also seen in other measures of household and business sentiment, including national measures, such as the University of Michigan’s Surveys of Consumers, and regional measures, such as the Cleveland Fed’s Survey of Regional Conditions and Expectations and the Dallas Fed’s Texas Business Outlook Surveys.
Gauging business views on inflationary pressures
Our Beige Book questionnaire responses also provide insights into how business and community contacts in the District see national inflation evolving. Figure 3 compares the SF Fed Inflation Gauge Index (blue line) with monthly changes in the year-over-year headline personal consumption expenditures (PCE) inflation rate published by the BEA (green line). We normalize the inflation series and index as discussed earlier.
Figure 3
SF Fed Inflation Gauge Index versus realized inflation
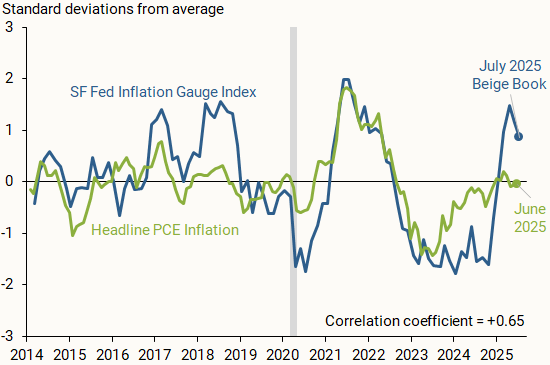
Notes: Green line is the percentage point change in year-over-year headline PCE inflation shown as a 6-month moving average. Indicators normalized by their respective averages and standard deviations based on data from 2014 to present. Gray bar indicates NBER recession dates. Correlation coefficient is calculated between quarterly versions of both indicators.
Source: Bureau of Economic Analysis, FRBSF Beige Book questionnaire responses, and authors’ calculations.
Similar to our business sentiment index, the inflation gauge index is an early indicator for official inflation data releases. The index generally tracks changes in headline PCE inflation over the past decade, with a correlation coefficient of +0.65.
The most recent index results suggest a strong uptick in expected inflation among SF Fed business contacts, with several responses citing trade policy adjustments and inflation being persistently above the Federal Reserve’s 2% target. The recent peak resembles the one in 2018, which followed heightened trade tensions with China. The surge tracks other business and household-based measures of short-term inflation expectations, such as the Atlanta Fed’s Business Inflation Expectations and the New York Fed’s Survey of Consumer Expectations.
Making better projections
Beyond tracking data on national and regional economic conditions, we consider whether our two indexes can help improve one-year-ahead projections of output growth and overall inflation. We run linear regressions on a 2014–2022 data sample and estimate out-of-sample projections for the period starting in the first quarter of 2023. We run this analysis for the three economic measures—national GDP, regional GDP, and inflation—once with our index included on the right-hand side of the regression equation and once without the index. For this analysis, we use versions of the SF Fed Business Sentiment Index and the SF Fed Inflation Gauge Index that have been aggregated quarterly.
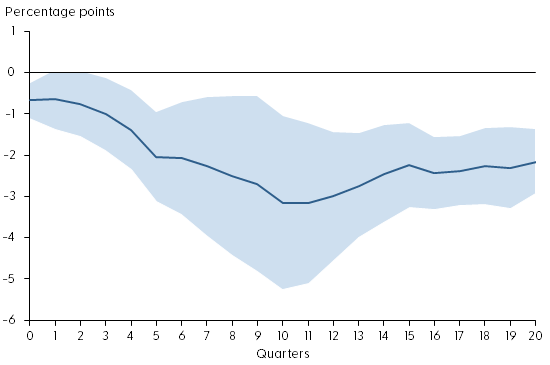
Figure 4 compares the out-of-sample projection accuracy of the two iterations. Across all economic measures, incorporating the SF Fed Business Sentiment Index or the SF Fed Inflation Gauge Index in the regression noticeably reduced the forecast errors for the out-of-sample period. This general result appears to hold when we project output growth and inflation one quarter ahead, in line with other studies that incorporate soft data from the Beige Book in short-term projections (Balke and Petersen 2002). The results are also consistent when using a local projections method from Jordà (2005) for one-year-ahead projections of output growth and shorter-term projections of inflation. This further supports the usefulness of our qualitative measures as early indicators of the future economic landscape over the short term.
Figure 4
Forecast errors with and without SF Fed sentiment indexes
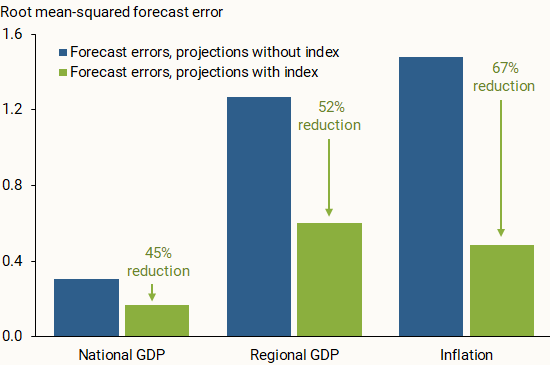
Notes: Root mean-squared errors of out-of-sample projections from 2023:Q1 to 2025:Q2 including and excluding the SF Fed Business Sentiment Index (for GDP) and SF Fed Inflation Gauge Index (for inflation).
Source: Bureau of Economic Analysis, FRBSF Beige Book questionnaire responses, and authors’ calculations.
Conclusion
Information collected from businesses and communities through the San Francisco Fed’s regional Beige Book questionnaire can provide valuable insights into the national and regional economies. Sentiment indexes described in this Letter use responses from Twelfth District Beige Book contacts to generally track economic activity and inflation. Our two indexes serve as reliable early indicators of official data, which could help improve near-term forecast accuracy. The SF Fed Business Sentiment Index remained negative for much of 2022 and 2023, possibly reflecting more subdued growth within the District relative to the United States. Meanwhile, the SF Fed Inflation Gauge Index spiked in recent months following adjustments to trade policy.
References
Abdelrahman, Hamza, and Luiz E. Oliveira. 2023. “The Rise and Fall of Pandemic Excess Savings.” FRBSF Economic Letter 2023-11 (May 8).
Balke, Nathan S., and D’Ann Petersen. 2002. “How Well Does the Beige Book Reflect Economic Activity? Evaluating Qualitative Information Quantitatively.” Journal of Money, Credit and Banking 34 (1), pp. 114–136.
Daly, Mary C. 2024. “Fireside Chat with Mary C. Daly at the San Diego County Economic Roundtable.” January 19.
Jordà, Òscar. 2005. “Estimation and Inference of Impulse Responses by Local Projections.” American Economic Review 95(1), pp. 161–182.
Scanlon, Kyla. 2022. “The Vibecession: The Self-Fulfilling Prophecy.” Kyla Substack (June 30).
Shapiro, Adam Hale, Moritz Sudhof, and Daniel Wilson. 2022. “Measuring News Sentiment.” Journal of Econometrics 228(2), pp. 221–243.