[from IMF Blog, by Zeina Hasna, Florence Jaumotte & Samuel Pienknagura]
Coordinated climate policies can spur innovation in low-carbon technologies and help them spread to emerging markets and developing economies
Making low-carbon technologies cheaper and more widely available is crucial to reducing harmful emissions.
We have seen decades of progress in green innovation for mitigation and adaptation: from electric cars and clean hydrogen to renewable energy and battery storage.
More recently though, momentum in green innovation has slowed. And promising technologies aren’t spreading fast enough to lower-income countries, where they can be especially helpful to curbing emissions. Green innovation peaked at 10 percent of total patent filings in 2010 and has experienced a mild decline since. The slowdown reflects various factors, including hydraulic fracking that has lowered the price of oil and technological maturity in some initial technologies such as renewables, which slows the pace of innovation.
The slower momentum is concerning because, as we show in a new staff discussion note, green innovation is not only good for containing climate change, but for stimulating economic growth too. As the world confronts one of the weakest five-year growth outlooks in more than three decades, those dual benefits are particularly appealing. They ease concerns about the costs of pursuing more ambitious climate plans. And when countries act jointly on climate, we can speed up low-carbon innovation and its transfer to emerging markets and developing economies.
IMF research [archived PDF] shows that doubling green patent filings can boost gross domestic product by 1.7 percent after five years compared with a baseline scenario. And that’s under our most conservative estimate—other estimates show up to four times the effect.
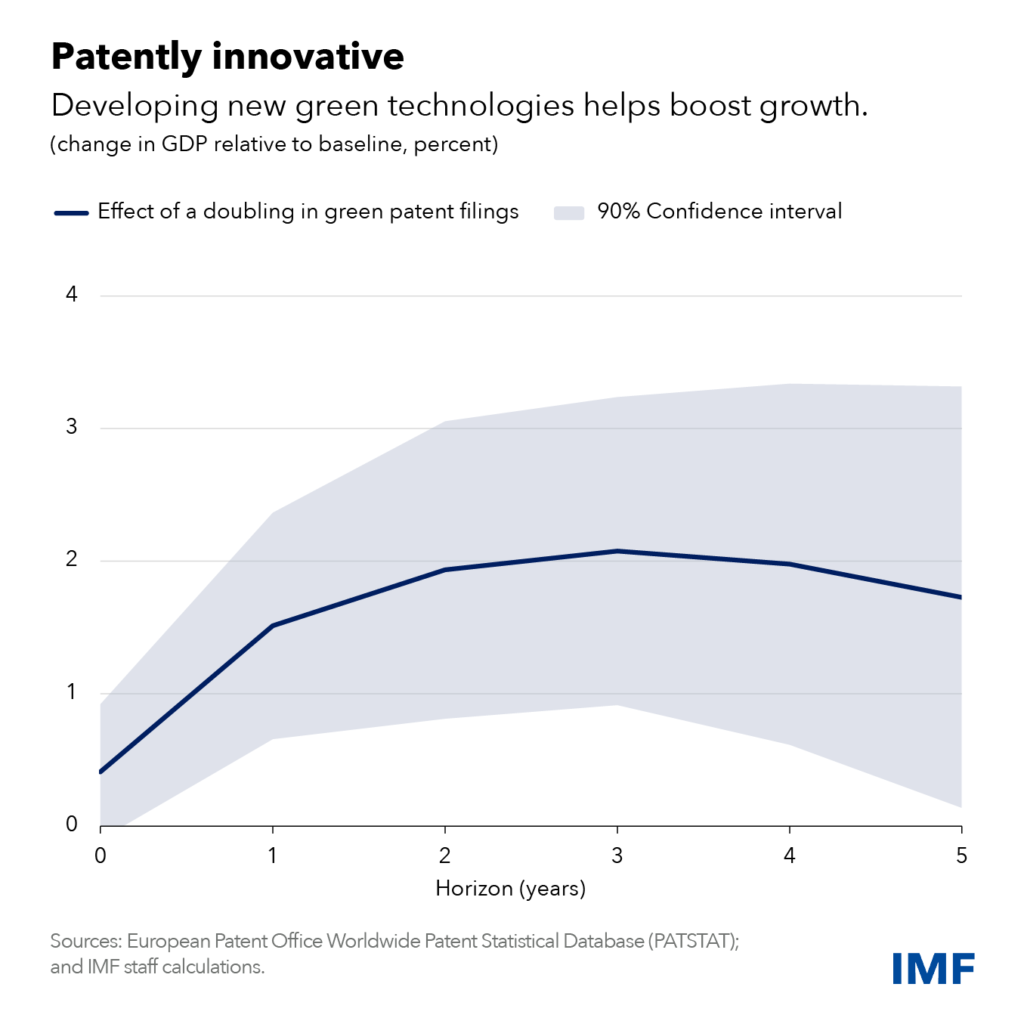
The economic benefits of green innovation mostly flow through increased investment in the first few years. Over time, further growth benefits come from cheaper energy and production processes that are more energy efficient. Most importantly, they come from less global warming and less frequent (and less costly) climate disasters.
Green innovation is associated with more innovation overall, not just a substitution of green technologies for other kinds. This may be because green technologies often require complementary innovation. More innovation usually means more economic growth.
A key question is how countries can better foster green innovation and its deployment. We highlight how domestic and global climate policies spur green innovation. For example, a big increase in the number of climate policies tends to boost green patent filings, our preferred proxy for green innovation, by 10 percent within five years.
Some of the most effective policies to stimulate green innovation include emissions-trading schemes that cap emissions, feed-in-tariffs, which guarantee a minimum price for renewable energy producers, and government spending, such as subsidies for research and development. What’s more, global climate policies result in much larger increases in green innovation than domestic initiatives alone. International pacts like the Kyoto Protocol and the Paris Agreement amplify the impact of domestic policies on green innovation.
One reason policy synchronization has a prominent impact on domestic green innovation is what is called the market size effect. There’s more incentive to develop low-carbon technologies if innovators can expect to sell into a much larger potential market, that is, in countries which adopted similar climate policies.
Another is that climate policies in other countries generate green innovations and knowledge that can be used in the domestic economy. This is known as technology diffusion. Finally, synchronized policy action and international climate commitments create more certainty around domestic climate policies, as they boost people’s confidence in governments’ commitment to addressing climate change.
Climate policies even help spread the use of low-carbon technologies in countries that are not sources of innovation, through trade and foreign-direct investment. Countries that introduce climate policies see more imports of low-carbon technologies and higher green FDI inflows, especially in emerging markets and developing economies.
Risks of protectionism
Lowering tariffs on low-carbon technologies can further enhance trade and FDI in green technologies. This is especially important for middle- and low-income countries where such tariffs remain high. On the flipside, more protectionist measures would impede the broader spread of low-carbon technologies.
In addition, and given evidence of economies of scale, protectionism—with ultimately smaller potential markets—could stifle incentives for green innovation and lead to duplication of efforts across countries.
The risks of protectionism are exacerbated when climate policies, such as subsidies, do not abide by international rules. For example, local content requirements, whereby only locally produced green goods benefit from subsidies, undermine trust in multilateral trade rules and could result in retaliatory measures.
Beyond embracing a rules-based approach to climate policies, the advanced economies, where most green innovation occurs, have an important responsibility: sharing the technology so that emerging and developing economies can get there faster. Such direct technology transfers hold the promise of a double dividend for emerging markets and developing economies—reducing emissions and yielding economic benefits.
—This blog reflects research by Zeina Hasna, Florence Jaumotte, Jaden Kim, Samuel Pienknagura and Gregor Schwerhoff.